Docosahexaenoic acid enhances the antioxidant response of human fibroblasts
by upregulating g-glutamyl-cysteinyl ligase and glutathione reductase
Khelifa Arab
1,2, Adrien Rossary
1,2, Franc¸oise Flourie´
1, Yves Tourneur
3and Jean-Paul Steghens
1,2*
1UF 21455 Oxidative Stress and Vitamins, Biochemistry Federation, E. Herriot Hospital, Lyon, France
2EA 3090, Claude Bernard University Lyon 1, France
3Quantimetry Center, Pharmacy Faculty, Claude Bernard University Lyon 1, France
(Received 5 May 2005 – Revised 18 August 2005 – Accepted 18 September 2005)
The chemopreventive effects of dietary n-3 PUFA in various pathologies has so far remained controversial, and we were interested in studying their potential influence on cell redox status. DHA (22 : 6n-3), a typical highly unsaturated n-3 PUFA, was used at 30 mmol/l in a model of human fibroblast cell culture. A dose – response effect, roughly linear, was checked for DHA between 0 and 60 mmol/l, and was accompanied by a large increase in intracellular GSH content. A time course study of this effect shows that, after a short fall, as soon as 4 h after the beginning of the experiment, the large increase in the GSH content was associated with elevated catalytic activities of g-glutamyl-cysteinyl ligase, gluta-thione reductase and glutagluta-thione S-transferase. This coordinated response is characteristic of an antioxidant response and was confirmed by the induction of expression of mRNA for g-glutamyl-cysteinyl ligase, glutathione reductase and haem-oxygenase. This large increase in the GSH content contributes to decreasing the reactive oxygen species level, as assessed by the decreased accumulation of dichlorofluorescein inside cells. To our knowledge, this is the first report on a specific and potent effect of DHA for decreasing the oxidative stress of human fibroblasts. Docosahexaenoic acid: Chemoprevention: Thiol-redox status: Fibroblasts: Glutathione: Oxidative stress
There is some evidence that n-3 PUFA exert protective effects in many diseases (Martinez et al. 2000; Larsson et al. 2004). They have been considered to be associated with a decrease in genotoxic markers after ultraviolet exposure (Rhodes et al. 2003), and a reduction in plasma biomarkers of inflammation and endothelial activation in a large cross-sectional study of 727 women (Lopez-Garcia et al. 2004).
When DHA (22 : 6n-3), a typical n-3 PUFA, is added to cell culture media, it has been shown to be incorporated into phos-pholipid membranes and to modify membrane biophysical characteristics and functions (Brown & Subbaiah, 1994). Its effects seem complex and sometimes controversial, and they are tentatively explained in different ways: in human pancrea-tic tumour cells, DHA induces apoptosis, associated with a dramatic depletion of reduced GSH without any change in oxi-dised glutathione (GSSG) (Merendino et al. 2003). An anti-apoptotic effect of DHA was demonstrated in neuronal cells, which may be mediated by an increase in phosphatidylserine membrane concentrations (Kim et al. 2000). As a pro- or anti-oxidative effect is often put forward to explain the mode of action of DHA, we were interested in studying its time-depen-dent influence on the thiol-redox status of a cell model with human fibroblasts.
GSH (L-g-glutamyl-cysteinyl-glycine), the main cell
antiox-idant, is an intracellular tripeptide, with an important role in
cell thiol homeostasis: it is the key compound of an integrated antioxidant system that protects cells and tissues from oxi-dative damage (Wu et al. 2004). Cells contain millimolar quantities of GSH, which are used by several pathways includ-ing reactions of transferases with xenobiotics or with lipid per-oxidation products such as 4-hydroxy-nonenal (Anderson, 1997). GSH is synthesised by two successive ATP-dependent enzymes, the first of which, g-glutamyl cysteinyl ligase (g-GCL), is the limiting one. That is why we decided to explore the potential relationship between thiol-redox status and DHA in this model of human fibroblasts to explain the beneficial effect of this fatty acid.
Materials and methods Reagents
DHA methyl ester, GSSG, GSH, PBS, 2,a-aminobutyrate and
L-glutamate were from Sigma-Aldrich (Saint-Quentin, France);
reduced ADPH, ATP, phosphoenolpyruvate and pyruvate
kinase from Roche (Meylan, France); 20,70-dichlorofluorescein
diacetate (H2DCF-DA) from Fluoroprobe (Interchim,
Montlu-c¸on, France); and Meth-Prep II from Alltech (Templemars, France). All other reagents were of analytical grade. DHA
methyl ester stock solution (150 mM) was prepared in ethanol,
* Corresponding author: Dr Jean-Paul Steghens, fax þ 33 4 72 11 06 75, email jean-paul.steghens@chu-lyon.fr
Abbreviations:ARE, antioxidant responsive element; g-GCL, g-glutamyl-cysteinyl ligase; GR, glutathione reductase; GST, glutathione S-transferases; H2DCF-DA,
20,70-dichlorofluorescein diacetate; HO-1, haem-oxygenase 1; ROS, reactive oxygen species.
qThe Authors 2006
. IP address:
118.70.52.165
, on
24 Jun 2021 at 08:34:37
, subject to the Cambridge Core terms of use, available at
https://www.cambridge.org/core/terms
.
divided into aliquots in brown glass vials and stored under N2at 2 208C.
Cell culture
Primary human fibroblasts were a gift from Dr Damour of the Tissues and Cell Bank HCL, Hopital Edouard Herriot, Lyon, France. The human fibroblasts were grown in Dulbecco’s Modified Eagle Medium (DMEM) containing 10 % fetal calf serum (GIBCO; Invitrogen, Cergy-Pontoise, France), 2·5 mg/ml fungizone, 98 IU/ml penicillin and 98 mg/ml strepto-mycin (Cambrex; Invitrogen). Cultures were maintained at
378C in a humidified atmosphere with 5 % CO2.
The culture medium was supplemented with DHA methyl ester (30 mmol/l) under two control conditions: medium with 0·2 % ethanol and medium alone. The DHA stock solution was dissolved in DMEM with 10 % fetal calf serum in a ratio of 1:5000 (v/v). Cells were grown for different periods of time, up to 7 d, and the culture medium was changed every day.
At 0, 4, 8, 24, 48 h or at 7 d, cells were harvested by tryp-sinisation and washed twice with PBS. Cells were collected in 500 ml Tris HCl (50 mmol/l), pH 7·4, 0·2 % Tween 20, and 50 ml were processed immediately for GSH and GSSG measurement. They were first vortex-mixed with a solution (100 ml) containing N-ethyl-maleimide, EDTA and g-gluta-mylglutamic acid as an internal standard, incubated for 20 min at room temperature and then deproteinised with sulpho-5-salicylic acid. Final concentrations were as originally described (Steghens et al. 2003).
For other tests, the cells were lysed with two successive freezing and thawing operations with 15 s sonication. The cell extracts were stored at 2 208C until analysis. For fatty acid analysis, cells were, after washing, collected and lysed by repeated freezing and thawing in 500 ml PBS (50 mmol/l) pH 7·4. Cell extracts were stored at 2 808C until analysis. Cell extract proteins were measured by bichromatic spectro-photometry (570 and 700 nm) with bicinchonic acid (Pierce; Biotechnology Inc, Rockford, IL, USA), at 378C, on a Kone analyser (Kone, Eury, France) with human albumin as standard.
Thiol-redox status
GSSG and GSH. Glutathione was measured by liquid
chromatography – mass spectrometry as previously described (Steghens et al. 2003), with a slight modification for the sample preparation (see earlier). The processed sample was diluted 1:5 in distilled water and subjected to liquid chroma-tography – mass spectrometry analysis.
Glutathione reductase. Glutathione reductase (GR) was
measured on a Kone analyser using a method adapted from
Worthington & Rosemeyer (1974). The first reagent R1
(200 ml) was 90 mmol/l Tris-HCl, 1 mmol/l EDTA and
0·16 mmol/l NADPH. R2, the starting reagent (10ml), was
4·6 mmol/l GSSG. All concentrations were indicated as final concentrations in the measurement cuvette. The cell extract was diluted in 0·9 % NaCl (1:3 v/v) before measurement, and 30 ml of the dilution was used as the sample. The kinetic analysis was carried out at 378C and 340 nm for 2 min in duplicate. The effect of GSH (0, 0·5, 1, 2 and 4 mmol/l) was
tested on the catalytic activity of different cell extracts; no change was detected.
g-Glutamyl-cysteine ligase activity. The activity of
g-GCL was determined by a new kinetic liquid chromatog-raphy – mass spectrometry method (Chik et al. 2005). Briefly, after incubating the cell extract (three aliquots of 10 ml each) at 378C in 70 ml of the first reagent (25 mmol/l Tris, 150 mmol/
l KCl, 20 mmol/l MgCl2, 2 mmol/l EDTA, 40 mmol/lL
-gluta-mate, 5·6 mmol/l Na2ATP, 2·2 mmol/l phosphoenolpyruvate,
3·4 IU/mL pyruvate kinase, pH 8·6), the reaction was triggered
by 20 ml 20 mM2,a-aminobutyrate (R2) and then stopped after
2, 4 or 6 min (depending on the aliquot) by adding sulpho-5-salicylic acid. The slope of production of g-glutamyl aminobutyrate, as measured by liquid chromatography – mass spectrometry, corresponded to the catalytic activity, and the results were expressed as IU/mg protein.
Glutathione S-transferase activity. Glutathione
S-transfer-ase (GST) activity was measured on a Kone analyser with a kinetic analysis at 378C and 340 nm, adapted from Habig et al. (1974) with the first reagent (160 ml) in HEPES buffer at pH 7·5 containing GSH (5 mmol/l). The second reagent
was 1-chloro 2,4-dinitrobenzene (0·1 mmol/l, 20 ml) as
second substrate. The method needed 20 ml of a diluted cell extract prepared as described for GR measurement. A blank reagent was measured and systematically subtracted.
Fatty acid analysis
Lipids were extracted from 200 ml cell extract (approximately
106cells) with chloroform – methanol (2:1 v/v), with
di-palmi-toyl-d31-phosphatidylcholine as the internal standard. Fatty
acid methyl esters were formed after hydrolysis by
transmethylation of the lipids with Meth-Prep II (Alltech). Analyses were carried out on a HP 5980 gas chromato-graph (Agilent, Massy, France) equipped with a flame ionisation detector maintained at 2208C, an HP6980 auto
injector (Agilent), a 1 m silanised precolumn and a
30 m £ 0·32 mm £ 0·2 mm SP2340 fused silica capillary
column (Supelco, Saint-Quentin, France). The run time was 60 min. Results are expressed as mmol/l or Mol %.
Lipoperoxide measurement
Lipoperoxides were measured in cell culture media, alone as a control or supplemented with 30 mmol/l DHA methyl ester, using a previously published method (Arab & Steghens 2004). Quantification of mRNA by real-time RT-PCR analysis Total RNA was extracted from fibroblasts with the RNeasy Micro Kit (Qiagen; Invitrogen, Cergy-Pontoise, France), according to the manufacturer’s instructions. Reverse tran-scription was performed with a First-Strand cDNA kit assay (Amersham Biosciences, Freiburg, Germany).
Primers were designed using Primer3 software (2005). Expression levels of human g-GCL (heavy subunit), GR, haem-oxygenase 1 (HO-1) and the housekeeping gene b-actin were determined using the following primer pairs:
for-ward g-GCL (50-GAACTGGCTTGTACATTTT-30) and
reverse g-GCL (50-CAAAGGAAAATTAACGAGAG-30);
forward GR (50-GTCAGTGGGAAAAAGTACAC-30) and
. IP address:
118.70.52.165
, on
24 Jun 2021 at 08:34:37
, subject to the Cambridge Core terms of use, available at
https://www.cambridge.org/core/terms
.
reverse GR (50-GTACCTTATCATGCCGTATC-30); forward
HO-1 (50-ACAGTTGCTGTAGGGCTTTA-30) and reverse
HO-1 (50-CTCTGAAGTTTAGGCCATTG-30); forward
b-actin (50-TCGTGCGTGACATTAAGGAG-30) and reverse
b-actin (50-AGCACTGTGTTGGCGTACAG-30). Specificity
of the products was demonstrated for each fragment by melting curve analysis and gel electrophoresis.
The quantification of cDNA was carried out on a LightCy-cler (Roche). The following thermocyLightCy-cler programme was used for real-time PCR: 10 min preincubation at 958C, fol-lowed by 55 cycles (958C for 15 s, 538C for 5 s, 728C for 10 s). b-Actin was used to standardise the total amount of cDNA. Relative mRNA levels were determined by comparing the PCR cycle threshold between the cDNA of the target enzymes (g-GCL, GR, HO-1) and b-actin, and the expression was compared with the basal level of the related genes.
Evaluation of reactive oxygen species by dichlorofluorescein fluorescence
H2DCF-DA, after desacetylation inside the cell, becomes a
probe sensitive to reactive oxygen species (ROS) such as
H2O2, the superoxide anion (O·22 ) and hydroxyl radicals
(OH·). The procedure for its use was adapted from Carter
et al. (1994). After 0, 4, 8, 24, 48 h and 7 d of culture, the
cells were washed twice, incubated with 2 mmol/l H2
DCF-DA at 378C for 30 min and subjected to fluorescent flow cyto-metry analysis (Vantage; Becton Dickinson, Le Pont de
Clairx, France): the oxidation of H2DCF was measured as
an increase in fluorescence at 530 nm on a log scale for 10 000 events (cells counted).
For cell imaging, the cells were washed twice, incubated
with 1 mmol/l H2DCF-DA at 378C for 30 min, and subjected
to microscopic confocal fluorescent imaging. Excitation and emission wavelengths were 488 nm and 540 nm, respectively. After acquisition on a Leica TCS ST2 (Leica, Le Pecq, France), the fluorescence quantification was carried out with an ImageJ 1.32j software package (Wayen Rasband, NIH, Bethesda, MA, USA).
Statistical data analysis
GraphPad 2.1 (Deltapoint, Monterey, CA, USA) was used for statistical analysis. Data were compared with ANOVA test. With P, 0·05, the Dunnet multicomparison test was used to compare samples treated with DHA v. ethanol controls. All the data are expressed as means with their standard errors. Results
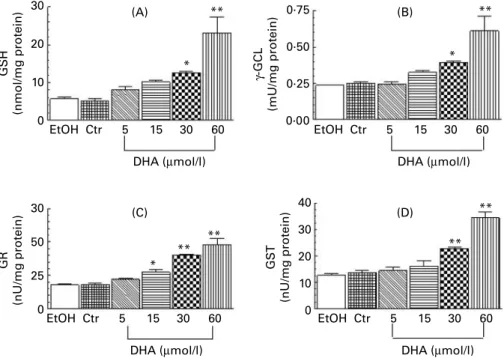
Dose – effect relationship between DHA and thiol-redox status The dose – effect relationship was studied in triplicate, after 48 h, with four concentrations of DHA from 5 mmol/l to 60 mmol/l (Fig. 1). A linear increase was measured for GSH (Fig. 1(A)). The increase in the catalytic activities of g-GCL (Fig. 1(B)), GR (Fig. 1(C)) and GST (Fig. 1(D)) was highly
correlated with the concentration of DHA (r2. 0·94). The
increased GSH content could be explained directly by the increased g-GCL and GR activities. It is noteworthy that we did not detect any GSSG, even with 60 mmol/l DHA. The sim-ultaneous increase in GSH and g-GCL, GR and GST activities strongly suggested a coordinated antioxidant response. The 30 mmol/l concentration of DHA induced a significant difference from controls for all the biomarkers used, and this concentration, considered physiological, was used for further experiments.
Fig. 1. Dose-relationship effect of increasing DHA concentrations (0 – 60 mmol/l) on the thiol-redox status of human fibroblasts, at 48 h. (A) GSH cell content. (B), g-glutamyl-cysteinyl ligase (g-GCL), (C) glutathione reductase (GR) and (D) glutathione S-transferase (GST) activities of the cell extracts. The measurements, made in triplicate, were expressed as means with their standard errors shown by vertical bars. EtOH, ethanol; Ctr, control. *P, 0·05, **P, 0·01.
. IP address:
118.70.52.165
, on
24 Jun 2021 at 08:34:37
, subject to the Cambridge Core terms of use, available at
https://www.cambridge.org/core/terms
.
Time course of the antioxidative response under DHA treatment
GSH homeostasis. After a decrease of 30 % at 8 h, the level of GSH, the main intracellular antioxidant, was restored before 24 h and was twice that of the control at 48 h (Fig. 2(A)). This replenishment was associated with a doubling of g-GCL catalytic activity (Fig. 2(B)). GR activity appeared to parallel GSH content, and its activity (Fig. 2(C)), like that of GST, increased more slowly but remained twice that of the initial values, at 48 h (Fig. 2(D)).
The expression of g-GCL heavy subunit mRNA increased progressively up to 8-fold at 8 h and remained significantly higher than the basal level expression, at 24 and 48 h (Fig. 3(A)). GR mRNA began to increase only at 24 h and was 3·5 times higher than the basal level at 48 h (Fig. 3(B)). As HO-1 does not take part in the regulation of the cell gluta-thione metabolism but is known to be induced very early during the antioxidant response (Lee et al. 2003b), we decided to use it to confirm that DHA induced an antioxidant response. The results in Fig. 3(C) show a high HO-1 induction (3·5-fold) as soon as 4 h, a stable level (3-fold) at 8 h and a level similar to that of the control at 24 h.
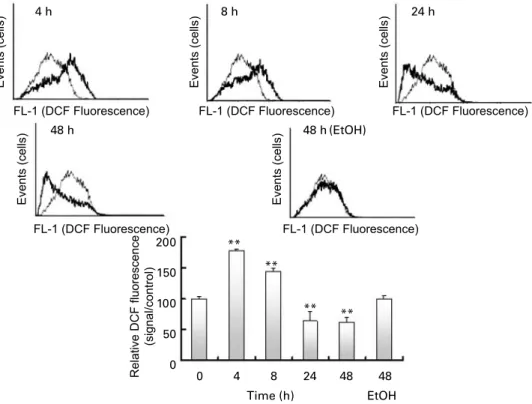
Evaluation of reactive oxygen species
At the same time points, the ROS level was assessed by dichlorofluorescein fluorescence with flow cytometry. The results are shown in Fig. 4. DHA induced ROS production, peaking at 4 h with the highest fluorescence, which then slowly decreased to a level lower than the control at 24 or 48 h. The ROS level seemed to parallel HO-1 mRNA transcription.
Cell fatty acid analysis
This analysis was carried out after 48 h of culture to confirm that the antioxidative response was associated with a modifi-cation in the fatty acid cell content. The results, presented in Table 1, were expressed as absolute amounts and showed an enrichment of all classes of fatty acid: saturated, MUFA and PUFA, with the exception of arachidonic acid (20 : 4n-6) which remained constant. The main increase (3- or 4-fold) was detected for DHA and EPA and confirmed their metabolic interconversion. The second main increase was that of satu-rated fatty acid, as previously described by Brown & Subbaiah (1994). If results are expressed as a percentage, the percentage of saturated fatty acid was similar to that of the ethanol con-trol, and n-3 PUFA showed the main increase (2-fold). These results implied a slight decrease in MUFA and/or PUFA n-6, which in fact concerned essentially arachidonic acid.
Long term treatment with DHA. Long-term
supplemen-tation (7 d) induced an antioxidative response similar to that observed during the dose relationship study, with increased g-GCL (Fig. 5(B)), GR (Fig. 5C) and GST (Fig. 5(D)) activi-ties and, interestingly, an approximately 4-fold increase in the
GSH content (Fig. 5(A)). GSSG, however, remained
undetectable.
Flow cytometry showed that ROS production was restored to the control level, and confocal microscopic analysis was used to check that the shape of the cells remained unchanged (data not shown).
Discussion
DHA is an n-3 PUFA present in human diet through fish and marine products. Fatty acids of the n-3 family are often
Fig. 2. Time course evolution, during the first 48 h, of the thiol-redox status of human fibroblasts supplemented with 30 mmol/l DHA. (A) GSH cell content. (B), g-glutamyl-cysteinyl ligase (g-GCL), (C) glutathione reductase (GR) and (D) glutathione S-transferase (GST) activities in cell extracts. The measurements were expressed as means with their standard errors (n 4 for each time point). *P, 0·05, **P, 0·01.
. IP address:
118.70.52.165
, on
24 Jun 2021 at 08:34:37
, subject to the Cambridge Core terms of use, available at
https://www.cambridge.org/core/terms
.
suggested to be beneficial for health because of decreased car-diovascular risk and an improvement in immune function and/ or in resistance to oxidative stress (Ziboh et al. 2000; Kris-Etherton et al. 2002; Wen et al. 2003). They could also be effi-cient in cancer prevention (Akihisa et al. 2004).
It is difficult to know whether these effects should be ascribed to a specific fatty acid or to the n-3 family in general.
Besides these positive effects, DHA is, because of its double bonds, considered a main target for ROS and lipoperoxidation: this property, for example, is claimed to increase anthracycline cytotoxicity in some cancer models (Germain et al. 1998). Another way to explain their positive effects involves the pro-duction of specific DHA derivatives (neuroprotectin) or the modulation of NO production (Komatsu et al. 2003;
Fig. 3. Fibroblast mRNA quantification of g-glutamyl-cysteinyl ligase (g-GCL; (A)), glutathione reductase (GR; (B)) and haem-oxygenase 1 (HO-1; (C)) after five different time periods with DHA. Quantification is normalised through b-actin mRNA. The data shown are the mean of three independent experiments. The measurements were expressed as means with their standard errors shown by vertical bars. EtOH, ethanol. *P, 0·05, **P, 0·01.
Events (cells)
Events (cells)
FL-1 (DCF Fluorescence) FL-1 (DCF Fluorescence) FL-1 (DCF Fluorescence)
FL-1 (DCF Fluorescence) FL-1 (DCF Fluorescence)
Events (cells)
Events (cells) Events (cells)
Relative DCF fluorescence
(signal/control)
Fig. 4. Reactive oxygen species (ROS) evaluation by dichlorofluorescein fluorescence flow cytometry analysis after 0, 4, 8, 24 or 48 h with DHA treatment, includ-ing an ethanol (EtOH) control at 48 h. Flow cytometry analysis was carried out with 105cells in each experiment. A typical experiment is shown with, at each time
point, the measurement (dark trace) compared with the time 0 control (grey trace). The results are expressed as a relative fluorescent cell number (means with their standard errors shown by vertical bars), and each graph bar is the result of six independent experiments. **P, 0·01.
. IP address:
118.70.52.165
, on
24 Jun 2021 at 08:34:37
, subject to the Cambridge Core terms of use, available at
https://www.cambridge.org/core/terms
.
Marcheselli et al. 2003). Several studies indicate that treat-ment with n-3 PUFA induces a large modification in gene expression (Davidson et al. 2004), but nothing has been reported on the possible modification of thiol-redox status. The goal of our study was to understand the potential relation-ship between DHA and thiol-redox status in a model of human fibroblasts. The main feature of our study was that the ben-eficial effect of DHA seemed to be mediated by the induction of a strong antioxidant response in cells.
Cell fatty acid analysis, in our model, indicated that DHA treatment induced an enrichment of DHA and EPA, and also led to a slight decrease in arachidonic acid level, when expressed as a percentage. These changes are in agreement with previous studies (Brown & Subbaiah, 1994).
The dose – response effect shown in Fig. 1 earlier allows us to conclude that DHA itself induces the synthesis of gluta-thione, along with the induction of the enzymes known to upregulate the intracellular glutathione pool. An increase in GSH content is usually known as an adaptive response to xenobiotic oxidant insults (Shi et al. 1994). The concen-trations of lipoperoxides in the cell culture medium alone or supplemented with DHA methyl ester (30 mmol/l) were 1·9
(SE 0·18) and 2·1 (SE 0·04) mmol/l (n 3), respectively, and
we can exclude lipoperoxides being responsible for the bio-logical effects we describe.
In the time course of the study, the very first event is an overproduction of ROS and an induction of expression of HO-1 mRNA, which is seen as soon as 4 h after adding Table 1. Fatty acid analysis of human fibroblasts supplemented with 30 mmol/l DHA for 48 h
(Results (n 3) expressed as nM/million cells)
Control Ethanol DHA
Major fatty acid Mean SE Mean SE Mean SE
14 : 0 8·4 0·40 9·5 0·21 13·1** 0·25
16 : 0 98·7 1·95 89·7 3·65 134·1** 2·78
18 : 0 50·5 0·96 46·6 1·81 71·5** 1·39
Total saturated fatty acid 158·75 144·73 218·77
A16 : n7c 10·9 0·28 9·3 0·37 13·3** 0·26 A18 : n9c 86·1 1·82 75·7 2·86 102·28** 2·09 A18 : n7c 16·0 0·67 18·3 0·38 21·1** 0·45 Total MUFA 115·38 101·03 136·62 A18 : 2n-6 28·3 0·63 27·9 1·52 41·2** 0·73 A20 : 3n-6 14·3 0·27 13·3 0·62 17·3** 0·33 20 : 4n-6 36·0 0·78 32·7 1·35 38·7 0·65 Total PUFA n-6 78·72 73·83 97·30 20 : 5n-3 4·3 0·18 4·0 0·14 12·2** 0·25 22 : 6n-3 16·6 0·38 14·7 0·56 44·0** 0·76 Total PUFA n-3 19·85 18·80 56·15 **P, 0·01.
Fig. 5. Thiol-redox status of human fibroblasts after 7 d DHA supplementation with 30 mmol/l. (A) GSH cell content. (B) g-glutamyl-cysteinyl ligase (g-GCL), (C) glutathione reductase (GR) and (D) glutathione S-transferase (GST) activities of the cell extracts. The measurements, made in triplicate, were expressed as means with their standard errors shown by vertical bars. EtOH, ethanol; Ctr, control. *P, 0·05, **P, 0·01.
. IP address:
118.70.52.165
, on
24 Jun 2021 at 08:34:37
, subject to the Cambridge Core terms of use, available at
https://www.cambridge.org/core/terms
.
DHA to the cell medium. It is associated with a decrease in the GSH content, which declines up to 8 h. We could hypoth-esise that this decrease corresponds to a consumption of GSH, for example by GST, to produce mercapturic conju-gates such as that of 4-hydroxynonenal. Liu et al. (2000) demonstrated that 4-hydroxynonenal, below 10 mmol/l, does not alter cell survival, and antioxidants block the activation of apoptosis and DNA fragmentation induced by 4-hydroxy-nonenal at 20 mmol/l. This suggests that cells tolerate small quantities of 4-hydroxynonenal, and the initial GSH decrease we measured could be explained by such a detoxifying pro-cess. As previously demonstrated, g-GCL is induced early (4 h) and, in conjunction with an induction of GR at 24 h, participates in long-term GSH replenishment.
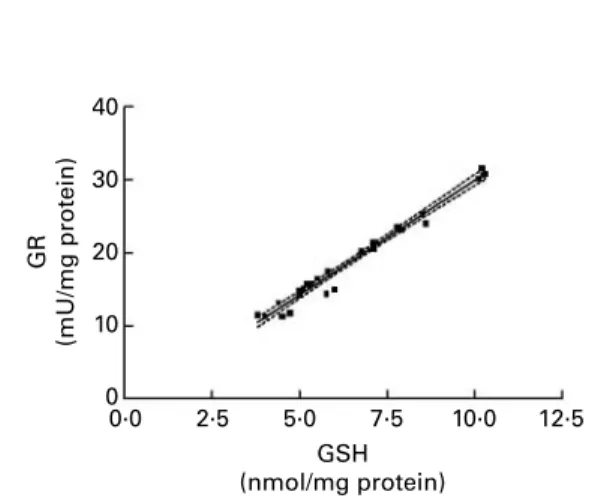
It is noteworthy that GSSG was never detected during our experiments, and all the measurements of GR activity and GSH content carried out for these experiments were highly correlated (Fig. 6). This means that the higher the GSH con-tent, the higher the GR activity. Furthermore, we verified that kinetic GR activity measurement was not dependent on the GSH content of the reagent (in other words, of the GSH content of the cell extract). These results suggest that cells take precautions to avoid any accumulation of GSSG and would argue against the presence of GSSG, as has been pro-posed in recent publications (Dickinson et al. 2002; Rossi et al. 2002; Steghens et al. 2003). Two other sets of data cor-roborate our results: chronic GR inhibition induces oxidative stress (Romero-Ramos et al. 2003), and a depletion of GSH induces a decrease in GR activity (Barker et al. 1996).
After a 7 d treatment, the fibroblasts kept a normal shape, as judged by microscopic analysis, and the enzymatic activities of GR and g-GCL, along with GST, remained high: the result was a pool of GSH four times that of the control, whereas dichlorofluorescein cell fluorescence was normal, leading to a global improvement in the thiol-redox status of the cell owing to the high GSH content.
Classically, the antioxidant response relies on the transcrip-tional activation of GST and g-GCL. Both of these, as well as HO-1 and NADPH quinone oxidoreductase, are described as genes with antioxidant responsive elements (ARE; Wasserman & Fahl 1997; Wild et al. 1999). Levonen et al. (2004) showed that Keap 1 is a cystein redox-sensitive factor, modulated by lipid byproducts, which is involved in the negative regulation of Nrf2. Nrf2 is considered to be a central regulator of the ARE response by transactivation of ARE-dependent genes, after translocation to the nucleus. This kind of redox regu-lation could be implicated in the early gene induction (g-GCL, HO-1) we obtained with DHA. After 24 and 48 h, however, the GSH content still increased, owing to g-GCL and GR induction, whereas the ROS level was low; this second step in the regulation of the antioxidant response (HO-1 not being involved) could result from another mechanism.
The coordinated increase in both mRNA and the activities of GR and g-GCL led us to look for ARE on the GR gene. The ARE pattern consensus sequence, described by Rushmore et al. (1991), was used for sequence comparison of GR with four human sequences known to have these ARE (LocusLink, 2005).
The search was carried out with Clustal W software, version 1.8 (Infobiogen, Eury, France): the GR gene appeared to possess the searched sequence and could be under the regulation of an ARE, as for other enzymes involved in the antioxidant response (Fig. 7). The same search was undertaken for sequence consen-sus of stress responsive elements and tetra phorbol acetate responsive elements, nucleotide-binding domains functionally related to ARE (Alam & Cook, 2003). As for the other genes used for comparison, many sequence similarities were found in the GR gene. This result corroborates a prediction deduced from the identification, by microarray analysis, of Nfr2-dependent genes, which confer protection against oxidative stress in a mouse model (Lee et al. 2003a). These enzymes contribute to cellular protection, and the transcription factors themselves are sensitive to the cell’s redox status. However, as ARE sequences are sometimes non-functional, only a reporter assay could confirm our hypothesis.
Fig. 6. Correlation between GSH content and glutathione reductase (GR) activity for twenty-eight cell samples of the time course study. Pearson r ¼ 0·9883, P, 0·0001; dashed lines indicate 2 95 % CI.
Fig. 7. Antioxidant responsive element (ARE) consensus sequences (GTGACNNNGC, black box) identified in 50distal regions of glutathione reductase (GR) and four other genes used for comparison (HO-1, haem oxygenase I; GCLR, regularory subunit of g-glutamyl-cysteinyl ligase; GSTA3, glutathione S-transferase A3; NQO1, NADPH quinine oxidoreductase I). Positions were calculated from the initial exon start. Gene references were: GR:jNT_007995.14jHs8_8152:841462-910498; HO1:jNT_011520.10jHs22_11677:15127825-15190594; GCLR: jNT_007592.14jHs6_7749:44194601-44323831; GSTA3:jNT_007592.14jHs6_7749: 43677940-43831413; NQO1:jNT_010498.15jHs16_10655:23344695-23387404. . IP address: 118.70.52.165 , on 24 Jun 2021 at 08:34:37
, subject to the Cambridge Core terms of use, available at
https://www.cambridge.org/core/terms
.
In conclusion, our experiments provided convincing evi-dence that DHA is able to induce a fast antioxidant response leading to a large and long-term increase in intracellular GSH. Future work will study the involvement of other PUFA in the regulation of the cell thiol-redox status.
Acknowledgements
We thank Dr Marlin Friesen (IARC) for fatty acid analysis, Sarah Somerville (IARC) for careful English editing and Dr Mireille Serres (INSERM, EA 3732) for flow cytometry anal-ysis. This work was presented in part as an abstract in the 4th Geneva Aging Workshops, 1 – 2 October 2004.
References
Akihisa T, Tokuda H, Ogata M, Ukiya M, Iizuka M, Suzuki T, Metori K, Shimizu N & Nishino H (2004) Cancer chemopreventive effects of polyunsaturated fatty acids. Cancer Lett 205, 9 – 13.
Alam J & Cook JL (2003) Transcriptional regulation of the heme oxygenase-1 gene via the stress response element pathway. Curr Pharm Des 9, 2499 – 2511.
Anderson ME (1997) Glutathione and glutathione delivery compounds. Avd Pharmacol 38, 65 – 78.
Arab K & Steghens JP (2004) Plasma lipid hydroperoxides measure-ment by an automated xylenol orange method. Anal Biochem 325, 158 – 163.
Barker JE, Heales SJR, Cassidy A, Bolanos JP, Land JM & Clark JB (1996) Depletion of brain glutathione results in a decrease of glutathione reductase activity; an enzyme susceptible to oxidative damage. Brain Res 716, 118 – 122.
Brown ER & Subbaiah PV (1994) Differential effects of eicosapenta-noic acid and docosahexaeeicosapenta-noic acid on human skin fibroblasts. Lipids 29, 825 – 829.
Carter WO, Narayanan PK & Robinson JP (1994) Intracellular hydrogen peroxide and superoxide anion detection in endothelial cells. J Leukoc Biol 55, 253 – 258.
Chik K, Flourie F, Arab K & Steghens JP (2005) A simple and fast kinetic LC/MS measurement of g glutamyl-cysteinyl ligase activity. J Chromatogr B, May 16. Available online. DOI: 10.1016/j.jchromb.2004.04.040.
Davidson LA, Nguyen DV, Hokanson RM et al. (2004) Chemopre-ventive n-3 polyunsaturated fatty acids reprogram genetic signatures during colon cancer initiation and progression in the rat. Cancer Res 64, 6797 – 6804.
Dickinson DA, Iles N, Watanabe KE, Iwamoto T, Zhang H, Krzywanski DM & Forman HJ (2002) 4-Hydroxynonenal induces glutamate cysteine ligase through JNK in HBE1 cells. Free Radic Biol Med 33, 974 – 987.
Germain E, Chajes V, Cognault S, Lhuillery C & Bougnoux P (1998) Enhancement of doxorubicin cytotoxicity by polyunsaturated fatty acids in the human breast tumor cell line MDA-MB-231: relationship to lipid peroxidation. Int J Cancer 75, 578 – 583. Habig WH, Pabst MJ & Jakoby WB (1974) Glutathione
S-transferases. The first enzymatic step in mercapturic acid formation. J Biol Chem 249, 7130 – 7139.
Kim H, Akbar M, Lau A & Esdall L (2000) Inhibition of neuronal apoptosis by docosahexaenoic acid (22:6n-3). J Biol Chem 275, 35215 – 35223.
Komatsu W, Ishihara K, Murata M, Saito H & Shinohara K (2003) Docosahexaenoic acid suppresses nitric oxide production and inducible nitric oxide synthase expression in interferon-gamma plus lipopolysaccharide-stimulated murine macrophages by
inhibiting the oxidative stress. Free Radic Biol Med 34, 1006 – 1016.
Kris-Etherton PM, Harris WS & Appel LJ (2002) Fish consumption, fish oil, omega-3 fatty acids, and cardiovascular disease. Circula-tion 106, 2747 – 2757.
Larsson SC, Kumlin M, Ingelman – Sundberg M & Wolk A (2004) Dietary long-chain n-3 fatty acids for the prevention of cancer: a review of potential mechanisms. Am J Clin Nutr 79, 935 – 945. Lee JM, Calkins MJ, Chan K, Kan YW & Johnson JA (2003a)
Identification of the NF-E2-related factor-2-dependent genes conferring protection against oxidative stress in primary cortical astrocytes using oligonucleotide microarray analysis. J Biol Chem 278, 12029 – 12038.
Lee HT, Xu H, Ota-Setlik A & Emala CW (2003b) Oxidant preconditioning protects human proximal tubular cells against lethal oxidant injury via p38 MAPK and heme oxygenase-1. Am J Nephrol 23, 324 – 333.
Levonen AL, Landar A, Ramachandran A, Ceaser EK, Dickinson DA, Zanoni G, Morrow JD & Darley-Usmar VM (2004) Cellular mechanisms of redox cell signalling: role of cysteine modification in controlling antioxidant defences in response to electrophilic lipid oxidation products. Biochem J 378, 373 – 382.
Liu W, Kato M, Akhand AA, Hayakawa A, Suzuki H, Miyata T, Kurokawa K, Hotta Y, Ishikawa N & Nakashima I (2000) 4-hydroxynonenal induces a cellular redox status-related activation of the caspase cascade for apoptotic cell death. J Cell Sci 113, 635 – 641.
LocusLink (2005) http://www.ncbi.nlm.nih.gov/entrez/query.fcgi?CMD =search&DB=gene.
Lopez-Garcia E, Schulze MZ, Manson JE, Meigs JB, Albert CM, Rifai N, Willet WC & Hu FB (2004) Consumption of (n-3) fatty acids is related to plasma biomarkers of inflammation and endo-thelial activation in women. J Nutr 134, 1806 – 1811.
Marcheselli LV, Hong S, Lukiw JW, et al. (2003) Novel docosanoids inhibit brain ischemia-reperfusion mediated leukocyte infiltration and pro-inflammatory gene expression. J Biol Chem 278, 43807 – 43817.
Martinez M, Vazquez E, Garcia-Silva MT, Manzanares J, Bertran JM, Castello F & Mougan I (2000) Therapeutic effects of docosahexae-noic acid ethyl ester in patients with generalized peroxisomal dis-orders. J Clin Nutr 71, Suppl., 376S – 385S.
Merendino N, Molinari R, Loppi B, Pessina G, D’Aquino M, Tomassi G & Velloti F (2003) Induction of apoptosis in human pancreatic cancer cell by docosahexaenoic acid. Ann N Y Acad Sci 1010, 361 – 364.
Primer3 software (2005) http://cbr-rbc.nrc-cnrc.gc.ca/cgi-bin/primer3 _www.cgi.
Rhodes LE, Shanbakhti H, Azurdia RM, et al. (2003) Effect of eicosapentanoic acid, an omega-3 polyunsaturated fatty acid, on UVR-related cancer risk in humans. An assessment of early geno-toxic markers. Carcinogenesis 24, 919 – 925.
Romero-Ramos M, Venero JL, Garcia-Rodriguez S, Ayala A, Machado A & Cano J (2003) Semichronic inhibition of glutathione reductase promotes oxidative damage to proteins and induces both transcription and translation of tyrosine hydroxylase in the nigros-triatal system. Free Radic Res 37, 1003 – 1012.
Rossi R, Milzani A, Dalle-Donne I, Giustarini D, Lusini L, Colombo R & Di Simplicio P (2002) Blood glutathione disulfide: in vivo factor or in vitro artifact?" Clin Chem 48, 742 – 753.
Rushmore TH, Morton MR & Pickett CB (1991) The antioxidant responsive element. Activation by oxidative stress and identifi-cation of the DNA consensus sequence required for functional activity. J Biol Chem 266, 11632 – 11639.
Shi MM, Kugelman A, Iwalmoto T, Tian L & Forman HJ (1994) Quinone-induced oxidative stress elevated glutathione and induces g-glutamylcysteine synthetase activity in rat lung epithelial L2 cells. J Biol Chem 269, 26512 – 26517.
. IP address:
118.70.52.165
, on
24 Jun 2021 at 08:34:37
, subject to the Cambridge Core terms of use, available at
https://www.cambridge.org/core/terms
.
Steghens JP, Flourie F, Arab K & Collombel C (2003) Fast liquid chromatography-mass spectrometry glutathione measurement in whole blood: micromolar GSSG is a sample preparation artifact. J Chromatogr B 25, 343 – 349.
Wasserman WW & Fahl WE (1997) Functional antioxidant respon-sive elements. Proc Natl Acad Sci 94, 5361 – 5366.
Wen B, Deutsch E, Opolon P, Auperin A, Frascogna V, Connault E & Bourhis (2003) n-3 polyunsaturated fatty acids decrease mucosal/ epidermal reactions and enhance antitumour effect of ionising radi-ation with inhibition of tumour angiogenesis. Br J Cancer 89, 1102 – 1107.
Wild AC, Moinova HR & Mulcahy T (1999) Regulation of g-glutamylcysteine synthetase subunit gene expression by the transcription factor Nrf2. J Biol Chem 274, 33627 – 33636. Worthington DJ & Rosemeyer MA (1974) Human glutathione
reductase: purification of the crystalline from erythrocytes. Eur J Biochem 48, 166 – 177.
Wu G, Fang YZ, Yang S, Lupton JR & Turner ND (2004) Glutathione metabolism and its implications for health. J Nutr 134, 489 – 492. Ziboh AV, Miller CC & Cho Y (2000) Metabolism of polyunsaturated fatty
acids by skin epidermal enzymes: generation of antiinflammatory and antiproliferative metabolites. Am J Clin Nutr 71, Suppl., 361S–366S.
. IP address:
118.70.52.165
, on
24 Jun 2021 at 08:34:37
, subject to the Cambridge Core terms of use, available at
https://www.cambridge.org/core/terms
.