HAL Id: insu-01298112
https://hal-insu.archives-ouvertes.fr/insu-01298112
Submitted on 5 Apr 2016
HAL is a multi-disciplinary open access
archive for the deposit and dissemination of
sci-entific research documents, whether they are
pub-lished or not. The documents may come from
teaching and research institutions in France or
abroad, or from public or private research centers.
L’archive ouverte pluridisciplinaire HAL, est
destinée au dépôt et à la diffusion de documents
scientifiques de niveau recherche, publiés ou non,
émanant des établissements d’enseignement et de
recherche français ou étrangers, des laboratoires
publics ou privés.
Soil characterization using patterns of magnetic
susceptibility versus effective radium concentration
F Girault, C Poitou, F Perrier, B. P. Koirala, M Bhattarai
To cite this version:
F Girault, C Poitou, F Perrier, B. P. Koirala, M Bhattarai. Soil characterization using patterns of
magnetic susceptibility versus effective radium concentration. Natural Hazards and Earth System
Sciences, European Geosciences Union, 2011, 11, pp.2285-2293. �10.5194/nhess-11-2285-2011�.
�insu-01298112�
www.nat-hazards-earth-syst-sci.net/11/2285/2011/ doi:10.5194/nhess-11-2285-2011
© Author(s) 2011. CC Attribution 3.0 License.
Natural Hazards
and Earth
System Sciences
Soil characterization using patterns of magnetic susceptibility
versus effective radium concentration
F. Girault1, C. Poitou2, F. Perrier1, B. P. Koirala3, and M. Bhattarai3
1Equipe de G´eomagn´etisme, Institut de Physique du Globe de Paris, UMR7154, CNRS-Universit´e Paris Diderot,´
Sorbonne Paris Cit´e, 1 rue Jussieu, 75238 Paris cedex 05, France
2Equipe de Pal´eomagn´etisme, Institut de Physique du Globe de Paris, UMR7154, CNRS, 1 rue Jussieu,´
75238 Paris cedex 05, France
3National Seismological Centre, Department of Mines and Geology, Lainchaur, Kathmandu, Nepal
Received: 24 March 2011 – Revised: 5 July 2011 – Accepted: 18 July 2011 – Published: 23 August 2011
Abstract. Low-field magnetic susceptibility χmand
effec-tive radium concentration ECRa, obtained from radon
emana-tion, have been measured in the laboratory with 129 soil sam-ples from Nepal. Samsam-ples along horizontal profiles in slope debris or terrace scarps showed rather homogeneous values of both χmand ECRa. One sample set, collected vertically
on a lateritic terrace scarp, had homogeneous values of ECRa
while χmincreased by a factor of 1 to 10 for residual soils
and topsoils. However, for a set of samples collected on three imbricated river terraces, values of ECRa, homogeneous over
a given terrace, displayed a gradual increase from younger to older terraces. By contrast, χmshowed more homogeneous
mean values over the three terraces, with a larger dispersion, however, for the younger one. Similarly, Kathmandu sedi-ments exhibited a large increase in ECRafrom sand to clay
layers, while χmincreased moderately. The combination of
χm and ECRa, thus, provides a novel tool to characterize
quantitatively various soil groups and may be of interest to distinguish modes of alteration or deposition histories.
1 Introduction
The soil plays an important role in the evolution of the sub-surface and the exchange of matter between the bedrock and the atmosphere and, as such, the understanding of its proper-ties is a prerequisite in numerous fundamental problems and environmental applications (e.g. Musy and Soutter, 1991). Reconstructing the past history of deposition and erosion of
Correspondence to: F. Girault
a given soil, for example, is useful for the reconstruction of past climates (e.g. Gu et al., 1997; Lagroix and Banerjee, 2002). To assess the history of a given soil or its ability to store, release or transmit pollutants, some knowledge of its physical and chemical properties is needed. Unfortunately, a soil is a complex multiphase time-dependent non-linear sys-tem, difficult to characterize and model (Musy and Soutter, 1991). While numerous empirical methods have been de-veloped since the nineteenth century, it is difficult in prac-tice to measure extensively all known soil parameters. Meth-ods that are both easy to implement, as well as efficient and unambiguous, might therefore be of great help, in particular in a context of the planet’s threatened soils (Banwart, 2011). Methodological aspects of environmental magnetism, introduced in Thompson and Oldfield (1986), can provide valuable information about the history, nature, main distri-bution pathways (Evans and Heller, 2003), transformations and occurrence of ferromagnetic minerals in soils. For exam-ple, low-field magnetic susceptibility (χm), one widely used
magnetic property of minerals, has been proposed as a pow-erful tool to characterize a soil layer, both in the laboratory and in the field, in the context of atmospheric pollution in the vicinity of roads or industrial zones (e.g. D’Emilio et al., 2010). Indeed, magnetic susceptibility, essentially controlled by the concentration of magnetite, maghemite or greigite in natural conditions, is also increased in the presence of heavy metals such as iron, lead or mercury (e.g. Hanesch and Scholger, 2002; Karimi et al., 2011). The spatial varia-tion of χmmay also provide some important information on
the soil chemical evolution. For example, topsoils in tem-perate, Mediterranean, subtropical and tropical zones show higher values than subsoils (Le Borgne, 1955), an effect
2286 F. Girault et al.: Patterns of magnetic susceptibility versus effective radium concentration referred to as magnetic enhancement of topsoils and
origi-nally considered to be due to bioreduction of iron in anaero-bic conditions (Le Borgne, 1955; Mullins, 1977). Extensive data sets obtained recently, however, rather suggest a largely abiotic system where secondary ferrimagnetic mineral for-mation is essentially controlled by the weathering capacity to supply iron to the surface soils (Blundell et al., 2009). This data set also shows higher magnetic concentrations over specific parent material such as schists, slates, mudstones and limestones. This does not imply, though, that χm can
be easily used to characterize soil deposition and chemical evolution versus slope dynamics. Indeed, inconsistent val-ues of magnetic enhancement suggest that the relationship between χm, parent material and transport is in general
dif-ficult to decipher (e.g. de Jong et al., 1998; Dearing et al., 1996). However, the spatial variation of χm, both laterally
and with depth, remains impressive and the complex patterns of χm, whose measurement is simple, fast and cheap,
non-destructive and possible both in the laboratory and in the field, could allow reliable interpretations if it can be com-bined with another physical parameter.
Effective radium concentration (ECRa)refers to the radon
gas source term (Stoulos et al., 2004), namely radium con-centration CRamultiplied by the emanation factor E, which
is the probability that radon, a decay product of radium, is produced in the pore space and can escape from the bedrock or soil to the atmosphere. This parameter ECRa can be
easily measured in the laboratory and, while spatial varia-tions of radon concentration in the soil were observed long ago, the interpretation was not considered straightforward and systematic (Botset and Weaver, 1932). Nevertheless, ECRashows definite and reproducible spatial variations, with
values varying over more than two orders of magnitude in regular conditions (Girault et al., 2011) and more in soils in uranium mining zones or affected by wastes of uranium in-dustry (Sahoo et al., 2010). Radium is a member of the ura-nium decay chain, and, like other radionuclides which are not in radioactive equilibrium in a given sample, it can reveal the weathering history of a soil (Gu et al., 1997). Furthermore, it can be an interesting proxy to characterize the soil history and its ability to store and release pollutants. Indeed, while radium shows a preferential sorption onto ferric oxyhydrox-ides (Ames et al., 1983; Flexser et al., 1993) and thus might be well correlated with χm, it also shows an even stronger
affinity for organic matter in clays (Greeman et al., 1999). The parameter ECRa is complicated by the presence of the
emanation factor, which depends mainly on grain size dis-tribution, temperature or humidity (Markkanen and Arvela, 1992; Adler and Perrier, 2009; Breitner et al., 2010), but this dependence itself might be a powerful index to distinguish various soil types.
In this paper, we explore the potential of combining χm
with ECRa to distinguish various soils which might not be
sufficiently well characterized by one of these parameters only. For this purpose, we use various coherent sets of
soil samples coming from sites located in the Himalayas of Nepal, which have been little affected by industrial activities.
2 Methods
The magnetic susceptibility κ is defined as the ratio of the induced magnetization M by the inducing magnetic field H (Evans and Heller, 2003):
κ =M
H. (1)
Both M and H are measured in A m−1, therefore κ is dimen-sionless. The low-field specific magnetic susceptibility χm,
expressed in m3kg−1, is defined as the ratio of κ by the
den-sity of the sample. As an induced magnetization parameter, low-field magnetic susceptibility is a response of the contri-bution from all minerals present in the bulk sample, whether they are dia-, para-, or ferromagnetic. Low-field magnetic susceptibility was measured at room temperature in the lab-oratory with a Kappabridge KLY2™ (AGICO Inc., Brno, Czech Republic) operating at a frequency of 920 Hz with a magnetic field intensity of 300 A m−1. The sensitivity of this apparatus is about 4 × 10⁻⁸SI. A mass of about 5–15 g of bulk soil sample, crushed into powder to prevent anisotropic effect and without any other particular treatment, was packed into 8 cm3plastic cubes. Measurements were repeated two to three times and, for half of the samples, two aliquots of the same sample were measured. Obtained uncertainties range from 1 % to 19 %.
Effective radium-226 concentration ECRa was measured
by radon accumulation experiments in air-tight containers (Stoulos et al., 2003; Girault et al., 2011). A mass m of about 100–200 g of soil, without any treatment, was inserted in glass bottles, with volumes varying from 260 ml to 400 ml and closed by pre-perforated natural rubber stoppers. The air tightness was systematically checked by depressurization. Radon-222 concentration CRn was measured after an
accu-mulation time t varying from 3 to 20 days. The value of ECRa, expressed in Bq kg−1, was then obtained using:
ECRa=
Va
m CRn
1 − e−λt, (2)
where Vais the total free air volume in the container, m the
mass of the sample (kg), and λ the radon decay constant (2.1 × 10⁻⁶s−1). In our case, radon concentration was
mea-sured by sampling the gas into a previously evacuated scin-tillation flask, measured after 3.5 h in a CALEN™ photo-multiplier (Algade, France). The radon concentration was then obtained from the counting rate. The final value of ECRawas obtained by averaging three to four accumulation
experiments performed with different accumulation times. The experimental uncertainty, dominated by the statistical uncertainty on the counting rate and a sampling dilution cor-rection, varies from ±10 % for ECRavalues of 1 Bq kg−1to
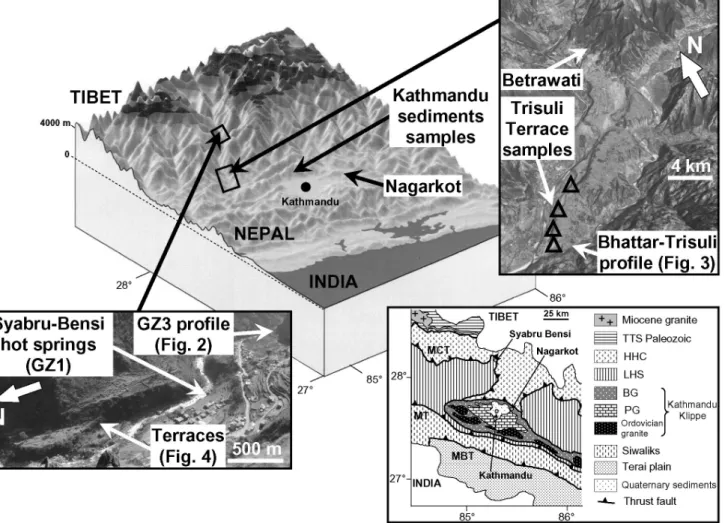
Fig. 1. Location of the sampling sites: the GZ3 profile, the main hot spring site (GZ1) and the three imbricated river terraces in
Syabru-Bensi (in the left picture), the Bhattar-Trisuli profile, the Trisuli Terrace samples (triangles) and Betrawati location (in the right satellite image), the Nagarkot site and the Kathmandu Valley sampling site (in the bloc transect). In the inset, a simplified geological map of Central Nepal (after Upreti, 1999) is shown (TTS: Tethys Tibetan Sediments; HHC: High Himalayan Complex; LHS: Lesser Himalayan Sequences; BG: Bhimphedi Group; PG: Phulchauki Group; MCT: Main Central Thrust; MT: Mahabharat Thrust; MBT: Main Boundary Thrust). The block transect of Central Nepal is a courtesy of Laurent Bollinger; the Trisuli Terrace picture is a GoogleEarth™ satellite image taken on 10 January 2010.
within ±3 % for ECRavalues larger than 10 Bq kg−1. For our
soil samples, obtained uncertainties range from within ±1 % to within ±13 %. When comparing with data sets obtained independently, an additional absolute systematic uncertainty of ±5 %, common to all our measurements, is to be com-bined, so that the total uncertainty squared is the sum of the punctual and absolute uncertainties squared.
3 Sample sets
The first set of 34 soil samples was obtained about 500 m south of the Syabru-Bensi main hot springs in Central Nepal (Fig. 1; Perrier et al., 2009), along a transect (GZ3 profile in Fig. 1) where high fluxes of carbon dioxide and radon had been measured (Girault et al., 2009). This transect (Figs. 1
and 2) was located at an altitude of 1410 m a.s.l. at the bot-tom of a debris slope in schists of low metamorphic grade of Lesser Himalayan Sequences (see inset in Fig. 1). One sam-ple was taken every meter during the dry winter season. The samples appeared rich in sand and muscovite. For compari-son, 9 black soils rich in organic matter were also collected near the Syabru-Bensi main hot springs (GZ1, Fig. 1). These samples were also rich in sulphur and sulphates due to the release of hydrogen sulphide associated with carbon dioxide. In each of these two locations, GZ1 and GZ3, one soil was also sampled away from the degassing sites, typically at 30 m and 40 m, respectively.
To study possible magnetic enhancement effects, partic-ular attention was given to red soils, rich in ferric oxides, around Trisuli Bazar, north-west of Kathmandu (Girault et
2288 F. Girault et al.: Patterns of magnetic susceptibility versus effective radium concentration GZ3 Profile 0m 33m Syabru-Bensi Trisuli River South GZ1-2 North South North Figure 2
Fig. 2. Transect of χmand ECRaalong the gas discharge zone GZ3 south of the main Syabru-Bensi geothermal system, Nepal (Girault et
al., 2009). A view of the sampling zone is shown in the inset.
al., 2011). South of the Battar-Trisuli lateritic terrace, located at a mean altitude of 600 m a.s.l., one scarp was sampled ver-tically (Bhattar-Trisuli Profile in Fig. 1), with two parallel profiles, separated by 50 cm, of 6 samples from C-horizon, B-horizon to red topsoils (Fig. 3). Four other red residual soils were sampled at other locations of the same terrace (Trisuli Terrace samples in Fig. 1), as well as other locations north of Trisuli Bazar (one sample in Betrawati, in Fig. 1) and north-east of Kathmandu (10 samples in Nagarkot, in Fig. 1). Additional soil samples were collected in Syabru-Bensi, away from any gas discharge zones, free of red soils or sul-phur deposits, on three different imbricated river terraces T1, T2, T3 at altitudes of 1457 m, 1425 m, and 1413 m a.s.l., re-spectively (Figs. 1 and 4). Four samples, separated by about 25 m for T1, 2 m for T2 and 3 m for T3, were taken from each terrace. Soils from terrace T1 were dark, rich in organic matter. The soils from terrace T2 were grey and rich in mus-covite, rather similar to GZ3 although in the context of race deposits instead of slope debris. The soils from ter-race T3 were more sandy soils. T1 was the oldest terter-race, while the T3 terrace was the youngest. These terraces are not dated precisely but, in the Sub-Himalaya, river incision is particularly rapid, with typical incision rates reaching 10– 15 mm yr−1(Lav´e and Avouac, 2001). Using such rates, the T1, T2 and T3 terraces may be dated at 3.8–5.7 ka, 1.7–2.5 ka and 0.9–1.3 ka, respectively.
Finally, 48 soil samples were taken from four similar scarps in the north-western part of the Kathmandu Valley (Fig. 1). These four scarps from the Gokarna Terrace
(e.g. Sakai et al., 2008) are characterized by coarse to fine sand and orange, brown and black clays, and were separated from 30 cm to 2.5 km (Girault et al., 2011). Twelve samples were collected on each vertical profile, and each sample had its counterpart in the same layer in the three other profiles.
4 Results
The results for different sampling sites are shown in Figs. 2 to 4. An overview of χmversus ECRafor all sites is shown
in Fig. 5.
Both χm and ECRa were rather homogeneous along
the GZ3 profile (Fig. 2), with average values of (36.7 ± 6.9) × 10−8m3kg−1 and 7.9 ± 0.4 Bq kg−1 for χm
and ECRa, respectively. Both these values and their
standard deviations, 40.4 × 10⁻⁸m3kg−1 and 2.4 Bq kg−1, respectively, are typically observed values in soils from Nepal (Gautam et al., 2009; Girault et al., 2011) and this set, thus, can be considered as a standard baseline. While smooth spatial variations were observed in both variables along the profile, no clear pattern emerged in the χmversus ECRa
cor-relation plot (Fig. 5).
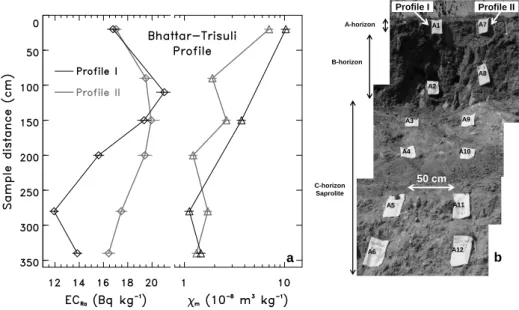
The two vertical profiles at the Bhattar-Trisuli scarp (Fig. 3) provided a different situation. While conspic-uous vertical variations were observed, both in χm and
ECRa, the two vertical profiles were similar, thus
indicat-ing that lateral variations were negligible compared with vertical variations. A clear magnetic enhancement effect was observed, with χm increasing from low values from
50 cm A1 A2 A3 A4 A5 A6 A7 A8 A9 A10 A11 A12 Profile I Profile II A-horizon B-horizon C-horizon Saprolite b a Figure 3
Fig. 3. (a) Vertical profiles of χmand ECRaalong a scarp of the Bhattar-Trisuli terrace, Nepal (Girault et al., 2011). A view of the scarp is
shown in (b). Langtang River Trisuli River Terrace T1 1457 m Terrace T2 1425 m Terrace T3 1413 m North South Syabru-Bensi Older terrace Younger terrace Figure 4
Fig. 4. Results of χmand ECRaon three imbricated river terraces, Syabru-Bensi, Nepal. A view of the terraces on the left bank of the Trisuli
River in Syabru-Bensi is shown above the graphs.
1 × 10⁻⁸ to 2 × 10⁻⁸m3kg−1 for the C-horizon, to from 3 × 10⁻⁸ to 4 ×10⁻⁸m3kg−1 for the B-horizon and from 7 × 10⁻⁸to 10 × 10−8m3kg−1for the topsoil. Note, how-ever, that the increase of χmby about a factor of 10 is
sim-ilar to the range of variation in Fig. 2. While the average value 17.4 ± 0.7 Bq kg−1of ECRain this set was rather high
(Girault et al., 2011), a small but significant spatial variation can be seen in Fig. 3a, with a local maximum at the interface between the B-horizon and the C-horizon at about 100 cm depth. In Fig. 5, this data set is characterized by a vertical inverted C shape with no overlap with the domain of the data points of the GZ3 profile.
2290 F. Girault et al.: Patterns of magnetic susceptibility versus effective radium concentration
Figure 5
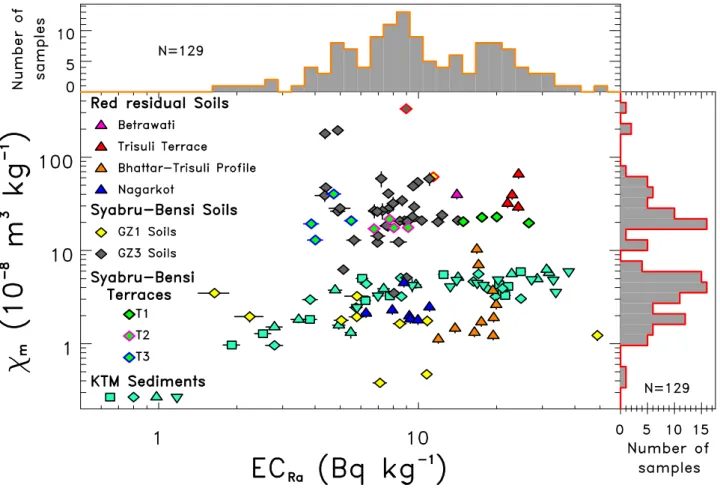
Fig. 5. Summary of the results of χm versus ECRa. Soils from the Syabru-Bensi geothermal system are shown as diamonds, with a
different border colour for the three imbricated river terraces T1-3. Red soils from various locations north-west and north-east of Kathmandu, Nepal, are shown as triangles. The four symbols for Kathmandu (KTM) sediments correspond to the four sampling locations of the same stratigraphical levels. Black and grey diamonds with red borders correspond to soils sampled 30 m and 40 m away from GZ1 and GZ3, respectively.
The results of the soil samples from the imbricated ter-races T1, T2 and T3 are presented in Fig. 4. The obtained values of χm varied between (12.9 ± 1.3) × 10−8m3kg−1
and (40.3 ± 4.0) × 10−8m3kg−1, thus, significantly larger
than the topsoil values observed in the vertical profiles from other locations in Nepal (Fig. 3), but similar to the values obtained for the nearby GZ3 profile (Fig. 2). One inter-esting feature in Fig. 4, although statistics remain low (4 samples for each terrace), is that the values of χm for T1
and T2 did not overlap significantly, while the values for T3 overlapped both the domains of values for T1 and T2. By contrast, the values of ECRa showed a large range of
variations from 3.9 ± 0.3 Bq kg−1to 26.6 ± 0.7 Bq kg−1, not insignificant compared with the range of variations (0.4 to 43 Bq kg−1) observed over smaller spatial scales in Kath-mandu Valley (Girault et al., 2011). In addition, each ter-race was characterized by non-overlapping values of ECRa,
with average values of 20 ± 3 Bq kg−1, 7.9 ± 0.5 Bq kg−1,
and 4.5 ± 0.4 Bq kg−1, respectively, for T1, T2 and T3. Thus,
ECRaappeared to increase regularly from the younger to the
older terrace. In the correlation plot (Fig. 5), this data set appears as a horizontal set of points, non-overlapping with the data set of Bhattar-Trisuli profiles but with the data set of GZ3.
The three data sets described so far (Figs. 2 to 4), thus, were scattered in different domains of χm versus ECRa in Fig. 5. This remains true when further data
are now considered. Soil samples collected at the main geothermal system of Syabru-Bensi (GZ1), were charac-terized by a large range of ECRa, from 1.6 ± 0.2 Bq kg−1
to 49 ± 0.4 Bq kg−1, associated with significantly low values of χm, from (0.38 ± 0.02) × 10−8m3kg−1 to
(3.5 ± 0.2) × 10−8m3kg−1. Thus, this data set does not agree with the GZ3 data. By contrast, the reference soil sam-ple in GZ1 (bordered in red in Fig. 5), taken 30 m away from the gas discharge, falls in the cluster of GZ3 data.
Other red soils, superficially similar to the top-soils of the Bhattar-Trisuli profiles, showed contrasting behaviours. The four red soils of the Trisuli Terrace, above the site of the Bhattar-Trisuli profiles (Fig. 1),
are characterized by roughly similar values of ECRa,
with an average of 23.4 ± 0.5 Bq kg−1 and much higher
values of χm, varying from (29.1 ± 2.9) × 10−8m3kg−1 to
(65.6 ± 6.6) × 10−8m3kg−1 (Fig. 5). The red soil from Betrawati (Fig. 1) showed a slightly smaller value of χm
of (39.6 ± 4.0) × 10−8m3kg−1, but a significantly smaller value of ECRa(14.1 ± 0.4 Bq kg−1). The 6 red soil samples
from the Nagarkot area (Fig. 1), by contrast, showed smaller values of both χm and ECRa, thus falling in the domain of
the GZ1 data set (Fig. 5). Thus, the various sets of red soils are distinguished easily when looking at χmversus ECRa.
Furthermore, the four sets of sediment pro-files collected in the Kathmandu Valley (Fig. 1) were characterized by a moderate range of varia-tion of χm, from (0.96 ± 0.05) × 10−8m3kg−1 to
(6.2 ± 0.1) × 10−8m3kg−1, but by a larger range of
varia-tion of ECRa, from 1.9 ± 0.1 Bq kg−1to 37.9 ± 0.8 Bq kg−1
(Fig. 5). This behaviour is consistent among the four profiles, although they are separated by up to 2.5 km. These samples also showed a slight trend from sand layers characterized by low ECRa and χm values to brown clay
layers characterized by higher ECRaand χmvalues (Fig. 5).
Those results intersect the domains of GZ1 samples and red residual soils from Nagarkot and Bhattar-Trisuli profile.
The distribution of all χm values shows two
clus-ters: one around 25 × 10−8m3kg−1with samples from the Trisuli Terrace and upper Trisuli valley, and one around 3 × 10⁻⁸m3kg−1with all samples south of Trisuli Terrace,
with the exception of the GZ1 samples. These two clusters might be due to different geological input, suggesting some sensitivity of χmto the parent material.
5 Discussion and conclusion
In this study, we have obtained values of χmand ECRafrom
129 soil samples. Significant and consistent behaviours have emerged, with variations much larger than the experimen-tal uncertainties. This suggests that the potential of these two physical parameters, which are easy and cost-effective to measure without any disruption of the sample, deserve further exploration for soil physics. Indeed, while some soil samples sets are difficult to distinguish on the basis of one of these parameters only, definite discrimination may be pos-sible when their combination is considered. In particular, magnetic enhancement, which we would now define as a χmincrease occurring at roughly constant ECRa, can be
dis-tinguished from parent material heterogeneity or pollutant effects associated with widely different values of both χm
and ECRa. By contrast, an increase of ECRaat constant χm
would indicate, for example, an enrichment in organic matter at a constant average mineralogy, possibly associated with a change in deposition age.
The argument is not only qualitative, but quantitative. First, the two properties ECRaand χm are generally poorly
correlated, in particular for GZ1 and GZ3 soil samples, for which the correlation coefficients are 0.44 ± 0.02 and 0.58 ± 0.03, respectively. Thus, combining both parame-ters leads to an increase of information compared with their separate measurements. In addition, relevant interest in the measurement of both these parameters lies in their respective different behaviour, which can also be demonstrated by us-ing, for some data sets, the coefficient of variation (expressed in per cent). For example, the Trisuli Terrace red residual soil samples (Fig. 5) show a low ratio of 4.6 % for ECRa
and a larger value of 40 % for χm. Conversely, for other
data sets such as the Syabru-Bensi Terraces soil samples (Fig. 5), we obtain a larger ratio for ECRa(68 %) than for
χm (32 %). Therefore, ECRa and χm definitely appear to
be non-redundant physical properties of soils. Finally, the relative patterns of ECRa and χm can be used to
discrimi-nate soil groups. For example, considering GZ3 soils on one hand, and Trisuli Terrace samples and Bhattar-Trisuli pro-file soils together on the other hand, in Fig. 5, separation between the two groups is difficult on the basis of ECRaor
χmonly. When, however, a separation line is drawn in χm
versus ECRaparameter space, the two sample sets are now
clearly isolated, with relative contamination of the order of ≤1 % at the 90 % confidence level, a conclusion that can now be subjected to further independent statistical tests.
Consistent behaviours were observed with samples sepa-rated by large distances, which suggests that the pattern is controlled by stratigraphical position and regional evolution rather than site specific contamination or infiltration effects. More systematic campaigns are necessary to establish such behaviours and associated trajectories in the χmversus ECRa
parameter space. To observe such behaviours, it is impor-tant to study coherent soil samples with erosion or deposition conditions varying while the overall context is sufficiently constant. Consequently, our initial observations would ben-efit from more complete investigations and dedicated exper-iments, in order to obtain for example the nature of mag-netic phases and the Fe-oxides characteristics (Jordanova et al., 2010).
While tentative at this stage, physical explanations for the observed behaviours can be proposed. Although increase of χm in topsoils could be dominated by short time-scale
alteration and oxide minerals content, ECRaheterogeneities
would indicate, first of all, the heterogeneity of residual clay from parent material and cumulated leaching. Also, the increase of ECRawith soil age, for other conditions roughly
constant, might be accounted for by the increasing amount of organic matter, which is a particularly interesting factor for radium removal from groundwater. To develop a better understanding of χmversus ECRapatterns, controlled
exper-iments in the laboratory can be of great interest, in particu-lar to investigate how these patterns can be modified by the presence of contaminants.
2292 F. Girault et al.: Patterns of magnetic susceptibility versus effective radium concentration
Supplementary material related to this article is available online at:
http://www.nat-hazards-earth-syst-sci.net/11/2285/2011/ nhess-11-2285-2011-supplement.pdf.
Acknowledgements. The authors thank Soma Nath Sapkota
(Department of Mines and Geology, Kathmandu, Nepal) and Gauthier Hulot (Institut de Physique du Globe de Paris, France) for continuous support over the years. H´el`ene Bouquerel is thanked for technical assistance and France Lagroix for her valuable comments about magnetic susceptibility in soils. The original manuscript has been improved thanks to two anonymous reviewers. This paper is IPGP contribution number 3209.
Edited by: R. Crockett
Reviewed by: J.-C. Sabroux and another anonymous referee
The publication of this article is financed by CNRS-INSU.
References
Adler, P. M. and Perrier, F.: Radon emanation in partially saturated porous media, Transport in Porous Media, 78(2), 149–159, 2009. Ames, L. L., McGarrah, J. E., Walker, B. A., and Salter, P. F.: Ura-nium and radium sorption on amorphous ferric oxyhydroxide, Chem. Geol., 40, 135–148, 1983.
Banwart, S.: Save our soils, Nature, 474, 151–152, 2011.
Blundell, A., Dearing, J. A., Boyle, J. F., and Hannam, J. A.: Con-trolling factors for the spatial variability of soil magnetic suscep-tibility across England and Wales, Earth-Sci. Rev., 95, 158–188, 2009.
Botset, H. G. and Weaver, P.: Radon content of soil gas, Physics, 2, 376–385, 1932.
Breitner, D., Arvela, H., Hellmuth, K.-H., and Renvall, T.: Effect of moisture content on emanation at different grain size fractions – A pilot study on granitic esker sand sample, J. Environ. Radioac-tiv., 101, 1002–1006, 2010.
de Jong, E., Nestor, P. A., and Pennock, D. J.: The use of magnetic susceptibility to measure long-term soil redistribution, Catena, 32, 23–36, 1998.
D’Emilio, M., Caggiano, R., Coppola, R., Macchiato, M., and Ragosta, M.: Magnetic susceptibility measurements as proxy method to monitor soil pollution: the case study of S. Nicola di Melfi, Environ. Monit. Assess., 169, 619–630, 2010. Dearing, J. A., Hay, K. L., Baban, S. M. J., Huddleston, A. S.,
Wellington, E. M. H., and Loveland, P. J.: Magnetic susceptibil-ity of soil: an evaluation of conflicting theories using a national data set, Geophys. J. Int., 127, 728–734, 1996.
Evans, M. and Heller, F.: Environmental magnetism. Principles and applications of enviromagnetics, Academic Press, Elsevier Sci-ence (USA), 2003.
Flexser, S., Wollenberg, H. A., and Smith, A. R.: Distribution of radon sources and effects on radon emanation in granitic soil at Ben Lomond, California, Environ. Geol., 22, 162–177, 1993. Gautam, P., Sakai, T., Paudayal, K. N., Bhandari, S., Gyawali, B.
R., Gautam, C. M., and Rijal, M. L.: Magnetism and granulom-etry of Pleistocene sediments of Dhapasi section, Kathmandu (Nepal): implications for depositional age and paleoenviron-ment, Bulletin of the Department of Geology, Tribhuvan Uni-versity, Kathmandu, Nepal, 12, 17–28, 2009.
Girault, F., Koirala, B. P., Perrier, F., Richon, P., and Rajaure, S.: Persistence of radon-222 flux during monsoon at a geothermal zone in Nepal, J. Environ. Radioactiv., 100, 955–964, 2009. Girault, F., Gajurel, A. P., Perrier, F., Upreti, B. N., and Richon, P.:
Radon emanation of heterogeneous basin deposits in Kathmandu Valley, Nepal, J. Asian Earth Sci., 40, 595–610, 2011.
Greeman, D. J., Rose, A. W., Washington, J. W., Dobos, R. R., and Ciolkosz, E. J.: Geochemistry of radium in soils of the Eastern United States, Appl. Geochem., 14, 365–385, 1999.
Gu, Z. Y., Lal, D., Liu, T. S., Guo, Z. T., Southon, J., and Caffee, M. W. M.: Weathering histories of Chinese loess deposits based on uranium and thorium series radionuclides and cosmogenic10Be, Geochim. Cosmochim. Ac., 61, 5221–5231, 1997.
Hanesch, M. and Scholger, R.: Mapping of heavy metal loadings in soils by means of magnetic susceptibility measurements, Env-iron. Geol., 42, 857–870, 2002.
Jordanova, D., Jordanova, N., Petrov, P., and Tsacheva, Ts.: Soil development of three Chernozem-like profiles from North Bul-garia revealed by magnetic studies, Catena, 83, 158–169, 2010. Karimi, R., Ayoubi, S., Jalalian, A., Sheikh-Hosseini, A. R., and
Afyuni, M.: Relationship between magnetic susceptibility and heavy metals in urban topsoils in the arid region of Isfahan, cen-tral Iran, J. Appl. Geophys., 74, 1–7, 2011.
Lagroix, F. and Banerjee, S. K.: Paleowind directions from the mag-netic fabric of loess profiles in central Alaska, Earth Planet. Sci. Lett., 195, 99–112, 2002.
Lav´e, J. and Avouac, J. P.: Fluvial incision and tectonic uplift across the Himalayas of central Nepal, J. Geophys. Res., 106(B11), 26561–26591, 2001.
Le Borgne, E.: Susceptibilit´e magn´etique anormale du sol superfi-ciel, Ann. G´eophys., 11, 399–419, 1955.
Markkanen, M. and Arvela, H.: Radon emanation from soils, Ra-diat. Prot. Dosim., 45(1/4), 269–272, 1992.
Mullins, C. E.: Magnetic susceptibility of the soil and its signifi-cance in soil science – a review, J. Soil Sci., 28, 223–246, 1977. Musy, A., and Soutter, M.: Physique du sol (Presses polytechniques
et universitaires romandes, Lausanne), 1991 (in French). Perrier, F., Richon, P., Byrdina, S., France-Lanord, C., Rajaure, S.,
Koirala, B. P., Shrestha, P. L., Gautam, U. P., Tiwari, D. R., Revil, A., Bollinger, L., Contraires, S., Bureau, S., and Sapkota, S. N.: A direct evidence for high carbon dioxide and radon-222 dis-charge in Central Nepal, Earth Planet. Sci. Lett., 278, 198–207, 2009.
Sahoo, B. K., Mayya, Y. S., Sapra, B. K., Gaware, J. J., Banerjee, K. S., and Kushwaha, H. S.: Radon exhalation studies in an Indian uranium tailings pile, Radiat. Meas., 45, 237–241, 2010. Sakai, T., Gajurel, A. P., Tabata, H., Ooi, N., Takagawa, T.,
Kitagawa, H. and Upreti, B. N.: Revised lithostratigraphy of fluvio-lacustrine sediments comprising northern Kathmandu basin in central Nepal, J. Nepal Geol. Soc., 37, 25–44, 2008. Stoulos, S., Manolopoulou, M., and Papastefanou, C.: Assessment
of natural radiation exposure and radon exhalation from building materials in Greece, J. Environ. Radioactiv., 69, 225–240, 2003.
Stoulos, S., Manolopoulou, M., and Papastefanou, C.: Measure-ment of radon emanation factor from granular samples: effects of additives in cement, Appl. Radiat. Isotopes, 60, 49–54, 2004. Thompson, R. and Oldfield, F.: Environmental magnetism, Allen &
Unwin, London, 1986.
Upreti, B. N.: An overview of the stratigraphy and tectonics of the Nepal Himalaya, J. Asian Earth Sci., 17, 577–606, 1999.