HAL Id: hal-00296899
https://hal.archives-ouvertes.fr/hal-00296899
Submitted on 8 Mar 2006
HAL is a multi-disciplinary open access
archive for the deposit and dissemination of
sci-entific research documents, whether they are
pub-lished or not. The documents may come from
teaching and research institutions in France or
abroad, or from public or private research centers.
L’archive ouverte pluridisciplinaire HAL, est
destinée au dépôt et à la diffusion de documents
scientifiques de niveau recherche, publiés ou non,
émanant des établissements d’enseignement et de
recherche français ou étrangers, des laboratoires
publics ou privés.
Study of 11 September 2004 hailstorm event using radar
identification of 2-D systems and 3-D cells
M. Ceperuelo, M. C. Llasat, L. López, E. García-Ortega, J. L. Sánchez
To cite this version:
M. Ceperuelo, M. C. Llasat, L. López, E. García-Ortega, J. L. Sánchez. Study of 11 September 2004
hailstorm event using radar identification of 2-D systems and 3-D cells. Advances in Geosciences,
European Geosciences Union, 2006, 7, pp.215-222. �hal-00296899�
Advances in Geosciences, 7, 215–222, 2006 SRef-ID: 1680-7359/adgeo/2006-7-215 European Geosciences Union
© 2006 Author(s). This work is licensed under a Creative Commons License.
Advances in
Geosciences
Study of 11 September 2004 hailstorm event using radar
identification of 2-D systems and 3-D cells
M. Ceperuelo1, M. C. Llasat1, L. L´opez2, E. Garc´ıa-Ortega2, and J. L. S´anchez2
1Department of Astronomy & Meteorology, Faculty of Physics, University of Barcelona, Spain 2Laboratory for Atmofpheric Physics, University of Le´on, Spain
Received: 7 October 2005 – Revised: 9 February 2006 – Accepted: 13 February 2006 – Published: 8 March 2006
Abstract. The most important hail event recorded in the
region of the Ebro Valley (NE Spain) in 2004 was the 11 September episode. Large hailstones (some of them with a diameter of over 30 mm) caused important damages in agri-culture and properties. The hail event affected an area of 3848 ha and was caused by several multicellular systems. The aim of this paper is the analysis of the associated con-vective structures using the meteorological radar as well as the MM5 mesoscale model, thermodynamic data and a hail-pad network. To achieve this end, the new hailstorm anal-ysis tool RHAP (Rainfall events and Hailstorms Analanal-ysis Program) has been applied. It identifies tracks and charac-terises precipitation systems and convective cells, taking into account 2-D and 3-D structures. The event has also been studied with the TITAN software (Thunderstorm Identifica-tion, Tracking, Analysis and Nowcasting) in an attempt to compare both methods. Results show that the episode had a strong convective activity with CAPE values over 4000 J/kg and with hail-forming cells characterised by VIL (Vertical Integrated Liguid) exceeding 40 kg/m2, VILD (VIL density) over 4 g/m3, HP (Hail Probability) of 100% and SHP (Se-vere Hail Probability) of over 75%. The hail cells evolved into multicellular systems that lasted between 70 and 90 min. Finally, the comparison of RHAP and TITAN has shown sig-nificant correlations between methods.
1 Introduction
The most important hail event in 2004 in the Ebro Valley (area of about 40 000 km2), North-East of Spain (Fig. 1), oc-curred on 11th September 2004. The event affected a re-gion of over 2500 km2, 15% of which is covered by a hailpad network belonging to the ADV, “Associaci´o de Defensa dels Vegetals” (Association for the Protection of Plants) in Lleida (Fig. 1). This network is formed by 170 hailpads and its
den-Correspondence to: M. Ceperuelo
(ceperuel@am.ub.es)
sity is close to 1 hailpad per 16 km2 and provides, among other data, values of maximum hail size, ice mass, kinetic energy and number of impacts per m2(Schleusener and Jen-ings, 1960; L´opez, 2003). A total of 19 hailpads were hit by hailstones during this event, damaging 3,848 ha of crops in-cluding apples of the Golden Delicious type, pears, peaches and nectarines. The largest hailstones were registered in the towns of Fraga and Alcarr´as (Fig. 1), with a maximum hail size of 34.6 mm.
Summer storms are very frequent in the study zone, where an average number of 32 thunderstorm days per year have been registered in the south-western part, area of about 25 000 km2, (Font, 1983). Previous studies (Pascual, 2000; L´opez, 2003) have shown that the medium size of hailstones in this area is usually under 20 mm and this size is usually registered around 16:00 UTC, after the maximum irradiance value. From a mesoscale point of view, hailstorm events are associated with atmospheric instability, strong updrafts and highly organised convective systems (Ragette, 1973; Brown-ing, 1977; Knight and Knight, 2001; Mart´ın et al., 2001). L´opez (2003) found that in this area an average CAPE (Con-vective Available Potential Energy) value of 1020 J/Kg is re-quired to cause convective activity related with hail, while the Total of Totals index has an average value of 47.3. Various studies have been carried out in order to classify associated convective systems using the meteorological radar and tak-ing into account 2-D and 3-D features (Fraile at al., 2001; S´anchez at al., 2003; Rigo, 2004; Rigo and Llasat, 2004).
These thermodynamic features together with the evolution of convective systems (2-D and 3-D) associated to the 11 September 2004 event are explored in this paper. To achieve this end, different meteorological data and hailpad data have been integrated using software developed by the University of Barcelona: RHAP (Rainfall events and Hailstorms Anal-ysis Program). More detailed information about this soft-ware can be found elsewhere in this issue (Ceperuelo et al., 2005). The present paper starts with the description of the data base and the methodology employed. Then, the synop-tic scale and mesoscale circulation obtained with the MM5
216 M. Ceperuelo et al.: Study of 11 September 2004 hailstorm event
Figure 1. Study area and locations.
19
Fig. 1. Study area and locations.
Table 1. University of Leon radar and INM radar features.
Feature INM radar ULE radar Beamwidth 0.9◦ 1.65◦max Frequency 5600–5650 MHz 5485–5600 MHz Pick power 250 kW 250 kW Pulse width 2 µs 2 µs PRF 250 Hz 250 Hz
meteorological model and the upper-air soundings are ex-plained. The next section includes the radar characterisation and the tracking of 3-D cells and precipitation systems that produce hailstones. The results in the analysis of hail cells obtained using RHAP and using TITAN are then compared. Finally, conclusions are presented.
2 Database and methodology
To study the 11th September 2004 hail event, a wide range of data have been used: radar data, upper-air sounding data, hailpad data and MM5 model outputs. First of all, ground observations provided by the ADV hailpad network and me-teorological observers were obtained. These data have been analysed and verified using radar data. Thermodynamic data were obtained from the 12:00 UTC Lleida radiosounding.
The meteorological radars used (Fig. 1) were the Zaragoza radar from the Spanish National Institute for Meteorology (Instituto Nacional de Meteorolog´ıa, INM) and the Zaragoza radar from the University of Le´on (ULE), Spain. The main radar features are shown in Table 1, and the main radar
differ-ence is that the time step of the ULE radar is 3 min, whereas in the case of the INM radar it is 10 min.
The 11th September 2004 event has been studied focusing on the Zaragoza INM radar and the radar parameters used for characterising the event were: VIL “Vertical Integrated Liq-uid” (Greene and Clark, 1972), VILD “VIL density” (Am-burn and Wolf, 1997), VOD “VIL of the Day” (San Ambro-sio, 2005; Paxton and Shepherd, 1993), H45 “Waldvogel Pa-rameter” and HP “Hail Probability” (Waldvogel et al., 1979), SHP “Severe Hail Probability” (Witt et al., 1998), MEHS “Maximum Expected Hail Size” (Witt et al., 1998), kinetic energy (Waldvogel et al., 1978 and Witt et al., 1998) and ECHOTOPS of 20, 30 and 40 dBZ. The objective of com-bining all of these parameters is to produce a good indicator of hail evidence. For example, VIL is an approximation of vertical liquid content and VOD is an empirical index of hail presence that can be used to establish a threshold of hail and no hail evidence. In the case of VOD, HP, H45, MEHS and SHP, thermodynamic data from an upper-air sounding are re-quired.
On the other hand, data from the Mesoscale Meteorologi-cal model MM5 have been used in order to obtain wind fields at four different levels (925, 850, 700 and 500 hPa) to carry out the 3-D-cells tracking of the hail event. The initial and boundary conditions come from the FNL/NCEP analyses (1◦ latitude×1◦longitude, every 6 h), and the model parameteri-sation applied here is shown in Table 2).
All these data have been integrated using RHAP software (Ceperuelo at al., 2006). The RHAP techniques used for identifying and characterising 3-D cells are an improved ver-sion of the SCIT algorithms (Johnson et al., 1998; Rigo and Llasat, 2004) and an improved version of the 3-D tracking method in TITAN (Dixon and Wiener, 1993). The 3-D cells
M. Ceperuelo et al.: Study of 11 September 2004 hailstorm event 217
Table 2. MM5 parameterisations.
Parameterisation D1 D2 D3 Moisture scheme Reisner2 Reisner2 Reisner2 Cumulus scheme BM KF Non PBL scheme MRF MRF MRF Radiation scheme Cloud Cloud Cloud Soil scheme 5-Layer 5-Layer 5-Layer Shallow convection No No No
tracking algorithm uses the mean wind grid point nearest to the cell centroid to extrapolate the current cell position to the previous position. The mean wind has been obtained using 925, 850, 700 and 500 hPa. After the position extrapolation, the cell in the previous radar image that satisfies the TITAN condition (the closest and the most similar cell) is searched in order to assign it as a tracked cell. Moreover, RHAP also enables us to identify, characterise and track the precipita-tion system. The classificaprecipita-tion of precipitaprecipita-tion systems is made on the basis of the proposal by Rigo and Llasat (2004) and includes: mesoscale convective system (MCS), isolated convection (ISO), multicellular (MUL), convective precipi-tation embedded in stratiform precipiprecipi-tation (EST-EMB) and stratiform precipitation (EST). The classification takes into account the size and duration of the system, as well as the contribution of convective precipitation and stratiform pre-cipitation. For each identified precipitation system it is pos-sible to obtain, among other data, the type of the 2-D sys-tem and its size, the percentage of convective precipitation, the maximum reflectivity and the centroid position, the maxi-mum axis, and the 3-D cells involved in the system. For each 3-D cell the following parameters were used: maximum and mean reflectivity, echotop and base mean values, and maxi-mum VIL and VILD values.
3 Meteorological situation
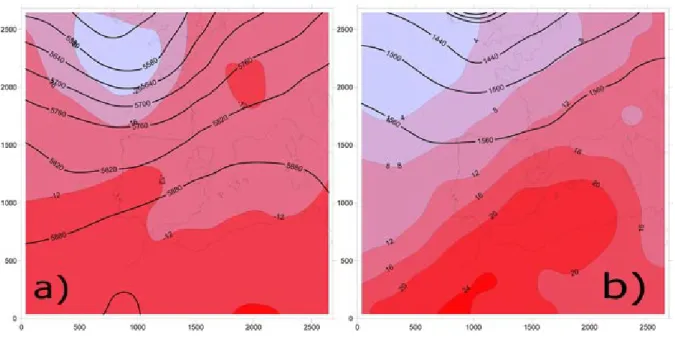
The synoptic situation observed on 11th September 2004 at 12:00 UTC showed a thermal depression over the Iberian Peninsula and a cold front in north-western Spain. A trough with a northeast-southwest axis was identified at high lev-els, 500 hPa (Fig. 2a) and caused a south-west flow over the Iberian Peninsula. The thermal anticyclone situated over North Africa and the Azores high-pressure system were re-sponsible of this situation. A thermal trough was also ob-served in the northwest of the Iberian Peninsula. This trough was contrasted with the presence of the African continental air mass over the eastern part of the Iberian Peninsula from surface level to 850 hPa (Fig. 2b). This fact and the cold air mass at high levels were the factors that favoured the thun-derstorms formed in the study area. This high instability was detected in the thermodynamic analysis, where the hail event was characterised with high values of the instability indices
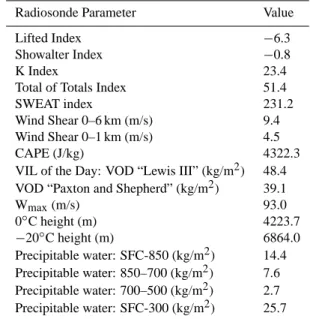
Table 3. Radiosonde parameters of 11 September 2004 hail event.
Radiosonde Parameter Value
Lifted Index −6.3
Showalter Index −0.8
K Index 23.4
Total of Totals Index 51.4
SWEAT index 231.2
Wind Shear 0–6 km (m/s) 9.4 Wind Shear 0–1 km (m/s) 4.5
CAPE (J/kg) 4322.3
VIL of the Day: VOD “Lewis III” (kg/m2) 48.4 VOD “Paxton and Shepherd” (kg/m2) 39.1
Wmax(m/s) 93.0 0◦C height (m) 4223.7 −20◦C height (m) 6864.0 Precipitable water: SFC-850 (kg/m2) 14.4 Precipitable water: 850–700 (kg/m2) 7.6 Precipitable water: 700–500 (kg/m2) 2.7 Precipitable water: SFC-300 (kg/m2) 25.7
(Table 3), with values of CAPE and TTI of 4322.3 J/kg and 51.4 respectively.
The convergence zones were located at the South-West of Lleida (Fig. 3) due to low-level wind perturbations caused by the mountains of Iberian System, with heights around 1700 m (Fig. 1). The low-level wind reanalysis showed a moisture advection over the convergence zones, behind a dry layer at mid-levels (850–700 hPa) with only 7.6 kg/m2of precipitable water mass that favoured triggering convection and hail pro-duction, as shown in Fig. 3. This figure shows how the con-vective cells nest zones obtained with radar data agree with the convergence zones obtained with the MM5 meteorologi-cal model.
4 Meteorological Radar and tracking of precipitation systems and 3-D cells
The radar analysis has shown that the maximum convec-tive activity appeared between 17:00 UTC and 18:00 UTC (Fig. 4) with some values of VIL over 40 kg/m2, VILD over 4 g/m3, HP of 100% and SHP with values over 75%. Hail observations were registered between 15:00 UTC and 19:00 UTC associated to high values of radar parameters (Zmax>50 dBz) in some places. Meanwhile, the maximum hailstone size was registered at the moment of maximum convective activity, with 62.0 dBZ (Fig. 5).
The VOD value using Lewis III was 48.4 kg/m2 and the VOD value using Paxton and Shepherd (1993) was 39.1 kg/m2. These high values showed that only cells with high vertical developments could produce hail in this event.
The hailstones registered in the Lleida region were pro-duced by two different cells. The cell that propro-duced the maximum hail size at surface (34.6 mm in diameter) was the
218 M. Ceperuelo et al.: Study of 11 September 2004 hailstorm event
Figure 2. Geopotential height (contour lines) and temperature (shaded areas) at 500Pa (a) and
850hPa (b).
20
Fig. 2. Geopotential height (contour lines) and temperature (shaded areas) at 500 Pa (a) and 850 hPa (b).Table 4. Radar parameters of the 11 September 2004 hail cells at the moment of maximum convective activity: Maximum reflectivity (Zmax),
Mean reflectivity (Zmean), Vertical Integrated Liquid (VIL), VIL density (VILD), Kinetic energy (KE), Hail probability (HP), Severe hail
probability (SHP) and Maximum expected hail size (MEHS).
Hailpad area Non-hailpad area
Cell Fraga and Alcarr´as cell
Almacelles cell Foz de Calanda cell La Cerollera, Rafales, Fuentespalda and Beceite cell Castelleser´as, Mazale´on and Calaceite cell Fornoles and La Portellada cell Candasnos, Pe˜nalba and Velilla de Cinca cell Hail size 31–45 mm 21–30 mm Chickpea Walnut Walnut Chickpea Walnut
Time (UTC) 17:30 17:20 15:20 16:10 17:30 18:10 18:40 Latitude 41.591 41.736 40.917 40.861 41.042 40.882 41.539 Longitude 0.348 0.411 −0.299 0.025 0.138 0.026 0.162 Zmax(dBZ) 56.8 54.8 55.2 55.2 56.8 56.0 60.0 Zmean(dBZ) 47.8 42.2 44.0 48.4 47.4 49.2 50.0 VIL (kg/m2) 38.8 11.7 26.1 45.6 35.9 19.1 63.5 VILD (g/m3) 3.7 2.3 3.7 3.6 4.2 3.2 6.0 KE (J/m2) 976.4 266.3 683.4 973.0 970.4 748.3 1776.2 HP (%) 100 48.9 75.5 100 88.8 100 100 SHP (%) 73.3 29.6 58.5 78.1 68.3 64.6 85.8 MEHS (mm) 70.9 12.5 39.3 85.9 58.0 50.1 116.1
Fraga and Alcarr´as cell at 17:30 UTC, with a VIL value of 38.82 kg/m2, and a VILD value of 3.7 g/m3(case 1). These values are close to the empirical value to obtain hail at sur-face level (VOD). The SHP showed a value of 73.3%, which points to a high likelihood of severe hail at surface level. In non-hailpad-covered areas the hailstones were traced back to 5 different cells, but the problem of this area is that no hail size information is available. However, if we were to com-pare the values obtained for hail cells in non-hailpad-covered areas to hail cells in hailpad-covered area, we could expect sizes larger than walnuts (>34 mm) in the latter region. This was the case of the cell that affected Candasnos-Pe˜nalba-Velilla de Cinca (Table 4) and recorded the most intense val-ues of the event, with maximum VIL value of 63.5 kg/m2,
maximum SHP of 85.7% and MEHS of 11.7 cm. These val-ues were higher than those from cells of the hailpad-covered area. In conclusion, we could expect larger hailstones. This hypothesis was confirmed by the meteorological observers.
The life cycle of the different radar parameters has been calculated in order to know the life cycle of the hail-storms, distinguishing between precipitation systems and 3-D cells. The hail system that produced the largest hail-stone (34.6 mm) in the hailpad-covered area, Alcarr´as and Fraga cell (case 1), and the hail system that produced hail in the longest-life cell of the non-hailpad-covered area, La Cerollera-Rafales-Fuentespalda-Beceite cell (case 2), have been only studied:
M. Ceperuelo et al.: Study of 11 September 2004 hailstorm event 219
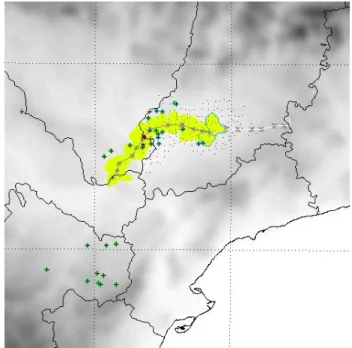
Figure 3. Trajectories of all the 3D cells (black lines) of the event and 925hPa wind field obtained with the MM5 meteorological model at 18:00 UTC (red arrows). Black points are the beginning of the 3D cells and blue points are the end of the 3D cells.
21 Fig. 3. Trajectories of all the 3-D cells (black lines) of the event and
925hPa wind field obtained with the MM5 meteorological model at 18:00 UTC (red arrows). Black points are the beginning of the 3-D cells and blue points are the end of the 3-D cells.
Figure 4. Histogram of the number of new 3D cells formed with time resolution of one hour.
Fig. 4. Histogram of the number of new 3-D cells formed with time
resolution of one hour.
4.1 Precipitation systems
In case 1 the precipitation structure started at 16:40 UTC as an EST-EMB system. Then it rapidly changed to an ISO sys-tem at 16:50 UTC, which lasted 30 min. At 17:30 UTC the system evolved to a MUL system with an area of 992 km2 and eight 3-D cells (four of them over 50 dBZ) and a per-centage of convective precipitation of 56%. At 17:40 UTC the MUL system merged with a southern MUL system to develop a bigger MUL system with twelve 3-D convective cells. At 18:00 UTC this bigger system split into two dif-ferent MUL systems. The northern one remained a MUL system until 18:30 UTC.
Figure 5. Maximum reflectivity product of 11 September 2004 hail event at 17:00 UTC (maximum reflectivity value of 62.0dBZ).
23 Fig. 5. Maximum reflectivity product of 11 September 2004 hail
event at 17:00 UTC (maximum reflectivity value of 62.0 dBZ).
Figure 6. Time evolution of the precipitation system parameters of the biggest system over the non-hailpad covered area that has produced hail. Time period: from 15:00 UTC to 18:20 UTC. Solid line shows the convective precipitation percentage evolution (%), dotted line shows de SHP (%) evolution, dashed line shows the evolution of the type of system, dash-dot line is the evolution of maximum reflectivity (dBZ) and dash-dot-dot line is the time evolution of VILZmax (kg/m2).
24
Fig. 6. Time evolution of the precipitation system parameters of
the biggest system over the non-hailpad covered area that has pro-duced hail. Time period: from 15:00 UTC to 18:20 UTC. Solid line shows the convective precipitation percentage evolution (%), dotted line shows de SHP (%) evolution, dashed line shows the evolution of the type of system, dash-dot line is the evolution of maximum reflectivity (dBZ) and dash-dot-dot line is the time evolution of VIL Zmax(kg/m2).
The system of case 2 began as an ISO type at 15:00 UTC and lasted until 15:50 UTC. At 16:00 UTC it evolved to a MUL system until 17:30 UTC, when hail precipitated (from 16:00 to 16:40 UTC). Then the system changed to an EST-EMB system until its disappearance. Figure 6 shows the time evolution of the type of system, Zmax, convective precipita-tion percentage, VILZ and SHP. The area covered by the pre-cipitation system and the biggest hail cell is shown in Fig. 7.
220 M. Ceperuelo et al.: Study of 11 September 2004 hailstorm event
Figure 7. Trajectory, area covered (15:30-17:30 UTC) and nowcast (60 minutes) of the La Cerollera-Rafales-Fuentespalda-Beceite cell (case 2), and trajectory and area covered (15:00-17:30 UTC) by the associated precipitation system (red area). Ground hail observations are also shown.
25
Fig. 7. Trajectory, area covered (15:30–17:30 UTC) and now-cast (60 min) of the La Cerollera-Rafales-Fuentespalda-Beceite cell (case 2), and trajectory and area covered (15:00–17:30 UTC) by the associated precipitation system (red area). Ground hail observations are also shown.
4.2 3-D cells
In case 1 a long lived cell of 120 min was identified (Fig. 8). However, after applying the RHAP reanalysis, based on the strong oscillations of VIL, it is possible to see this long lived cell was three consecutive different cells. The first one was active over the non-hailpad covered area and no hail observa-tions were available. Probably, this cell produced severe hail (hailstones of over 35 mm) due to the high values of the dif-ferent radar parameters: Zmax=62.0 dBz, VIL=54.1 kg/m2, VILD=5.1 g/m3(Table 5). The second cell affected the hail-pad covered area with hailstones of over 30 mm. It produced hail during thirty minutes with VIL values up to 35 kg/m2, SHP over 70% and Zmaxover 55 dBZ. Finally, the third cell was weaker than the other ones, with high reflectivity values, but small values for VIL and SHP due to the lower values of the tops of the cell.
Case 2 was a long lived cell of 130 min. As in the previ-ous case, this “cell” was composed by two consecutive cells. The first one lasted 100 min (Table 6) producing hail during 50 min with VIL values over 35 kg/m2, SHP over 70% and Zmaxover 54 dBZ.
Comparing the two analysed cases, the same hail condi-tions (VIL>35 kg/m2, SHP>70% and Zmax>54 dBZ) were generally fulfilled.
Finally, after analysing these two cases, a comparison be-tween the two different methods of identifying and track-ing 3-D cells (TITAN and RHAP) was carried out. The radar from the University of Le´on located in Zaragoza was used for the TITAN method. The most important difference found between the two identification methods was that
TI-Figure 8. Trajectory, area covered (16:40-18:30 UTC) and nowcast (60 minutes) of the Fraga and Alcarrás cell (case 1). Ground hail observations are also shown.
26
Fig. 8. Trajectory, area covered (16:40–18:30 UTC) and nowcast
(60 min) of the Fraga and Alcarr´as cell (case 1). Ground hail obser-vations are also shown.
TAN uses only one threshold value (30 dBZ) to identify the cell, whereas the RHAP algorithm uses 7 reflectivity thresh-olds (30, 35, 40, 45, 50, 55, 60 dBZ). Consequently, where the TITAN identifies one only structure, the RHAP can dis-tinguish between two or more cells (from a spatial point of view as a MUL system and from a temporal point of view following the life cycle of the cells). For this reason, the best correlation between both methods was obtained when the hail was produced by a main cell. The correlation coef-ficients of reflectivity, tops and volume for the non-hailpad covered area cell have been statistically significant at the 95% confidence level, largely explaining the variability (Ta-ble 7).
5 Conclusions
Using the meteorological model results and sounding param-eters, we conclude that the convective activity in the 11th September 2004 event was triggered by the synergy of mul-tiple factors: zones of wind convergence, high values of the instability indices, moisture advection at low levels and dry layer at mid-levels (850–700 hPa) with 7.6 kg/m2of precip-itable water. After the initiation of convection at 14:00 UTC, the maximum convective activity has been registered from 17:00 to 18:00 UTC with the maximum number of new cells, maximum reflectivity (62 dBZ) and maximum hailstone di-ameter (34.6 mm).
The application of the meteorological radar has allowed identifying and tracking two main systems: one related with the largest hailstone (34.6 mm) in the hailpad-covered area (case 1) and the other one related to the longest life cell of the
M. Ceperuelo et al.: Study of 11 September 2004 hailstorm event 221
Table 5. Life time evolution of radar parameters of 11 September 2004 Alcarr´as-Fraga cell (16:40 UTC – 18:30 UTC): Maximum reflectivity
(Zmax), Mean reflectivity (Zmean), Vertical Integrated Liquid (VIL), VIL density (VILD), Kinetic energy (KE), Hail probability (HP), Severe hail probability (SHP) and Maximum expected hail size (MEHS).
Time (UTC) Hail Longitude Latitude Zmax(dBZ) Zmean(dBZ) VIL (kg/m2) VILD (g/m3) KE (J/m2) MEHS (mm) SHP (%)
1830 No data 0.851 41.627 52.4 41.5 14.3 2.4 296.5 18.33 39.2 1820 Yes 0.788 41.639 49.2 43.7 14.7 1.7 202.2 26.66 48.7 1810 No data 0.724 41.649 51.2 42.2 13.6 1.6 205.4 18.81 39.9 1800 Yes 0.639 41.672 54.0 42.5 18.4 2.2 323.0 37.86 57.5 1750 No data 0.537 41.672 50.0 42.5 12.7 1.8 192.0 19.88 41.3 1740 Yes 0.404 41.648 56.8 45.3 39.8 3.8 988.8 64.41 70.9 1730 Yes 0.348 41.591 56.8 47.8 38.8 3.7 976.4 70.89 73.3 1720 Yes 0.304 41.547 58.0 46.0 35.3 3.4 822.5 64.30 70.9 1710 No data 0.273 41.505 52.0 42.1 8.5 1.9 140.0 41.82 60.0 1700 No data 0.177 41.464 62.0 50.4 54.1 5.1 1724.8 81.46 76.8 1650 No data 0.164 41.423 53.2 42.6 20.3 2.4 401.9 46.68 62.8 1640 No data 0.130 41.388 35.6 33.0 0.7 0.3 0.0 0.00 0.0
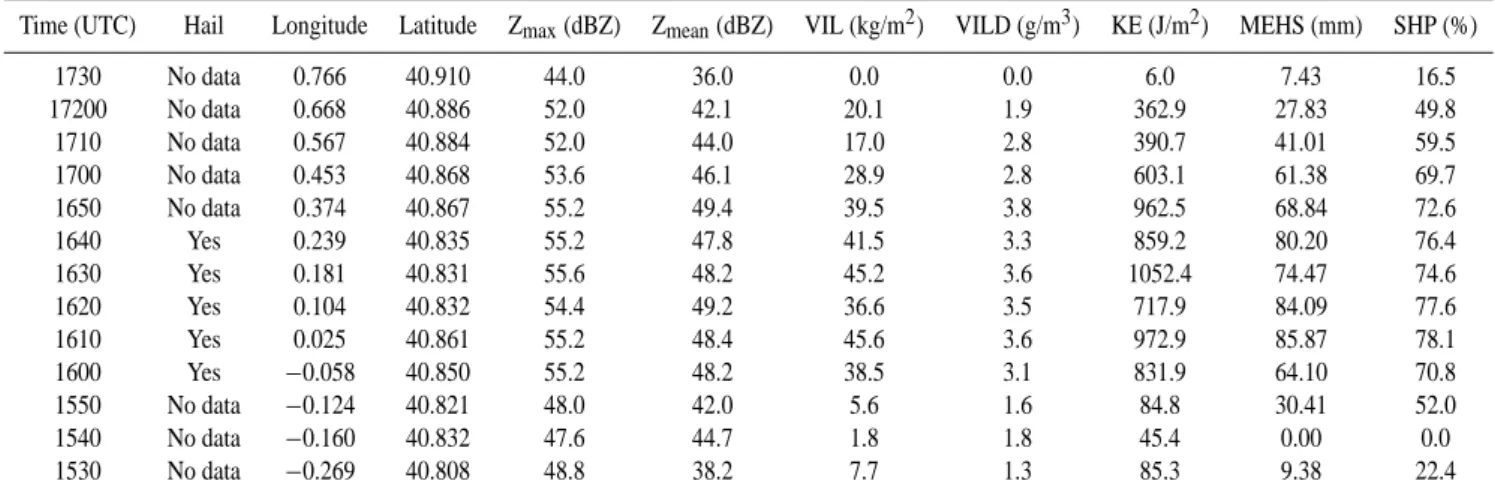
Table 6. Life time evolution of radar parameters of 11 September 2004 La Cerollera-Rafales-Fuentespalda-Beceite cell (15:30 UTC – 17:30
UTC): Maximum reflectivity (Zmax), Mean reflectivity (Zmean), Vertical Integrated Liquid (VIL), VIL density (VILD), Kinetic energy (KE), Hail probability (HP), Severe hail probability (SHP) and Maximum expected hail size (MEHS).
Time (UTC) Hail Longitude Latitude Zmax(dBZ) Zmean(dBZ) VIL (kg/m2) VILD (g/m3) KE (J/m2) MEHS (mm) SHP (%)
1730 No data 0.766 40.910 44.0 36.0 0.0 0.0 6.0 7.43 16.5 17200 No data 0.668 40.886 52.0 42.1 20.1 1.9 362.9 27.83 49.8 1710 No data 0.567 40.884 52.0 44.0 17.0 2.8 390.7 41.01 59.5 1700 No data 0.453 40.868 53.6 46.1 28.9 2.8 603.1 61.38 69.7 1650 No data 0.374 40.867 55.2 49.4 39.5 3.8 962.5 68.84 72.6 1640 Yes 0.239 40.835 55.2 47.8 41.5 3.3 859.2 80.20 76.4 1630 Yes 0.181 40.831 55.6 48.2 45.2 3.6 1052.4 74.47 74.6 1620 Yes 0.104 40.832 54.4 49.2 36.6 3.5 717.9 84.09 77.6 1610 Yes 0.025 40.861 55.2 48.4 45.6 3.6 972.9 85.87 78.1 1600 Yes −0.058 40.850 55.2 48.2 38.5 3.1 831.9 64.10 70.8 1550 No data −0.124 40.821 48.0 42.0 5.6 1.6 84.8 30.41 52.0 1540 No data −0.160 40.832 47.6 44.7 1.8 1.8 45.4 0.00 0.0 1530 No data −0.269 40.808 48.8 38.2 7.7 1.3 85.3 9.38 22.4
non-hailpad-covered area (case 2). The evolution has shown the systems started as isolated convection that lasted around 40 minutes. Then, they developed into a multicellular system and the largest hailstones were produced. As a multicellular system they lasted around 1 and 1.5 h. In some occasions, if VIL oscillations are considered, it is possible to conclude that more than one cell was developed along the track. Hail-producing cells have been characterised by the high values of radar parameters: VIL, VILD, HP, SHP, KE, Zmax, Zmean, etc. Generally values of VIL, VILD, HP, SHP and Zmax are above 35 kg/m2, 7 g/m3, 100%, 70% and 54 dBZ, respec-tively
The comparison of TITAN and RHAP methods has shown similar results when the hail was associated to a main cell. On the contrary, if hail could be associated to different cells into a MUL system the RHAP methods would be more useful
Table 7. Pearson, Kendall’s τband Spearman’s ρ correlation
coeffi-cients between TITAN and RHAP track methods for the Cerollera, Rafales, Fuentespalda and Beceite cell.
Correlation coefficients Variable Pearson Kendall’s τ b Spearman’s ρ Top TITAN/Top RHAP 0.684** 0.478* 0.641* Volume TITAN/Volume RHAP 0.744** 0.513* 0.720** Z(dBZ) TITAN/Z(dBZ) RHAP 0.693** 0.521* 0.719** ∗
The correlation is significant at the 95% confidence level.
222 M. Ceperuelo et al.: Study of 11 September 2004 hailstorm event because it could distinguish the internal system structure and
its life cycle.
Further studies will be based on this kind of analysis to characterise hail phenomena and will improve the nowcast-ing of radar parameters of 3-D cells and precipitation sys-tems.
Acknowledgements. The authors thank the MONEGRO
(REN2003-09617-C02-02) Spanish project for enabling the drawing up and presentation of this contribution. Our thanks to the Associaci´o de defensa dels Vegetals, Maite Tor`a and Marta Masot,to the Meteorological Service of Catalonia of the
General-itat de Catalunya and to the Instituto Nacional de Meteorolog´ıa
for the hailpad data, radiosonde data and radar data. And, finally, thanks to the University of Le´on and the observers of Arag´on for ground truth data.
Edited by: V. Kotroni and K. Lagouvardos Reviewed by: T. Karacostas
References
Amburn, S. and Wolf, P.: VIL Density as a Hail indicator, Wea. Forecasting, 12, 473–478, 1997.
Browning, K. A.: The structure and mechanism of hailstorms, Me-teorol. Monogr., 16, 38, 1–39, 1977.
Ceperuelo, M., Llasat, M. C., and Rigo, T.: Rainfall events and Hailstorms Analysis Program (RHAP), Adv. Geosci., in press, 2006.
Dixon, M. and Wiener, G.: Thunderstorm Identification, Tracking, Analysis and Nowcasting – A Radar-based Methodology, J. At-mos. Oceanic Technol., 10, 6, 785–797, 1993.
Font, I.: Climatological Atlas of Spain (in Spanish: Atlas Clim´atico de Espa˜na), INM and Ministerio de Transportes, Turismo y Co-municaciones, Madrid, 1983.
Fraile, R., Castro, A., S´anchez, J. L., Marcos, J. L., and L´opez, L.: Noteworthy C-band radar parameters of storms on hail days in northwestern Spain, Atmos. Res., 59–60, 41–61, 2001.
Greene, D. R. and Clark, R. A.: Vertically Integrated Liquid: a new analysis tool, Mon. Wea. Rev., 100, 548–552, 1972.
Johnson, J. Y., MacKeen, P. L., Witt, A., Mitchell, E. D., Stumpf, G. J., Eilts, M. D., and Thomas K. W.: The Storm Cell Identifi-cation and Tracking (SCIT) Algorithm: An Enhanced WSR-88D Algorithm. Weather and Forecasting, June 1998, 13, 263–276, 1998.
Knight, C. A. and Knight, N. M.: Hailstorms. Severe Convective Storms, Meteorol. Monogr., 28, 50, 223–254, 2001
Llasat, M. C., Gibergans, J., Guilbaud, S., and Rodriguez, J. Y.: The use of the vertical thermodynamic data in the daily clas-sification: application to the improvement of an analog tech-nique, INM/WMO International Symposium on Cyclones and Hazardous Weather in the Mediterranean, Palma de Mallorca, 395–402, 1997.
L´opez, L.: Atmospheric severe convection: forecasting and identi-ficating hailstorms (in Spanish), Doctoral Thesis, University of Le´on, 2003.
Mart´ın, F., Eliazaga, F., Carretero, O., and San Ambrosio, I.: Deep convection diagnosis and prediction (in Spanish), STAP Techni-cal note no. 35, 2001.
Pascual, R.: Study of hailstorms in the Lleida region (in Spanish), Technical note no. 3, Regional Meteorological Centre of Catalo-nia, 2000.
Paxton, C. H. and Shepherd, J. M.: Radar Diagnostic Parameters as Indicators of Severe Weather in Central Florida, NOAA Tech. Memo. NWS SR-149, 12, 1993.
Ragette, G.: Mesoscale Circulations Associated with Alberta Hail-storms, Mon. Wea. Rev., 101, 150–159, 1973.
Rigo, T.: Study of Occidental Mediterranean Convective Mesoscale Systems using meteorological radar (in Spanish), Doctoral The-sis, University of Barcelona, internal publication, 2004. Rigo, T. and Llasat, M. C.: A methodology of convective structures
using meteorological radar: application to heavy rainfall events on the Mediterranean coast of the Iberian Peninsula, Nat. Haz-ards Earth Syst. Sci., 4, 59–68, 2004.
San Ambrosio, I.: Radar-based module for hail estimation (in Span-ish), STAP Technical Note no. 44, 2005.
S´anchez, J. L., Fern´andez, M. V., Fern´andez, J. T., Tudur´ı, E., and Ramis, C.: Analysis of mesoscale convective systems with hail precipitation, Atmos. Res., 67–68, 573–588, 2003.
Schleusener, R. A. and Jenings, P. C.: An energy method for relative estimates of hail intensity, Bull. Amer. Meteor. Soc., 41, 372– 376, 1960.
Waldvogel, A., Federer, B., Schmid W., and Mezeix, J. F.: The kinetic energy of hailfalls. Part II. Radar and hailpads, J. Appl. Meteorol., 17, 1680–1693, 1978.
Waldvogel, A., Federer, B., and Grimm, P.: Criteria for the detec-tion of hail, J. Appl. Meteorol., 16, 1521–1525, 1979.
Witt, A., Eilts, M. D., Stumpf, G. J., Johnson, J. T., Mitchell, E. D., and Thomas, K. W.: An enhanced hail detection algorithm for the WSR-88D, Wea. Forecasting, 13, 286–303, 1998.