How do the large-scale dynamics of galaxy interactions trigger star formation in the Antennae galaxy merger?
185
0
0
Texte intégral
(2) Institut d’Astrophysique Spatiale École doctorale d’Astronomie et d’Astrophysique d’Ile de France. How do the large-scale dynamics of galaxy interactions trigger star formation in the Antennae galaxy merger? PHD THESIS submitted and publicly defended on November 5th, 2012 to obtain the title of. Docteur de l’Université de Paris Sud-XI Spécialité Astrophysique et Astrophysique. by. Cinthya Natalia Herrera Contreras Composition of the jury :. President : Reviewers :. Examiners :. Thesis Director :. Guillame Pineau des Forêts Jérôme Pety Christine D. Wilson. -. Institut d’Astrophysique Spatiale. -. IRAM, LERMA Depatment of Physics and Astronomy McMaster University Pierre-Alain Duc - CEA Saclay Mónica Rubio - Departamento de Astronomía Universidad de Chile François Boulanger - Institut d’Astrophysique Spatiale. Université Paris-Sud XI.
(3)
(4) Institut d’Astrophysique Spatiale École doctorale d’Astronomie et d’Astrophysique d’Ile de France. Comment la dynamique à grande échelle déclenche la formation d’étoiles dans les galaxies des Antennes? THÈSE DE DOCTORAT présentée et soutenue publiquement le 5 novembre, 2012 pour l’obtention du grade de. Docteur de l’Université de Paris Sud-XI Spécialité Astrophysique et Astronomie. par. Cinthya Natalia Herrera Contreras Composition du jury :. Président : Rapporteurs :. Examinateurs :. Directeur de thèse :. Guillame Pineau des Forêts Jérôme Pety Christine D. Wilson. -. Institut d’Astrophysique Spatiale. IRAM, LERMA Depatment of Physics and Astronomy McMaster University Pierre-Alain Duc - CEA Saclay Mónica Rubio - Departamento de Astronomía Universidad de Chile François Boulanger - Institut d’Astrophysique Spatiale. Université Paris-Sud XI.
(5)
(6) i. Acknowledgments During these three years that I spent in Orsay/Paris doing my PhD, I received the help, company and support of a lot of people, that was essential to me for finishing my thesis. I would like to give a big THANKS all of them. I am extremely grateful to my supervisor Dr. François Boulanger. Thanks François for all of the time that you spent teaching me and helping me (including french bureaucracy things). By your side, I learned plenty of things about work, science and life. Thanks for always encouraging me, and for working together sometimes until very late (thanks Pascale too for your patience!). This thesis is mainly the result of your excellent guidance. In addition, I want to thank Dr. Nicole Nesvadba, with whom I also worked during these three years. Thanks Nicole for helping me to see my work from a more extragalactic point of view and for teaching me both science and communicational skills. The dynamism between you and François taught me a lot. Also, thank you very much for correcting my english in this manuscript and in the papers too. Thanks to the members of the jury of my thesis, Dr. Christine Wilson, Dr. Jêrome Pety, Dr. Mónica Rubio, Dr. Pierre-Alain Duc and Dr. Guillaume Pineau de Forêts, for reading carefully my thesis. Also, I thanks the MIS group, with whom I was able to develop my speaker skills, by presenting my work and getting useful feedback. I am also very grateful to the CNRS-CONICYT 2009 scholarship that gave me the opportunity of doing my PhD at the IAS. Three years away from your family is a lot and, if you are very attached to them as I am, it can be very hard. I was able to complete my PhD work because I found support and company in Paris. I want to thanks to all my friends that I shared beautiful and funny moments with. I think I was very lucky for finding such a bunch of beautiful people. Many of them became an important part of my life. My chilean friends, Vivi and Vale, who were there with me since almost the very beginning, and then Celia who joined us. Thanks that you are/were here my friends, I didn’t lose my chilean spirit! An IAS (and gym, pubs, wine, pizzas, and a thousand things more) without M.I.R. Alves wouldn’t be the same for me. Thanks Marta for your valuable friendship, support and help in improving my english skills. A PhD is full of lunches, coffees, seminars, pots, conferences, la pause, etc. I want to thank to many other students and post-docs at the IAS. Specially, thanks to Andrea, Tuhin, Antoine, Melanie, Beth, Niraj, Gonzalo, Leo, Marco, Lapo, Nathalie, Dan, Claudia, Anna and Martine. Because of my french classes, I had the chance of meeting non-astronomical people. I want to thank my friends that changed my parisian life: my dear good friend Qian, Adam, Denis, Denise, Liz and Alex. We had such a good time/soirées in Paris (and Belgium!). In particular, thanks Mehdi for taking care of me and supporting me during the final stage of my thesis and in all my decisions after that. During all my life, my family has been there with and for me, supporting me and encouraging me. I want to thank my beloved mom Cecilia and two sisters Evelyn and Karla, and to my dad Juan Carlos. Your support was fundamental for me. Thanks for being always present..
(7) ii.
(8) iii. Abstract The Antennae (22 Mpc) is one of the most well-known mergers in the nearby Universe. Its distance allow us to observe and study the gas at the scales of stellar cluster formation. It is an ideal source to understand how the galaxy dynamics in mergers trigger the formation of stars. Most of the stars in the Antennae are formed in compact and massive stellar clusters, dubbed super-star clusters (SSCs). The most massive (> 106 M
(9) ) and youngest (< 6 Myr) SSCs are located in the overlap region, where the two galaxies collide, and are associated with massive (several 108 M
(10) ) and super-giant (few hundred of pc) molecular complexes (SGMCs). The formation of SSCs must involve a complex interplay of merger-driven gas dynamics, turbulence fed by the galaxy interaction, and dissipation of the kinetic energy of the gas. Within SGMCs, a hierarchy of structures must be produced, including dense and compact concentrations of molecular gas massive enough to form SSCs, pre-cluster clouds (PCCs). For star formation to occur, the mechanical energy of PCCs must be radiated away to allow their self-gravity to locally win over their turbulent gas pressure. Specific tracers of turbulent dissipation are therefore key inputs to test the validity of this theoretical scenario. In my thesis, I studied the Antennae overlap region. My work is based on observations with the SINFONI spectro-imager at the VLT, which includes H2 rovibrational and Brγ line emission, and with ALMA, which includes the CO(3−2) line and dust continuum emission. Both data-sets have the needed sub-arcsecond angular resolution to resolve the scales of SSC formation. The spectral resolutions are enough to resolve motions within SGMCs. Combining CO and H2 line emission is key in my PhD work. I use CO as a tracer of the distribution and kinematics of the molecular gas, and H2 as a tracer of the rate at which the gas mechanical energy is dissipated. My thesis focuses on diverse sources in the Antennae overlap region which trace different stages of star formation: the gathering of mass necessary to form SGMCs, the formation of PCCs within SGMCs and the disruption of a parent cloud by a newly formed SSC. I show that at each stage turbulence plays a key role. I found that the kinetic energy of the galaxies is not thermalized in large scale shocks, it drives the turbulence in the molecular ISM at a much higher level than what is observed in the Milky Way. Near-IR spectral diagnostics show that, outside of SSCs embedded in their parent clouds, the H2 line emission is powered by shocks and traces the dissipation of the gas turbulent kinetic energy. I relate the H2 emission to the loss of kinetic energy required to form gravitationally bound clouds. This interpretation is supported by the discovery of a compact, bright H2 source not associated with any known SSC. It has the largest H2 /CO emission ratio and is located where the data show the largest velocity gradient in the interaction region. To our knowledge, this is the first time that an extragalactic source with such characteristics is identified. We would be witnessing the formation of a cloud massive enough to form a SSC. The data also allow us to study the disruption of a parent molecular cloud by an embedded SSC. Its matter is loosely bound and its gravity would be supported by turbulence, which makes it easier for feedback to disrupt the parent cloud. I end my manuscript presenting two projects. I propose to establish additional energy dissipation tracers observable with ALMA, which gives us the high spatial and spectral resolution needed to isolate scales at which clusters form. This is a Cycle 1 proposal accepted in first priority. I also plan to expand my work to other nearby extragalactic sources by investigating the turbulence-driven formation of stars in different extragalactic sources by combining near-IR and submillimeter observations..
(11) iv.
(12) v. Résumé Les Antennes sont une des fusions de galaxies les plus connues dans l’Univers proche. Sa proximité nous permet d’observer et d’étudier ses gaz à l’échelle de la formation des amas stellaires. C’est une source idéale pour comprendre comment la dynamique dans les fusions de galaxies déclenche la formation d’étoiles. La plupart des étoiles dans les Antennes sont formées dans des amas stellaires compacts et massifs, surnommés super-star clusters (SSC). Les SSC les plus massifs (> 106 M
(13) ) et les plus jeunes (< 6 Myr) sont situés dans la région de collision entre les deux galaxies et sont associés aux complexes moléculaires massifs (∼ 108 M
(14) ) et super-géants (des centaines de pc) (super-giant molecular clouds, SGMCs). La formation de SSC doit impliquer une intéraction complexe entre la dynamique des gaz et une turbulence entraînée par la fusion des galaxies, et la dissipation de l’énergie cinétique des gaz. Dans les SGMC, une hiérarchie de structures doit être produite, incluant des concentrations denses et compactes de gaz moléculaires qui sont suffisamment massifs pour former un SSC, des nuages pre-cluster clouds (PCC). La formation des étoiles se produira si l’énergie mécanique des PCC est émise dans le lointain, permettant à l’auto-gravité de gagner localement les pressions thermique et turbulente du gaz. Des diagnostics spécifiques de dissipation turbulente sont donc des éléments essentiels pour tester la validité de ce scénario. J’étudie la région d’intéraction des Antennes. J’utilise des observations avec le spectroimageur SINFONI sur le VLT (raies rovibrationnelles de H2 ) et ALMA (raie CO(3–2) et l’émission du continuum de la poussière). Les données ont des résolutions angulaires pour résoudre les échelles de la formation des SSC et des résolutions spectrales pour résoudre les mouvements à l’intérieur du SGMC. La combinaison des raies CO et H2 est essentielle dans mon travail. J’utilise le CO comme traceur de la distribution et de la cinématique du gaz moléculaire, et H2 comme traceur du taux de dissipation d’énergie mécanique de gaz. Ma thèse se concentre sur des sources traçant des différentes étapes de la formation d’étoiles : le rassemblement des gaz pour former des SGMCs, la formation des PCC dans les SGMCs et la destruction des nuages moléculaires par les SSC. Je montre que la turbulence joue un rôle essentiel à chaque étape. J’ai trouvé que l’énergie cinétique de rencontre des deux galaxies n’est pas thermalisée dans les chocs aux échelles où elle est injectée. Elle entraîne une turbulence dans l’ISM moléculaire à un niveau beaucoup plus élevé que celui observé dans la Voie Lactée. Sauf dans les SSC encore intégrés dans les nuages moléculaires, la raie de H2 est produite par des chocs et trace la dissipation de l’énergie cinétique turbulente du gaz. J’associe l’émission de H2 à la perte d’énergie cinétique nécessaire pour former des nuages gravitationnellement liés. Cette interprétation est étayée par la découverte d’une source lumineuse et compacte en H2 , qui n’est associée à aucun SSC connu, située là où les données montrent le plus grand gradient de vitesse. À notre connaissance, c’est la première fois qu’une source extragalactique avec ces caractéristiques est identifiée. Nous observons la formation d’un nuage suffisamment massif pour former un SSC. Les données montrent également la destruction d’un nuage moléculaire par un SSC récemment formé. Sa matière est faiblement liée. Sa gravité serait soutenue par la turbulence, ce qui rend plus facile pour les mécanismes de rétroaction de perturber le nuage parent. Enfin, je présente deux projets. Je propose d’établir d’autres traceurs de dissipation d’énergie observables avec ALMA, proposition du Cycle 1 acceptée en première priorité. Je propose également d’étendre mon travail pour étudier la formation des étoiles entraînées par la turbulence dans différentes sources extragalactiques en combinant les observations dans le proche infrarouge et submillimétrique..
(15) vi.
(16) Contents 1 Introduction 1.1 Cosmological framework . . . . . . . . . . . . . . . . . . . . . . . . . 1.2 Galaxy formation and evolution . . . . . . . . . . . . . . . . . . . . . 1.2.1 Galaxies in the Universe . . . . . . . . . . . . . . . . . . . . . 1.2.2 Hierarchical model of dark matter halo collapse and galaxy evolution . . . . . . . . . . . . . . . . . . . . . . . . . . . . . 1.2.3 Hierarchical, merger-driven growth of galaxies . . . . . . . . . 1.2.4 Galaxy formation by cold accretion and ‘monolithic’ collapse of baryons . . . . . . . . . . . . . . . . . . . . . . . . . . . . . 1.3 Galaxy interactions and mergers in the local Universe . . . . . . . . 1.4 The interstellar medium . . . . . . . . . . . . . . . . . . . . . . . . . 1.4.1 The multiphase ISM . . . . . . . . . . . . . . . . . . . . . . . 1.4.2 Interstellar environments . . . . . . . . . . . . . . . . . . . . . 1.5 Star formation . . . . . . . . . . . . . . . . . . . . . . . . . . . . . . 1.5.1 Tracing the star formation . . . . . . . . . . . . . . . . . . . . 1.5.2 Molecular gas, the fuel to form stars. . . . . . . . . . . . . . . 1.5.3 Star formation rate . . . . . . . . . . . . . . . . . . . . . . . . 1.5.4 Overview of the star formation process . . . . . . . . . . . . . 1.5.5 Star formation efficiency . . . . . . . . . . . . . . . . . . . . . 1.6 The role of turbulence . . . . . . . . . . . . . . . . . . . . . . . . . . 1.6.1 Interstellar turbulence . . . . . . . . . . . . . . . . . . . . . . 1.6.2 Turbulent energy cascade and dissipation . . . . . . . . . . . 1.7 Aim and structure of this thesis . . . . . . . . . . . . . . . . . . . . .. 1 2 4 4 5 6 7 9 12 13 14 20 21 21 22 23 25 26 26 27 29. 2 The Antennae galaxies 2.1 The molecular gas in the overlap region: super-giant molecular complexes . . . . . . . . . . . . . . . . . . . . . . . . . . . . . . . . . . . 2.2 The star formation: super-star clusters . . . . . . . . . . . . . . . . . 2.3 The Antennae across the electromagnetic spectrum . . . . . . . . . . 2.4 Numerical simulations . . . . . . . . . . . . . . . . . . . . . . . . . .. 31. 3 Observations, data reduction and observational results 3.1 Near-Infrared observations . . . . . . . . . . . . . . . . . . . 3.1.1 SINFONI observations . . . . . . . . . . . . . . . . . 3.1.2 CRIRES observations . . . . . . . . . . . . . . . . . 3.2 Radio observations: ALMA . . . . . . . . . . . . . . . . . . 3.3 Data analysis . . . . . . . . . . . . . . . . . . . . . . . . . . 3.3.1 Measuring the near-IR continuum and line emission 3.3.2 Measuring the sub-mm continuum and line emission 3.4 Observational results . . . . . . . . . . . . . . . . . . . . . .. 43 44 45 47 49 51 52 53 54. . . . . . . . .. . . . . . . . .. . . . . . . . .. . . . . . . . .. . . . . . . . .. 32 34 36 39.
(17) ii. Contents. 3.5. 3.4.1 CO vs H2 emission . . . . . . . . 3.4.2 The ionized gas emission: Brγ . 3.4.3 SGMCs in the overlap region . . 3.4.4 Compact molecular source, PCC1 Summary . . . . . . . . . . . . . . . . .. . . . . .. . . . . .. . . . . .. . . . . .. . . . . .. . . . . .. . . . . .. . . . . .. . . . . .. 4 Nature of the H2 emission from the Antennae overlap 4.1 H2 excitation diagrams . . . . . . . . . . . . . . . . . . . 4.2 Is the H2 emission powered by shocks or UV radiation? . 4.2.1 Extinction-independent diagnostics: H2 lines . . 4.2.2 Extinction-independent diagnostics: Atomic lines 4.2.3 Extinction-independent diagnostics: H2 and Brγ 4.2.4 Morphology of the gas as a diagnostic . . . . . . 4.2.5 H2 emission is shock powered . . . . . . . . . . . 4.3 Bolometric H2 luminosity of PCC1 and SGMC 2 . . . . 4.3.1 Extinction correction . . . . . . . . . . . . . . . . 4.3.2 Bolometric correction . . . . . . . . . . . . . . . 4.4 Summary . . . . . . . . . . . . . . . . . . . . . . . . . .. . . . . .. . . . . .. . . . . .. . . . . .. . . . . .. . . . . .. . . . . .. 54 57 58 61 65. region . . . . . . . . . . . . . . . . . . . . . . . . . . . . . . . . . . . . . . . . . . . . . . . . . . . . . . .. . . . . . . . . . . .. . . . . . . . . . . .. 67 68 71 72 72 73 74 75 75 76 77 78. 5 From large scale gas compression to star formation 5.1 Gas compression and gravitational fragmentation . . . 5.2 The energetics and formation of the SGMC 2 complex 5.3 The nature of PCC1 . . . . . . . . . . . . . . . . . . . 5.3.1 PCC1 mass . . . . . . . . . . . . . . . . . . . . 5.3.2 Is there star formation within PCC1? . . . . . 5.3.3 PCC1, forming by gas accretion . . . . . . . . . 5.4 Discussion . . . . . . . . . . . . . . . . . . . . . . . . . 5.4.1 The formation of super-star clusters . . . . . . 5.4.2 The impact of turbulence . . . . . . . . . . . . 5.5 Conclusions . . . . . . . . . . . . . . . . . . . . . . . .. . . . . . . . . . .. . . . . . . . . . .. . . . . . . . . . .. . . . . . . . . . .. . . . . . . . . . .. . . . . . . . . . .. . . . . . . . . . .. . . . . . . . . . .. 79 80 82 85 85 85 86 87 87 88 89. 6 Stellar Feedback 6.1 Search for SSCs within their parent clouds . . . . 6.1.1 Known SSCs within SINFONI fields . . . 6.1.2 SINFONI measurements of SSCs . . . . . 6.1.3 The early evolution of SSCs . . . . . . . . 6.2 SSC still embedded in its parent molecular cloud 6.2.1 Physical properties . . . . . . . . . . . . . 6.2.2 Modeling of the H ii region and PDR . . 6.2.3 Comparison of feedback mechanisms . . . 6.2.4 Comparison with gravity . . . . . . . . . . 6.2.5 Expansion time-scale of the complex . . . 6.3 Conclusions . . . . . . . . . . . . . . . . . . . . .. . . . . . . . . . . .. . . . . . . . . . . .. . . . . . . . . . . .. . . . . . . . . . . .. . . . . . . . . . . .. . . . . . . . . . . .. . . . . . . . . . . .. . . . . . . . . . . .. 91 93 93 95 97 99 99 105 110 114 115 116. . . . . . . . . . . .. . . . . . . . . . . .. . . . . . . . . . . ..
(18) Contents 7 Conclusions and Perspectives 7.1 Conclusions . . . . . . . . . . . . . . . . . . . . . . . . . . . . . . 7.2 Quantifying turbulence and searching for more PCC-like sources diverse environments . . . . . . . . . . . . . . . . . . . . . . . . . 7.2.1 Searching for PCC-like sources in the mid-IR . . . . . . . 7.2.2 Observing molecular shock tracers with ALMA . . . . . . 7.2.3 Observing other galaxies . . . . . . . . . . . . . . . . . . . A An additional molecular compact source, PCC2. iii 118 . . 118 in . . 122 . . 122 . . 124 . . 125 127. B Articles published in Astronomy & Astrophysics 132 From large scale gas compression to cluster formation in the Antennae overlap region. . . . . . . . . . . . . . . . . . . . . . . . . . . . . . . 133 ALMA CO and VLT/SINFONI H2 observations of the Antennae overlap region: mass and energy dissipation. . . . . . . . . . . . . . . . . . . 146 C Press Releases and Outreach 150 CNRS Press Release . . . . . . . . . . . . . . . . . . . . . . . . . . . . . . 151 BBC News . . . . . . . . . . . . . . . . . . . . . . . . . . . . . . . . . . . 155 D Definition of Constants. 157. E Abbreviations. 158. Bibliography. 159.
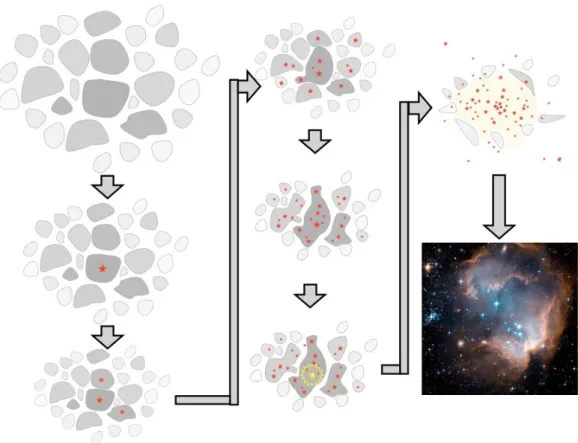
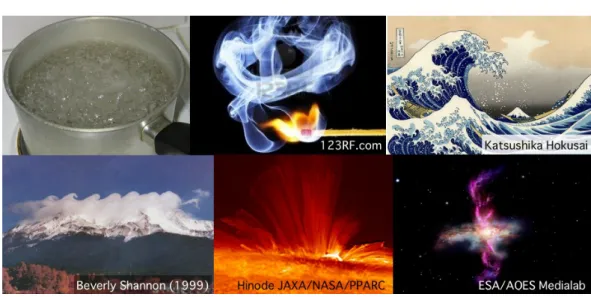
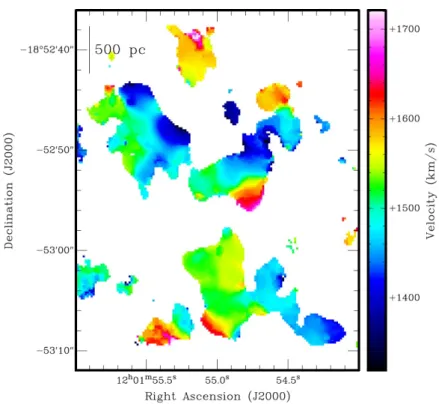
(19) List of Figures 1.1 1.2 1.3 1.4 1.5 1.6 1.7 1.8 1.9 1.10 1.11 1.12 1.13 1.14 1.15 1.16 1.17 1.18 1.19. Timeline of the Universe . . . . . . . . . . . . . . . . . Hubble’s classification of galaxies in the Universe . . . Hierarchical merger scenario . . . . . . . . . . . . . . . Monolithic collapse scenario . . . . . . . . . . . . . . . Interacting galaxies in the local Universe . . . . . . . . The ISM in the Milky Way . . . . . . . . . . . . . . . Three phase model of the ISM . . . . . . . . . . . . . . Molecular cloud, PDR and H ii region . . . . . . . . . UV pumping of the H2 molecule . . . . . . . . . . . . Kepler’s supernova remnant . . . . . . . . . . . . . . . Structure of a C-type shock . . . . . . . . . . . . . . . Main cooling agents in shocks . . . . . . . . . . . . . . Star birth in our Milky Way - Pillars of Creation . . . Kennicutt-Schmidt law . . . . . . . . . . . . . . . . . . Evolutionary sequence of molecular clouds . . . . . . . Formation of stellar clusters . . . . . . . . . . . . . . . Examples of turbulence in nature . . . . . . . . . . . . Cascade of kinetic energy in turbulent flows . . . . . . Turbulence in molecular clouds, velocity dispersion-size. . . . . . . . . . . . . . . . . . . . . . . . . . . . . . . . . . . . . . . . . . . . . . . . . . . . . . . . . . . . . . . . . . . . . . . . . . . . . . . . . . . . . . . . . . . relation. . . . . . . . . . . . . . . . . . . .. . . . . . . . . . . . . . . . . . . .. . . . . . . . . . . . . . . . . . . .. 2.1 2.2 2.3 2.4 2.5 2.6 2.7 2.8 2.9 2.10. 3 5 6 8 10 12 13 16 17 18 19 20 21 23 24 25 27 28 29. The Antennae galaxy merger . . . . . . . . . . . . . . . . . . . . . . SGMCs in the Antennae galaxies . . . . . . . . . . . . . . . . . . . . CO(3−2) velocity field of the overlap region, observed with the SMA SSCs in the Antennae galaxy merger . . . . . . . . . . . . . . . . . . Antennae galaxies in X-ray . . . . . . . . . . . . . . . . . . . . . . . Antennae galaxies in the IR . . . . . . . . . . . . . . . . . . . . . . . Antennae galaxies at 6 cm . . . . . . . . . . . . . . . . . . . . . . . . Antennae galaxies at 21 cm . . . . . . . . . . . . . . . . . . . . . . . Compressive modes in the N-body simulations of Renaud et al. (2008) N-body+hydrodynamical simulations compared with observed H i kinematics in the tidal tides . . . . . . . . . . . . . . . . . . . . . . . 2.11 N-body+hydrodynamical simulations compared with observed H i kinematics in the galaxy disks . . . . . . . . . . . . . . . . . . . . . .. 31 33 34 35 36 37 38 38 40. 3.1 3.2 3.3 3.4 3.5 3.6. 44 45 46 47 48 49. The Very Large Telescope . . . . . . . . . . . . . . . . . . The Antennae galaxies as seen by the CFHT . . . . . . . SINFONI and CRIRES pointings in the Antennae galaxies CRIRES and SINFONI instrument at the VLT . . . . . . CRIRES slits on the target . . . . . . . . . . . . . . . . . ALMA interferometer with 19 antennas . . . . . . . . . .. . . . . . .. . . . . . .. . . . . . .. . . . . . .. . . . . . .. . . . . . .. 41 42.
(20) List of Figures 3.7. v. 3.21 3.22 3.23. ALMA bands in the atmospheric transmission curve on Llano Chajnantor . . . . . . . . . . . . . . . . . . . . . . . . . . . . . . . . . . . ALMA vs single dish observations . . . . . . . . . . . . . . . . . . . . K-band continuum emission as seen by SINFONI . . . . . . . . . . . ALMA continuum emission at 230 and 345 GHz . . . . . . . . . . . . CO morphology of the Antennae overlap region . . . . . . . . . . . . H2 morphology of the Antennae overlap region . . . . . . . . . . . . ALMA CO and SINFONI H2 kinematics comparison . . . . . . . . . ALMA CO and SINFONI H2 spectra for each SGMC . . . . . . . . . ALMA CO and SINFONI H2 morphology comparison . . . . . . . . Brγ morphology and kinematics . . . . . . . . . . . . . . . . . . . . . Intensity maps of SGMCs . . . . . . . . . . . . . . . . . . . . . . . . Compact molecular source PCC1 – emission profile . . . . . . . . . . Integrated SINFONI spectra for the extended emission from SGMC 2 and PCC1 . . . . . . . . . . . . . . . . . . . . . . . . . . . . . . . . . Emission line profiles of molecular and ionized gas for extended emission from SGMC 2 and PCC1 . . . . . . . . . . . . . . . . . . . . . . CRIRES high resolution H2 1 − 0 S(1) spectra of PCC1 . . . . . . . SGMC 2 position-velocity diagram . . . . . . . . . . . . . . . . . . . PCC1 at the interface of blue and redshifted gas . . . . . . . . . . .. 4.1 4.2 4.3 4.4 4.5. H2 excitation diagrams of SGMCs . . . . . . . . . . . Positions of the Spitzer FOV in the overlap region . . Spectral diagnostics: shocks vs UV-heating . . . . . . Spectral diagnostic: the H2 1 − 0 S(1)/Brγ ratio . . . H2 1 − 0/2 − 1 S(1) ratio estimated from shock models. . . . . .. . . . . .. . . . . .. . . . . .. . . . . .. . . . . .. . . . . .. 69 70 72 74 75. 6.1 6.2 6.3 6.4 6.5 6.6 6.7 6.8 6.9 6.10 6.11 6.12. SSCs within the SINFONI fields . . . . . . . . . . . . . . . H2 -to-stellar mass evolution . . . . . . . . . . . . . . . . . Brγ-to-stellar mass evolution . . . . . . . . . . . . . . . . Brγ and H2 emission profile of SSC B1 . . . . . . . . . . . K-band spectrum of SSC B1 in SGMC 4/5 . . . . . . . . CO(3 − 2) spectrum of SSC B1 . . . . . . . . . . . . . . . CO(2 − 1) spectrum of SSC B1 . . . . . . . . . . . . . . . CO velocity components in SGMC 4/5 . . . . . . . . . . . Diagram of the GMC in SGMC 4/5 . . . . . . . . . . . . . SSC B1 stellar radiation field for Rin = 30 pc . . . . . . . Grid of CO and H2 emission from the PDR Meudon code Modeling of the disruption of a molecular cloud: Pressures. . . . . . . . . . . . .. . . . . . . . . . . . .. . . . . . . . . . . . .. . . . . . . . . . . . .. . . . . . . . . . . . .. . . . . . . . . . . . .. 94 98 98 101 102 103 103 104 106 107 109 114. 7.1 7.2 7.3. Number of detected PCC-like sources . . . . . . . . . . . . . . . . . . 123 SiO intensity by MHD shock models . . . . . . . . . . . . . . . . . . 125 Zoom on the overlap region of the CFHT observations . . . . . . . . 126. 3.8 3.9 3.10 3.11 3.12 3.13 3.14 3.15 3.16 3.17 3.18 3.19 3.20. . . . . .. 50 51 52 54 55 56 57 57 59 59 60 62 62 63 64 64 65. A.1 Compact molecular source 2 – emission profile . . . . . . . . . . . . . 127.
(21) vi. List of Figures A.2 Integrated SINFONI spectra for the extended emission from SGMC 1 and PCC2 . . . . . . . . . . . . . . . . . . . . . . . . . . . . . . . . . A.3 PCC2 – H2 and Brγ spectra . . . . . . . . . . . . . . . . . . . . . . . A.4 PCC2 – H2 1 − 0 S(1) velocity map . . . . . . . . . . . . . . . . . . A.5 PCC2 – CO(3 − 2) spectrum . . . . . . . . . . . . . . . . . . . . . . A.6 SGMC 1 – two velocity components . . . . . . . . . . . . . . . . . .. 128 128 129 130 131.
(22) List of Tables 1.1 1.2. Characteristics of typical elliptical and spiral galaxies. . . . . . . . . Phases of the ISM . . . . . . . . . . . . . . . . . . . . . . . . . . . .. 4 14. 3.1 3.2 3.3. Main emission lines within the SINFONI wavelength coverage . . . . CO(3 − 2) properties of the velocity components of SGMCs . . . . . Line parameters measured from PCC1 and the extended emission from SGMC 2 . . . . . . . . . . . . . . . . . . . . . . . . . . . . . . .. 53 58. 4.1 4.2 4.3. Mid- and near-IR H ii lines properties . . . . . . . . . . . . . . . . . Linear fit of the excitation temperatures for the SGMCs . . . . . . . Extinction-independent diagnostic line values . . . . . . . . . . . . .. 69 71 71. 6.1 6.2. Properties of SSCs within the area observed with SINFONI . . . . . Characteristics of the ionized compact sources within the SINFONI fields. . . . . . . . . . . . . . . . . . . . . . . . . . . . . . . . . . . . Estimated properties of the B1 cluster in SGMC 4/5 . . . . . . . . . Line parameters measured from SSC B1 in SGMC 4/5 . . . . . . . . H ii region parameters: χ and Prad /kB . . . . . . . . . . . . . . . . . Derived values of pressures in SGMC 4/5 . . . . . . . . . . . . . . .. 96. 6.3 6.4 6.5 6.6. 63. 97 100 105 108 113. A.1 Line parameters measured for PCC2 in SGMC 1 . . . . . . . . . . . 131.
(23) Chapter 1. Introduction. Contents 1.1. Cosmological framework . . . . . . . . . . . . . . . . . . . . .. 2. 1.2. Galaxy formation and evolution . . . . . . . . . . . . . . . . .. 4. 1.2.1. Galaxies in the Universe . . . . . . . . . . . . . . . . . . . . .. 4. 1.2.2. Hierarchical model of dark matter halo collapse and galaxy evolution . . . . . . . . . . . . . . . . . . . . . . . . . . . . .. 5. 1.2.3. Hierarchical, merger-driven growth of galaxies . . . . . . . . .. 6. 1.2.4. Galaxy formation by cold accretion and ‘monolithic’ collapse of baryons . . . . . . . . . . . . . . . . . . . . . . . . . . . . .. 7. 1.3. Galaxy interactions and mergers in the local Universe . . .. 9. 1.4. The interstellar medium . . . . . . . . . . . . . . . . . . . . .. 12. 1.5. 1.6. 1.7. 1.4.1. The multiphase ISM . . . . . . . . . . . . . . . . . . . . . . .. 13. 1.4.2. Interstellar environments . . . . . . . . . . . . . . . . . . . .. 14. Star formation . . . . . . . . . . . . . . . . . . . . . . . . . . .. 20. 1.5.1. Tracing the star formation . . . . . . . . . . . . . . . . . . . .. 21. 1.5.2. Molecular gas, the fuel to form stars. . . . . . . . . . . . . . .. 21. 1.5.3. Star Formation Rate . . . . . . . . . . . . . . . . . . . . . . .. 22. 1.5.4. Overview of the star formation process . . . . . . . . . . . . .. 23. 1.5.5. Star formation efficiency . . . . . . . . . . . . . . . . . . . . .. 25. The role of turbulence . . . . . . . . . . . . . . . . . . . . . .. 26. 1.6.1. Interstellar turbulence . . . . . . . . . . . . . . . . . . . . . .. 27. 1.6.2. Turbulent energy cascade and dissipation . . . . . . . . . . .. 27. Aim and structure of this thesis. . . . . . . . . . . . . . . . .. 30. Star formation is an essential process which drives galaxy evolution (Kennicutt 1998a), and likewise, galaxy evolutionary processes determine the characteristics of star formation in galaxies. However, the physical processes that trigger and regulate the formation of stars out of the interstellar matter are not fully understood (e.g. Elmegreen 2012). Although today numerical simulations of galaxies have the resolution to resolve the size scales of star forming clouds, they remain schematic in their description of the interstellar medium physics. They cannot resolve the wide range of physical scales, densities and temperatures of the multi-phase interstellar medium. Observations must guide theoretical studies. This is the approach I have.
(24) 2. Chapter 1. Introduction. followed in my thesis work. To start, I was given spectral-imaging observations in the near-IR of the overlap region in the Antennae galaxy merger. The observations were successful, revealing unexpected results which provided me with the ingredients to focus my thesis on one main question, how do the large-scale galaxy dynamics in mergers trigger the formation of stars? Encouraged by these first results, I prepared my own observing proposals to extend my work. The ALMA observations of the Antennae carried out as part of the Science Verification gave me the opportunity to have an early access to one of the first data taken with that interferometer. I had the elements to go deeper in the study of star-formation in the Antennae galaxies and to investigate the dispersal of parent clouds by newly born super star clusters. In this manuscript, I gather the research I have done during my three years of PhD work at the IAS in Orsay. In this chapter, I give the global astrophysical context of my PhD work. A more specific introduction to my research is given in the following thesis chapters, together with the relevant parts of my work. I start in Section 1.1 with a summary of the current cosmological framework of our Universe. In Section 1.2, I summarize our knowledge of galaxies in the Universe, and present the two main theories for galaxy formation and evolution. Section 1.3 gives a view of galaxy interactions and mergers in the local Universe. A general introduction to the multiphase nature of the ISM is given in Section 1.4. Section 1.5 introduces the star formation process, its main properties and observables. In Section 1.6, I describe the role of turbulence in the interstellar medium. Finally, in Section 1.7, I describe the method which I followed in my PhD work and the structure of this manuscript.. 1.1. Cosmological framework. On the largest scales, our Universe is observed to be homogeneous and isotropic. The most accepted model to explain the origin of our Universe is the Big Bang model. It describes a Universe which originated from a dense and hot singularity in space-time, and is in expansion since then. The Big Bang accounts for three observational facts: the expansion of the Universe (first observational evidence presented by Hubble 1929), the abundance of light elements (i.e. H, He and Li, Alpher et al. 1948), and the Cosmic Microwave Background1 (CMB, first detected by Penzias & Wilson 1965). The CMB represents the surface of last scattering of photons and free electrons prior to recombination about 300,000 years after the Big Bang. It is therefore the most direct observable of the primordial density fluctuations of the Universe, from which galaxy clusters and galaxies formed. Fig. 1.1 illustrates the timeline of the Universe. Detailed studies of the CMB fluctuations also give us information about the total matter and energy content of the Universe, including in particular the dark 1 This thermal radiation is the fossil of the Big Bang. It is characterized by a black body radiation at a temperature of 2.73 K. The CMB is not completely defined by an uniform single temperature, but it presents small fluctuations of less than 1 mK, the so-called anisotropies..
(25) 1.1. Cosmological framework. 3. Figure 1.1: Timeline of the Universe, from the Big Bang (left side of the image) to the present day (right side). Our Universe originated 13.75 billion of years ago. It experienced a phase of rapid exponential acceleration and growth known as the Inflation. While the Universe expanded and cooled, elementary particles acquired mass and then combined to form hadrons (i.e. protons, neutrons). Inflation was slowed down by the gravity of the newly formed matter. After the formation of the first structures, they grew in mass in a hierarchical way by the merging of smaller structures into larger ones. Credits: NASA/WMAP Science Team.. matter2 and dark energy3 . The main results from the WMAP (Wilkinson Microwave Anisotropy Probe, Bennett et al. 2003) 7-years program infer that: the matter/energy in the Universe consists of 22.7% of Cold Dark Matter (CDM), 72.8% of Dark energy and that the remaining 4.6% is matter visible to us (baryonic matter, i.e. stars, gas, etc.), and it predicts that the Universe is not curved but flat (values taken from Tab. 8 in Jarosik et al. 2011). WMAP results support the ΛCDM model, that is the current accepted cosmological model for our Universe, which includes the presence of dark matter and dark energy. New maps of the CMB, more sensitive and at higher spatial resolution capable to probe the CMB anisotropies at much smaller scales, are expected to be released in January 2013 as part of the Planck satellite project. 2. Dark matter consists of elementary particles of so far unknown type, which interact with normal matter only through gravity. In the cosmological framework, the dark matter is needed to account for the growth of the primordial perturbations in the Universe that led to the formation of large-scale structures. 3 Dark energy is a theoretical form of energy predicted to account for observations that showed that our Universe is in accelerated expansion (e.g. deduced by measuring distances to galaxies using supernovae as candles Riess et al. 1998). It would be homogeneous in the Universe, having a gravitationally repulsive effect (negative pressure). In the cosmological framework, one way of parameterizing dark energy is by introducing a cosmological constant Λ, explaining the flatness and acceleration of the Universe. More details about dark energy can by found in the review by Frieman et al. (2008)..
(26) 4. Chapter 1. Introduction. 1.2. Galaxy formation and evolution. When we talk about galaxy evolution it is inevitable to talk about galaxy formation. These two processes are connected with the cosmological scenario, the initial conditions for galaxy formation in the Universe and the physical processes that regulate galaxy evolution.. 1.2.1. Galaxies in the Universe. Large-scale surveys of the spatial distribution of galaxies, as the Sloan Digital Sky Survey4 and the 2dF Galaxy Redshift Survey5 , revealed the large-scale structure in the Universe. Most galaxies are along relatively low-density filaments surrounding voids of sizes of hundreds of Mpc, and in high-density clusters at the junctions of these filaments (York et al. 2000; Colless et al. 2001). It is estimated that there are about 170 Billions of galaxies in the observable Universe (Gott et al. 2005). Galaxies show a wide range of morphologies, from elliptical galaxies which have a dominant spherical or ovoid bulge, spiral galaxies which present a fainter bulge, and thin and flat spiral arms, to irregular morphologies which can have different origins, for example, gravitational influence of nearby galaxies or primitive state of the galaxy formation. Table 1.1 compares the basic properties of elliptical and spiral galaxies. For instance, our galaxy the Milky Way is a barred spiral galaxy, and our neighbors the Magellanic Clouds are dwarf irregular galaxies. Fig. 1.2 shows the variety of individual galaxies in the Universe. They have been historically classified according to the Edwin Hubble galaxy morphological classification (Hubble 1926), which is shown in Fig. 1.2 with real examples of observed galaxies. Table 1.1: Characteristics of typical elliptical and spiral galaxies. Characteristic. Ellipticals. Spirals. Sizes Masses Luminosities Bulge. 1 − 150 kpc 106 − 1013 M
(27) 106 − 1012 L
(28) Prominent (old, low-mass stars) Not present Stars have radial kinematics - Gas and dust poor - Low star formation activity. 6 − 100 kpc 109 − 1012 M
(29) 108 − 1011 L
(30) Faint (old stars) Prominent (stars + gas + dust) Young stars Active star formation Rotational disk Morphologies of their bulges are similar to morphologies of ellipticals galaxies. Disk. Kinematics Others. There is evidence that galaxies are associated with extended dark-matter halos. Its presence accounts for the unseen galactic masses that several observations sug4 5. http://www.sdss.org/ http://magnum.anu.edu.au/~TDFgg/.
(31) 1.2. Galaxy formation and evolution. 5. Figure 1.2: Hubble’s classification of galaxies in the Universe. From the left, elliptical galaxies, to the right, spiral galaxies which can present or not a bar connecting the bulge and the spiral arms. Not included in this classification are the irregular galaxies, which are located on the left-bottom part of the diagram. Figure adapted from the Spitzer Infrared Nearby Galaxies Survey (SINGS) Hubble tuning fork poster.. gest, for instance observations of galaxy rotation curves (pioneering work by Rubin et al. 1980) or weak gravitational lensing in galaxy clusters (e.g. Tyson et al. 1990, or quantified by Clowe et al. 2004 for the Bullet galaxy cluster). It is now commonly accepted that galaxies, besides being constituted of their visible features, also have a massive dark matter halo that extends beyond the visible galaxy.. 1.2.2. Hierarchical model of dark matter halo collapse and galaxy evolution. The current accepted theory for the formation of dark matter halos is the hierarchical merging scenario (Lacey & Cole 1993). The formalism of a non-linear hierarchical formation of structures was first given by Press & Schechter (1974), and it has been developed, modeled and modified since then, keeping the basic formalism (e.g. White & Rees 1978; Lacey & Cole 1993; Cole et al. 2000; Bower et al. 2006). In this model, the primordial small density fluctuations are the progenitors of galaxies. The model predicts that these density perturbations, dominated by dark matter, collapsed to form small virialized dark matter halos. Halos grow gradually, ‘hierarchically’, through the merging of smaller halos. Fig. 1.3 shows a diagram of this merger-tree model also called the ‘bottom-up’ model (Lacey & Cole 1993). In this diagram, each branch represents a dark matter halo. Time evolves from the top to the bottom of the image, while the widths of the branches represent the masses of the halos. Numerical simulations of large numbers of dark matter halos broadly agree with the observed distribution of galaxies revealed by the previously.
(32) 6. Chapter 1. Introduction. mentioned surveys.. Figure 1.3: Diagram of the hierarchical merger of dark matter halos scenario. This model predicts that small halos of dark matter interact and merge into larger halos, in a hierarchical way. Figure extracted from Lacey & Cole (1993, their Fig. 6). There is a clear difficulty to translate the dark matter collapse into a robust model of galaxy formation and evolution. Simulations of dark matter are relatively far advanced. The problem lies in the modeling of the baryonic matter. Such models must cover realistic ranges of sizes, gas densities and temperatures, and accurate physical descriptions of gas cooling and heating, subsequent star formation, dust, etc. This is beyond current computational limitations. Moreover, many of these processes are not yet understood. As a consequence, all of the simulations make simplistic assumptions and/or rely on empirical relationships without clear physical interpretation. For example, in my thesis I would like to understand how galaxy mergers trigger star formation. Detailed numerical simulations of the Antennae merger exist (e.g. Bournaud et al. 2008; Teyssier et al. 2010), but they must be compared and guided by high angular resolution observations where we can resolve (at scales of a few tens of parsecs) the star formation process. In the following two sections, I describe the two major groups of models to account for the growth of galaxies, (1) hierarchical, merger-driven growth, and (2) galaxy growth through rapid ‘monolithic’ collapse or cold accretion of gas onto galaxies leading to a single, intense burst of star formation.. 1.2.3. Hierarchical, merger-driven growth of galaxies. As its name indicates, in this theory mergers are the most important phenomenon. Within the framework of the ΛCDM model and the hierarchical merger formation of dark matter halos, this theory is the standard and natural model for galaxy formation. In the theory of hierarchical merging as driver of galaxy formation and evolution, baryons follow the fate of the dark matter halos, connecting the galaxy formation.
(33) 1.2. Galaxy formation and evolution. 7. process with the hierarchical scenario. First, galaxies, each tracing their own dark matter halo, would form within the merger-tree model for dark matter introduced before (Kauffmann et al. 1993). The primordial Gaussian density fluctuations presented in the CMB were constituted by a mixture of dark matter and primordial gas (light elements produced in the Big Bang). When virialized dark matter halos form, the gas within them collapses, accumulates and condenses in their centers to form the visible counterparts of the dark matter halos, galaxies and stars (see for instance Cole et al. 2000). Therefore, galaxies are the result of the primordial quantum fluctuations. While dark matter halos were merging, their host galaxies could also interact and merge. It is in this way how the hierarchical growing of dark matter halos is extended to their host galaxies. Hierarchical merging explains the formation of elliptical galaxies. However, it predicts too many dwarf galaxies (Moore et al. 1999) and cannot account for the observed number of spiral galaxies (Steinmetz & Navarro 2002). Major mergers (Section 1.3) are violent, destroying the disks of the collapsing galaxies, leading to the formation of elliptical galaxies. There is also a problem with the star formation rate of galaxies. The hierarchical model predicts a gradual star formation, but recent observations have shown that massive galaxies in the early Universe have high star formation rates (Smail et al. 2004), with very little star formation over the last 10 Gyr. Many researchers believe now that this is the result of heating by energy released during the accretion of matter onto supermassive black holes (active galactic nuclei feedback, e.g. Croton et al. 2006). However, more subtle difficulties with our understanding of gas cooling are not ruled out (Birnboim et al. 2007).. 1.2.4. Galaxy formation by cold accretion and ‘monolithic’ collapse of baryons. An alternative to the ‘bottom-up’ approach given above is quantified by models where galaxies formed most of their mass in a single giant star-forming event triggered by rapid gas infall. Such a scenario of ‘monolithic’ collapse was first proposed to explain the formation of our own galaxy. Eggen et al. (1962) proposed that the monolithic collapse of gas of a proto-galactic cloud yields the observed characteristics of the Milky Way, these are the bulge, disk and halo, where the halo was formed in the initial phase of the collapse. However, it was later disfavored since its predictions did not match with observations of velocities of halo stars and globular clusters (Searle & Zinn 1978), and the relatively young ages of disk stars. In the past few years, the basic idea behind the ‘monolithic’ collapse scenario has become more popular again, challenging at least one aspect of the hierarchical model, the preponderance of major galaxy mergers in driving the formation and evolution of galaxies. Dekel et al. (2009) argue that the collapse of cold gas through narrow, dense streams within the dark matter halos onto forming galaxies could be the main mechanism of how galaxies form in the early Universe. Cold accretion models de-emphazise the role of mergers for early galaxy growth. Dark matter halos are distributed along large-scale dark matter filaments. These.
(34) 8. Chapter 1. Introduction. filaments trigger shocks in the gas falling from the periphery to the central regions of massive dark matter halos. The gas is heated by these shocks producing an internal energy that balances gravity, the gas is in virial equilibrium with the dark matter. In the standard hierarchical model, if the gas falls onto halos above a certain mass, it will not be able to cool rapidly enough to be available as new ‘fuel’ for star formation in the central galaxy (White & Rees 1978). However, motivated by the results of high-resolution hydrodynamical simulations (Kereš et al. 2005), modelers believe that accretion occurs through filaments, where the enhanced density allows the gas to cool faster. This may allow gas to cool and thereby be accreted onto the forming galaxy. The predicted outcome are immerse narrow streams of cold gas fueling intense star formation in high redshift galaxies. Figure 1.4 displays an illustration of this scenario. The colors refer to the inflow rate per solid angle. The low-flux medium in the dark matter halo is penetrated by three cold, narrow, dense streams, which converge radially at the center of the halo.. Figure 1.4: MareNostrum simulation of a monolithic collapse of the gas within a dark matter halo. The figure illustrates a 3-D view of the galaxy formation. The colors correspond to the inflow rate per solid angle of point-like tracers at the centers of cubic-grid cells. The white dashed-circle delimits the virial mass of the halo. In this simulation, three cold, narrow streams are radially penetrating the dark matter halo. The galaxy will form at the center of the halo. Figure extracted from Dekel et al. (2009, their Fig. 2).. This scenario de-emphasizes the role of mergers between galaxies of comparable sizes (major mergers, see Section 1.3) in the formation of massive galaxies at high redshift. Gas clumps falling along filaments resemble minor mergers (see Section 1.3). Encouraged by the results of Dekel et al. (2009), modelers and observers have proposed that the irregular, clumpy morphologies of many highredshift galaxies may be explained by fragmentation of intensely star-forming, rapidly accreting, and very gas-rich disks in the early Universe (e.g. Bournaud et al. 2008). This would be an alternative of considering clumpiness as a sign of merger activity, although both are difficult to distinguish observationally (Robertson et al..
(35) 1.3. Galaxy interactions and mergers in the local Universe. 9. 2006). However, by itself, the cold accretion model of Dekel et al. (2009) does not reproduce the early presence of galaxies with low star formation rate. It also requires either implausibly high gas accretion rates or star-formation efficiencies that are near 100%, about two orders of magnitude greater than what is found locally (Section 1.3).. 1.3. Galaxy interactions and mergers in the local Universe. As I just discussed previously, it is not so clear anymore whether galaxy mergers are the only mechanism that shapes galaxies in the early Universe. However, what is certain is that mergers are a common phenomenon in the nearby Universe and play a large role in determining the morphologies of galaxies and the properties of their stellar populations along the Hubble sequence, in particular in early-type galaxies. Moreover, ‘pair studies’, surveys of close galaxy pairs seen in projection, suggest that the number of mergers increases with increasing redshift out to at least z ∼ 1 (Le Fèvre et al. 2000; Conselice et al. 2003; de Ravel et al. 2009; Darg et al. 2010). Interacting galaxies with moderate relative velocities, where the kinetic energy does not exceed the binding energy, will finally merge, after orbiting around each other several times. Dynamical friction, tidal forces, and dissipation of kinetic energy in the gas of the two galaxies will make them lose more and more kinetic energy with each orbit, until they fall to the center of the gravitational potential and coalesce. Depending on the merger configuration, the total merger time is likely to be few 100 Myr, and up to about 1 Gyr (e.g. Di Matteo et al. 2008). In the local Universe, there are many examples of galaxy interactions that have been observed at high angular resolution, e.g., with the Hubble Space Telescope (HST), like the Antennae or the “Mice” galaxies (see Figure 1.5). Efforts to associate individual galaxy mergers with a given merger stage from the first encounter to the final coalescence date back to Toomre & Toomre (1972) and Toomre & Toomre (1977). The Milky Way is currently undergoing several mergers. The Leading Arm Feature observed on the Southern hemisphere is perhaps the most prominent feature showing that the Milky Way will ultimately swallow its two low-mass companions, the Magellanic Clouds (Putman et al. 1998). In the local Universe, there are famous galaxies used as prototypical examples, where it is possible to study the gas and dust morphology and kinematics. Probably the best studied merger in the nearby Universe are the Antennae galaxies, NGC 4038 and NGC 4039, at 22 Mpc, which are still in an early merger state. My thesis work is based on this merger. Based on the masses of the interacting galaxies mergers are commonly split into two regimes. Major mergers involve two roughly equal-mass galaxies, where the galaxy mass ratio ranges from 1:1 to 1:3. Major mergers change the morphology and subsequent evolution of galaxies most strongly, in particular if the two merging galaxies are gas-rich. In addition to galaxy mass, other parameters, for example.
(36) 10. Chapter 1. Introduction. Figure 1.5: Examples of interacting galaxies in the local Universe, observed by the Hubble Space Telescope. Merger and interacting galaxies can be found at different stages from early encounters, where the two galaxies can be easily resolved, to more evolved merging. Credits. Stephan’s Quintet: NASA, ESO and the Hubble SM4 ERO Team. Tadpole galaxy: NASA, H. Ford (JHU), G. Illingworth (UCSC/LO), M.Clampin (STScI), G. Hartig (STScI), the ACS Science Team, and ESA. NGC 3256: NASA, ESA, the Hubble Heritage (STScI/AURA)-ESA/Hubble Collaboration, and A. Evans. Mice galaxies: NASA, H. Ford (JHU), G. Illingworth (UCSC/LO), M.Clampin (STScI), G. Hartig (STScI), the ACS Science Team, and ESA. NGC 2207/IC2163: NASA and The Hubble Heritage Team (STScI). NGC 2623: NASA, ESA and A. Evans.. the orientation of the galaxy rotation relative to the merger orbit, play a role (e.g. Di Matteo et al. 2008). “Pro-grade” mergers where the galaxy rotation and merger orbital axis are aligned, are most effective, because a given part of each galaxy will be strongly influenced by the merger for a longer time-scale. The remnant of a major merger of two gas-rich galaxies is an elliptical galaxy (e.g. Barnes & Hernquist 1991). In the standard merger scenario, most of the gas in the two merging galaxies will either be consumed by star formation or removed from the galaxy through galactic superwinds driven by star formation or active galactic nuclei (AGNs), so that the merger remnant is not expected to show much star formation afterwards (e.g. Hopkins et al. 2006). In minor mergers, one galaxy is considerably less massive that the other. Typical ranges are from 1:3 to 1:10. During the merger, the less massive galaxy will be ‘swallowed’ by the more massive galaxy, in a process similar to the satellite accretion scenario proposed for galaxy formation (Searle & Zinn 1978). Extended low surfacebrightness tails around nearby galaxies show that the lower-mass galaxies can be entirely disrupted during the interaction, whereas the more massive galaxy remains almost unchanged (e.g., NGC 5907, Martínez-Delgado et al. 2008). The Magellanic clouds are an example of two irregular dwarf galaxies being accreted onto the Milky Way, and surveys including the Sloan Digital Sky Survey have revealed multiple almost fully disrupted satellite galaxies of the Milky Way (e.g. Belokurov et al..
(37) 1.3. Galaxy interactions and mergers in the local Universe. 11. 2007). Some scientists suggest that stars in the halo of the Milky Way could be made almost entirely from such satellite galaxies, whereas others suspect that at least some globular clusters in the Milky Way may be the remnants of satellite galaxies accreted early on (e.g. Lee et al. 1999). Phases of rapid accretion of multiple satellite galaxies have recently been suggested to form the extended low-surface brightness envelopes around massive elliptical galaxies, and to cause several other structural parameters of these galaxies (Johansson et al. 2009). Galaxy interactions and mergers of gas-rich galaxies are often associated with high infrared luminosities (Sanders & Mirabel 1996) from dust heated by star formation. They can build more massive galaxies, and trigger bursts of star formation (Mihos & Hernquist 1996) and/or non-thermal nuclear activity (AGN, Springel et al. 2005). Infrared observations performed by IRAS (Infrared Astronomical Satellite, launched in 1983), revealed the presence of ∼75000 starburst galaxies6 , which are defined by their high star formation rates (SFR). For instance, the Milky Way has a moderate SFR of ∼1 M
(38) yr−1 (Robitaille & Whitney 2010). In starburst galaxies, the SFR goes from a few to about a thousand times the Galactic value (Kennicutt 1998b). Depending on their far-IR luminosities, such galaxies are referred to as LIRGs (luminous infrared galaxies, with LFIR of-order 1010 L
(39) , or ULIRGs (ultraluminous infrared galaxies, LFIR > 1011 L
(40) ). In these galaxies, the formation of stars is triggered by the condensation of a large amount of cold molecular gas which, in most cases, is likely to be driven by the interaction of galaxies that perturbs the gravitational potential of the merging galaxies, leading to the collapse of the required immense amount of gas to fuel the star formation. First numerical simulations of gas-rich mergers tried to reproduce the morphologies of the mergers, going back to the successful modeling of the tidal arms of the Antennae merger through Toomre & Toomre (1972). However, they did not have the computational power to include the effects of gas, which unlike the stars rapidly dissipates kinetic energy and therefore responds most strongly to the merger. This was only done by Barnes & Hernquist (1991) who modeled the collision between two gas-rich galaxies. Tidal forces produce not only extended tails of stars and gas, but also drive gas flows inwards producing nuclear starbursts, in a time scale of ∼100 Myr. This nuclear emission may account for the most luminous IR galaxies in the local and distant Universe. Later, the ISO (Infrared Space Observatory, launched in 1995) with much higher resolution and sensitivity, provided observations of starburst galaxies with much more details. The study of the star formation process in galaxies, and in particular in starbursts, provide the evidence of their evolution. In the following of this Chapter, I focus on the star formation process. I start by describing the medium from where stars form, the interstellar medium. 6 Most of the observed starburst galaxies are mergers. Individual galaxies with a high star formation rates are also observed, but their number and IR luminosity are lower than those of mergers..
(41) 12. 1.4. Chapter 1. Introduction. The interstellar medium. The matter between stars in galaxies, the interstellar medium (ISM), links stellar and galactic scales. The ISM rules the life cycle of stars, connecting their birth and death. Stars form out of this matter and, when they die, they return their processed matter to the ISM. The ISM is best quantified in our Galaxy. Its mass is composed by 99% of gas and 1% of dust. In turn, the most abundant gas element is hydrogen (∼ 89%) followed by helium (∼ 9%). The remaining 2%, is composed by heavier elements, the so-called metals. Even though its mass corresponds to only 10% of the stellar mass in the Milky Way, the ISM is crucial for star formation and galaxy evolution because it is the matter from which new stars form.. Figure 1.6: The galactic interstellar medium. The image corresponds to the central part of our Milky Way in the constellation of Sagittarius, observed in the optical. This image illustrates the richness of the ISM. The main feature is the dust lane which runs obliquely through the image. The bright source to the right is the Rho Ophiuchi cloud complex, a star-forming region. Credit Image: ESO/S Guisard.. We observe the ISM through gas emission and absorption lines. These lines give us information on the gas kinematics, and physical conditions such as density, temperature and pressure. The first evidence of the presence of dust in the ISM in our Milky Way came from observations of open star clusters that indicated reddening and absorption of the light (Trumpler 1930). Today, powerful telescopes at all wavelengths, the modeling of interstellar processes and numerical simulations, shape our current picture of the ISM. In this section, I describe the characteristics of the ISM as we understand it today..
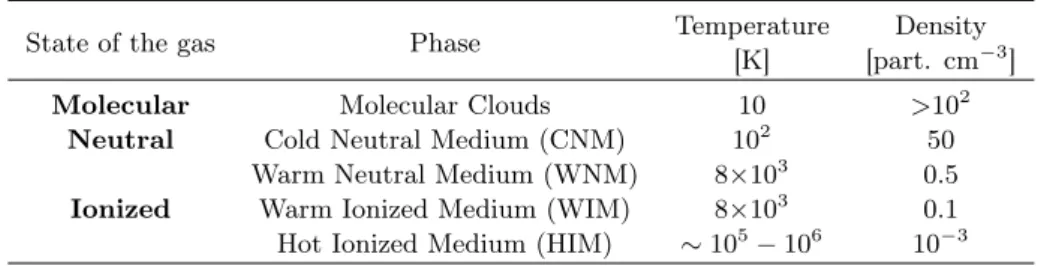
(42) 1.4. The interstellar medium. 1.4.1. 13. The multiphase ISM. Field et al. (1969) suggested that the gas in the ISM could be found in two stable phases in pressure equilibrium, cold clouds and warm gas. This theory evolved to the current multiphase ISM theory (McKee & Ostriker 1977; Burkert & Lin 2000), in which interstellar gas is distributed over a wide range of temperatures with a mean pressure Peq /kB of a few 103 K cm−3 . Figure 1.7 illustrates the three-phase model of the ISM proposed by McKee & Ostriker (1977). In this model the cold, warm and hot phases are in pressure equilibrium. Numerical simulations have since quantified a dynamical view of the ISM including turbulent cycling of matter between gas phases (de Avillez & Breitschwerdt 2005).. Figure 1.7: This figure illustrates the three-phase ISM model of McKee & Ostriker (1977, their Figure 1). The left panel zooms on a cloud, embedded in the hot plasma produced by supernova explosions. The cold neutral medium (CNM) at the center of the cloud is surrounded by layers of warm neutral and ionized medium (WNM and WIM). The right panel gives a more extended view of a supernova blast wave impacting interstellar clouds.. The ISM is classified according to the state of its most abundant element – molecular, atomic and ionized state – , hydrogen (H), which depends on the gas temperature and density. Table 1.2 summarizes the characteristics of the different phases of the ISM (adapted from Table 1.1 in Tielens 2005). Molecular gas is mainly found in molecular clouds, which have low temperatures and high densities (see Table 1.2). It is the densest and coldest phase of the ISM. Interstellar chemistry leads to the formation of diverse sets of molecules, with CO being the most abundant after H2 . The distribution of molecular gas in galaxies is typically traced through CO transition lines and dust far-IR emission. The neutral gas consists of atoms, essentially neutral hydrogen H i. It is traced by the hyperfine transition of the hydrogen at λ = 21 cm7 , in absorption or emission. There are two thermally stable phases in the neutral gas, cold neutral medium (CNM) 7. This line emission is created by the transition of two hyperfine levels of H..
(43) 14. Chapter 1. Introduction. and warm neutral medium (WNM). The gas temperature and density of these two phases vary by about two orders of magnitude (Table 1.2). While the molecular gas is confined in molecular clouds, the neutral gas emission is much more diffuse and extended across galaxies. The ionized gas is much lighter than the molecular and neutral gas. It presents temperatures high enough to convert the gas into a plasma formed by protons and electrons (i.e. ionized hydrogen H ii). The typical tracers of the ionized gas are the hydrogen recombination lines, such as Hα or Brγ, the thermal free-free radio emission and X-rays. The ionized gas can be classified according to the gas temperature and density in two phases, warm ionized medium (WIM) and hot ionized medium (HIM). The hot ionized gas is produced in high velocity shocks driven by supernovae explosions and stellar winds, and also at larger scales in galaxy interactions. The warm ionized medium is generally found surrounding massive and young stars (O or B type), but it also extends to a thick disk component in disk galaxies. Table 1.2: Characteristics of the phases of the ISM. Adapted from Tielens (2005).. State of the gas. Phase. Temperature [K]. Density [part. cm−3 ]. Molecular Neutral. Molecular Clouds Cold Neutral Medium (CNM) Warm Neutral Medium (WNM) Warm Ionized Medium (WIM) Hot Ionized Medium (HIM). 10 102 8×10³ 8×10³ ∼ 105 − 106. >102 50 0.5 0.1 10−3. Ionized. Numerical simulations on the scales of galaxies are now including the multiphase ISM. However, this is a computational challenge due to the amount of processes that shape it and regulate its energetics. Our observational knowledge has grown from the Milky Way to nearby galaxies and is moving into the interpretation of observations of distant galaxies.. 1.4.2. Interstellar environments. The ISM is complex. To model the observations and quantify physical processes, we need to introduce simplified descriptions of interstellar environments. In this section, I detail the two environments, PDRs and shocks, to which I will refer in my thesis work. For each of them, I describe the mechanism of excitation of the H2 molecule. 1.4.2.1. Massive star forming regions. In the following, I describe the different components of massive star forming regions. a. Molecular Clouds. They are concentrations of dense molecular gas and dust, associated with dark nebulae. They have a wide range of sizes, starting from.
(44) 1.4. The interstellar medium. 15. ∼ 10 pc, to Giant Molecular Clouds (GMC) with sizes up to ∼ 100 pc. Dense cores within molecular clouds have sizes ∼ 1 pc, densities of 104 cm−3 and masses of 10−103 M
(45) . These cores are the potential sites of star formation in molecular clouds (see Section 1.5 for a more extended view of the star formation process). In the simplistic picture, molecular clouds are assumed to be spherical or ovoidal. In reality, observations in the Milky Way have shown that they can have diverse morphologies. Since we cannot resolve the internal structures of extragalactic molecular clouds, the galactic view is normally extrapolated to these galaxies. Recent observations obtained with the Herschel Space Observatory have revealed the filamentary structure of the star forming regions. The internal structure of molecular clouds is filamentary, where star formation occurs only in the densest parts (e.g. Könyves et al. 2010 in the Aquila cloud and Arzoumanian et al. 2011 for the IC 5146 cloud). b. Photodissociation Regions (PDRs). PDRs are created on the surface of molecular clouds where they are exposed to far-UV radiation. In these regions the physics and chemistry of the gas are driven by the interaction of matter with far-UV photons. Since PDRs are the interface between the molecular and ionized gas they are composed by a mix of neutral and ionized atoms, and molecules (Fig. 1.8). The transitions from H to H2 and from C+ to CO take place within PDRs. The depth at which these transitions occur, depends on the radiation field (UV-photons) and the gas density. Models quantify physical and chemical processes in PDRs. The comparison of observed gas line emission from PDRs with model results yields constraints on physical parameters. The typical tracers of PDRs are the fine-structure lines of [C ii] (at 158µm) and [O i] (at 63 and 145µm), and the far-IR continuum emission from dust. In the Milky Way, the spatial structure of PDRs is resolved. For instance, in the two prototypical PDRs, the Orion bar and the Horsehead mane (Pety et al. 2008). Arab et al. (2012) present Herschel observations of the Orion Bar, at an angular resolution of 0.00 05 pc, where they spatially resolve the PDR and its various components. The Horsehead nebula has also been observed at several molecular transitions, which allowed to describe in detail its structure (i.e. Gerin et al. 2009). In extragalactic molecular clouds, we cannot observe the structure of PDRs, and even more it is very difficult (if not impossible for more distant galaxies) to isolate them from the molecular clouds. c. H ii Regions. When massive stars are formed in molecular clouds, their UV emission starts heating and ionizing its surrounding cloud creating a region where the hydrogen is fully ionized. Initially, H ii regions are compact and dense (∼ 0.5 pc, 103 − 104 cm−3 ). Due to their high pressure they expand into diffuse extended H ii regions. H ii regions are mainly traced by thermal radio emission, and hydrogen recombination lines. Theoretically, the sizes of H ii regions are defined by the Strömgren sphere, which is determined by the balance between the number of recombinations and ionizations in the simple case where the gas.
(46) 16. Chapter 1. Introduction density is uniform.. Figure 1.8: a) The H ii region corresponds to the blue area and the molecular cloud to the pink area. The PDR is the interface between them and here it is illustrated as different layers which are defined by the elements transitions. Note: Diagram not scaled. b) The Orion Nebula. The left panel displays the whole nebula as seen by the Hubble Space Telescope. The picture in the right panel was obtained with the near-IR camera ISAAC at the VLT, and it zooms the central part of the nebula where the Trapezium stellar cluster is ionizing its surrounding. (Image credits. Left: NASA,ESA, M. Robberto (STSI/ESA) and the HST Orion Treasury Project Team Hubble. Right: McCaugrean, Alves, Zinnecker, Palla).. Fig. 1.8a displays a simple 1-D diagram that explains the link between molecular clouds, PDRs and H ii regions. The H ii region corresponds to the blue area in which the hydrogen is ionized by the stellar UV radiation. The density of the gas and the strength of the stellar radiation will define the extent of the H ii region. The PDR corresponds to the interface between the H ii region and the molecular cloud. At the ionizing front the PDR starts. This region can be decomposed in several layers that limit the dissociation and/or ionization of the different elements. These processes depend on the photon energy. In Fig. 1.8a, the color boxes represent the transitions between the elements. In orange the transition from neutral to molecular hydrogen (∼ 102 K), in green the triple transition from ionized to neutral carbon and from neutral carbon to CO (at several tens of K) and in yellow from neutral to molecular oxygen (at a few tens of K). Fig. 1.8b shows a well known Galactic PDR, the Orion.
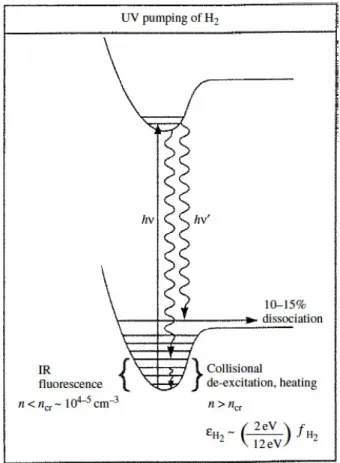
(47) 1.4. The interstellar medium. 17. Nebula. In the left, the Orion Nebula observed with the HST. In the right, an IR image obtained with the Very Large Telescope that zooms onto the central part of the nebula, where the Trapezium open star cluster is observed. In this diagram, I highlighted this ionizing cluster, and one of the multiple PDRs that are found in this region, the Orion Bar. This is a beautiful example where all the components, H ii region, PDR and molecular cloud, can be isolated. How is H2 excited in PDRs? Where the molecular gas is exposed to UV radiation, the low J levels of the ground vibrational state of H2 are excited by collisions, but the H2 vibrational states are populated by a fluorescent cascade following UV pumping to an electronic excited state (e.g. Sternberg & Dalgarno 1989). Figure 1.9 illustrates the UV pumping of the H2 molecule. The H2 molecules absorb UV photons in the Lyman and Werner bands, with energies in the range hν = 11.2−13.6 eV. This absorption produces the electronic excitation of the molecule. The excited state of H2 will rapidly decay with two possible consequences: in ∼ 10% of the cases, the decay leads to the dissociation of the molecule, while in ∼ 90% of the cases the molecule decays into bound ro-vibrational levels of the ground electronic state (Black & Dalgarno 1976; Black & van Dishoeck 1987). PDR models quantify the H2 line intensities based on this physics.. Figure 1.9: Diagram illustrating the UV pumping of the H2 molecule. From Tielens (2005)..
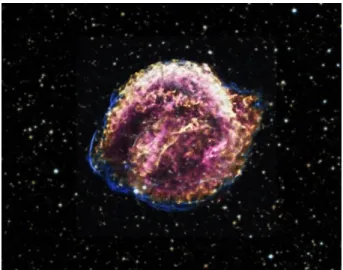
(48) 18 1.4.2.2. Chapter 1. Introduction Shocks. A shock occurs when gas moves with a velocity higher than the speed of sound in the surrounding medium. For example, this occurs after a supernova explosion (see Figure 1.10). The high pressure region created by the explosion expands supersonically into the ISM. Shocks are also present in wind-blown bubbles and in the early expansion of H ii regions.. Figure 1.10: Kepler’s supernova remnant. Composite image in the X-ray and optical regions of the electromagnetic spectrum obtained with the Chandra X-ray Observatory and the Digitized Sky Survey, respectively. The X-ray emission shows the very hot gas particles with very high energy. Credits Image: X-ray: NASA/CXC/SAO/D.Patnaude, Optical: DSS.. Shocks are created by supersonic turbulent motions over a range of scales in molecular clouds (see Section 1.6.1). In these shocks, the gas kinetic energy is dissipated into heat. The heated gas can radiate away this energy. The chemistry of the gas is also affected by the shock. In the Milky Way, emission associated with shocked gas can clearly be identified in Supernova Remnants (SNR) and the environments of young stellar objects (YSOs). These objects are used as template sources to model interstellar shocks. Two main types of shocks are considered, depending on the strength of the magnetic field. When the shock velocity is larger than the magneto-sonic velocity, the kinetic energy is dissipated viscously in a very sharp velocity jump. These shocks are called J (jump) type shocks. For lower shock velocities the kinetic energy is gradually dissipated into heat through ion-neutral friction (e.g. Lesaffre et al. 2013). These shocks are called C (continuum) type shocks. The structure of a C-shock wave (temperature and velocity) is described in Figure 1.11. The post-shock temperature depends on the shock velocity. Shocks with velocities larger than 50 km s−1 ionize the pre-shock gas. For shocks in molecular clouds, the observations may be accounted for with lower velocity shocks where the H2 molecule is not dissociated and is the main cooling agent. The H2 lines are thus the main tracer of the kinetic energy dissipated in shocks within molecular clouds..
(49) 1.4. The interstellar medium. 19. Figure 1.11: Temperature (upper panel) and velocity (lower panel) profiles through a C-type shock wave of speed vshock = 50 km s−1 , pre-shock density nH ' n(H) + 2n(H2 ) = 104 cm−3 and magnetic induction B = 100 µG. The x-axis t correspond to the flow time of the neutral fluid. The subscripts i, n and e stand for ion, neutral and electrons. Taken from Fig. 2 in Flower & Pineau des Forêts (2003).. The contribution of other species to the gas cooling depends on the gas composition (see Figure 1.12). The models take into account the detailed molecular chemistry occurring across the shock. The erosion of grain mantles and relative motions between ionized and neutral species enhances the abundance of some specific molecules. For example, SiO and HNCO are complementary tracers of shocks in molecular clouds. Fast (vshock >15 km s−1 ) shocks can destroy the grain cores, liberating refractory elements to the gas phase such as Si to form SiO, while slow (vshock <15 km s−1 ) shocks can process the icy grain mantles, releasing molecules formed on grains such as H2 CO, CH3 OH and HNCO (Flower & Pineau des Forêts 2003). In shocks, all levels of H2 are excited by collisions. However, the interpretation of the H2 excitation diagram is not simple because the gas temperature varies across.
Figure
+7


Documents relatifs
Lorsque l’on prélève le cœur d’une grenouille, celui-ci peut continuer à battre plusieurs minutes lorsqu’il est placé dans un liquide convenable (automatisme cardiaque). Loewi
If the most skilled workers generally perform non- routine cognitive tasks and the least skilled workers perform manual non-routine tasks, employment polarization corresponds to
Materials and methods All surgeons participating in a prospective Swiss multicentric surveillance program for SSIs received a questionnaire developed from the 2008 National
The recurrence risk of bipolar disor- ders (0.40 episodes per year) was about twice that of de- pression (0.20 episodes per year); BP-II disorders had only a slightly
[r]
— De puis quelques jours, tous les Arabes de la ville de Tripoli sont obligés de fermer leurs magasins deux heures avant le coucher du soleil, pour aller \
We present the results of a directed search for continuous gravitational waves from unknown, isolated neutron stars in the Galactic center region, performed on two years of data
soudées soumises à un chargement statique suivant la traction, la flexion dans le plan, la flexion hors du plan et la combinaison : traction/flexion dans le plan et
