Publisher’s version / Version de l'éditeur:
Canadian Geotechnical Journal, 11, 3, pp. 323-338, 1974-08
READ THESE TERMS AND CONDITIONS CAREFULLY BEFORE USING THIS WEBSITE. https://nrc-publications.canada.ca/eng/copyright
Vous avez des questions? Nous pouvons vous aider. Pour communiquer directement avec un auteur, consultez la
première page de la revue dans laquelle son article a été publié afin de trouver ses coordonnées. Si vous n’arrivez pas à les repérer, communiquez avec nous à [email protected].
Questions? Contact the NRC Publications Archive team at
[email protected]. If you wish to email the authors directly, please see the first page of the publication for their contact information.
NRC Publications Archive
Archives des publications du CNRC
This publication could be one of several versions: author’s original, accepted manuscript or the publisher’s version. / La version de cette publication peut être l’une des suivantes : la version prépublication de l’auteur, la version acceptée du manuscrit ou la version de l’éditeur.
Access and use of this website and the material on it are subject to the Terms and Conditions set forth at
Uplift forces on foundations in frost heaving soils
Penner, E.
https://publications-cnrc.canada.ca/fra/droits
L’accès à ce site Web et l’utilisation de son contenu sont assujettis aux conditions présentées dans le site LISEZ CES CONDITIONS ATTENTIVEMENT AVANT D’UTILISER CE SITE WEB.
NRC Publications Record / Notice d'Archives des publications de CNRC:
https://nrc-publications.canada.ca/eng/view/object/?id=d70d0c3d-0de0-44c4-8128-11d6b1d77695 https://publications-cnrc.canada.ca/fra/voir/objet/?id=d70d0c3d-0de0-44c4-8128-11d6b1d77695
Canadian
Geotechnical
Journal
Revue
*L$ r,: 3"..""
&.@$ < ~-.:-
canadienne d e
geotechnique
Prrblislred by Prrblie'e par
THE NATIONAL RESEARCH COUNCIL OF CANADA LE CONSEIL NATIONAL DE RECHERCHES DU CANADA
Volume 11 Number 3 August 1974 Volume I1 numCro 3 aoGt 1974
Uplift Forces on Foundations in Frost Heaving Soils
EDWARD P E N N E R
Geotc~chtricrrlSectior~, Divisiot~ ofl31lildit1g Resenrch. NrrtiorrrrlResc~~rch Corrt~cilof Cntlrrdrr, Otto,clrr, C~rtlccclrr KIA OR6 Received November 29, 1973
Accepted February 21, 1974
Field studies of uplift Forces by frost heaving are described for columns of various types and sizes and f o r a block concrete wall. The changing ground surface heave pattern around the block wall was used to predict the maximum heaving force which compared favor- ably with the measured value.
Unit adfreeze strengths and maximum ~ ~ p l i f t forces were highest for steel columns,
followed by concrete and wood; the lowest values were for the block concrete wall. In
general, unit adfreeze strengths were highest for the small diameter columns and lowest on the largest columns. Differences are ascribed to the response of the various materials to air temperatures and to the shape and size of the structure.
L'auteur dCcrit des Ctudes sur place des forces d e soul2vement dues au gel relativement i divers types cle poteaux de diffCrentes dimensions et i un m u r de blocs de beton. Les
variations de soulkvement d u sol nature1 autour du mur d e blocs servent B prCdire la
force de soulkvement niaximale, celle-ci Ctant assez rapprochte d e la valeur mesurte. Pour ce qui est de la rksistance unitaire en adhCrence d e la glace et des forces d e soul6vement nlaxiniales, les poteaux d'acier prbsentent les valeurs les plus ClevCes, suivis des poteaux de biton et d e bois; le mur de blocs de bCton produit les valeurs les plus faibles. L a resistance en adhCrence de la glace est gCntralement plus ClevCe pour les poteaux de moindre diamktre et plus faible pour les poteaux plus larges. On attribue ces diffCrences $ l'effet de la tempCrature d e l'air sur les materiaux ainsi qu'k la forme et aux dimensions de In construction.
Vertical displacemcnt of foundations in sea- sonal frost areas is a common occurrence where the soils are frost susceptible. Placing footings below the depth of frost penetration does not necessarily protect foundation struc- tures from heaving unless adfreezing of the soil to the structure is prevented or the load on the structure exceeds the maximum uplift forces.
Uplift in frost-susceptible soils resulting from adfreezing is a serious stability problem for some types of transmission towers, utility poles for telephone and power lines, trans-
former and distribution station structures, and
unheated building foundations. Relatively few studies related to this problem, however, ap- pear in the literature.
Crory and Reed ( 1965) and Vialov ( 1959) have shown the uplift forccs to be substantial in the active layer of permafrost regions. Tsytovich et al. (1959) and Saltykov (1944) have studied some aspects of the problem in areas of seasonal frost in the U.S.S.R. The early work of Trow (1955) is well known in Canada as is the work of Kinoshita and Ono (1963) that was carried out in Japan.
324 CAN. GEOTECH. The Division of Building Research has in- vestigated and publishcd results on various aspects of the uplift problem in the field due to f r o ~ t heaving. The initial paper (Penner and Irwin 1969) was concerncd with measured uplift forces duc to adfreezing on small diam- eter steel piles; in a second paper (Penner and Gold 1971 ) uplift forces werc compared be-
tween small diametcr wood, concrete, and steel columns.
The objective of the work reported in this paper waq to determine the influence of column diameter on uplift forec and adfreeze strength for the three conl~nonly used foundation ma- terials, wood, concrctc, and steel. A study of a block concrete wall, more completc than was described carlicr (Penncr and Gold 1971 ), it is also included. Special attcntion is givcn to the ground surface deformation around different structures. The heave defor- mation pattern is disci~sscd in some detail and a method of calculating uplift forccs on the foi~ndation wall from the heavc pattern is given.
All the studies refcrred to were carried out in Ottawa on the same site. Adfreezc uplift forces, however, are known to be influenced by climate and soil type. Studies similar to those discussed here are at present underway at Thompson, Manitoba, to obtain more de- tailed information on this point.
Uplift Forces by Adfreezing
Vertical displacement of foundation struc- tures in frost-susccptible soil occurs because the wet soil frcezcs to the below-ground por- tion of the foundation within thc frozen layer. Ice Icnsing, the cause of frost heaving, at the frozen-unfrozen ground boundary lifts struc- tures embedded in the frozen layer unless special precautions are taken to prevent move- ment. When the structure is rigidly fixed so that uplift is prevented the heaving soil imposes maximum forces on thc foundation and charac- teristic ground heave patterns result.
Evidence presented previously (Penner and Gold 1971 ) proved that the shape and size of the foundation unit influenced the heave de- flection pattern of the ground in its vicinity. The heave deflection pattern observed at the ground surface around ficld structures is thought to be a direct reflection of the amount
J . VOL. l l , 1974
that the heave rate is modified at the freezing
lane
by the resisting forces of the fixed struc- ture to which the soil is frozen. When such a pattern develops the amount of heave reduc- tion decreases with distance from the column. The rate of relative movement between a fixed structure and the soil, under field condi- tions, is dependent on the rate of ice lens growth. Ice lens growth in turn is dependent on moisture availability, the general frost sus- ceptibility characteristics of the soil, and tem- perature conditions. For example, during warm- ing trends in winter the temperature of the frozen soil riscs and the apparent adfreeze strcngth is reduced (Saltykov 1 9 4 4 ) . In addi- tion, the rate of ice lensing decreases (Penner 1960) because the thermal gradient is reduced. The frozen layer and thc embedded structure, therefore, are subjected to uplift rates con- trolled by the temperature fluctuations in the wcather.As a result of temperature gradient fluctua- tions the frozen layer under natural conditions in the field is usually nonhornogencous with respect to ice content. During periods of rapid heat mithdrawal from the soil the ice lenscs are numerous and closely spaccd; during periods of low heat extraction the lenscs tend to bc greater in thickness and less numerous (Pcnner 1960). Also, the ice lensing process, thc cause of uplift, only occurs when heat is withdrawn from the soil and it is not possible, thcrefore, to have a constant and uniform tcmperatirre in the frozen layer while forces are devcloping. It is not surprising, considering thc continually changing and nonhomogeneous conditions with respect to the matcrial and ternpcrature of the frozen layer, that a rigorous viscoelastic theory has not been developed for the behavior of the seasonal adfreeze problem on foundation structures.
Complex thermal patterns are sometimes in- duced in the soil by the structure when it is exposed above the ground surface. T h e ther- mal influence on the soil is relatively large for steel structui-es, because of the differences in thermal conductivity, is nluch less for concrete, and is relatively negligible for wood structures as will be shown by the results of this study. This further complication is partly due to rapidly changing temperatures that cause con- tinuing changes in the strength of frozen soils.
PENNER: UPLIFT FORCES ON FOUNDATIONS
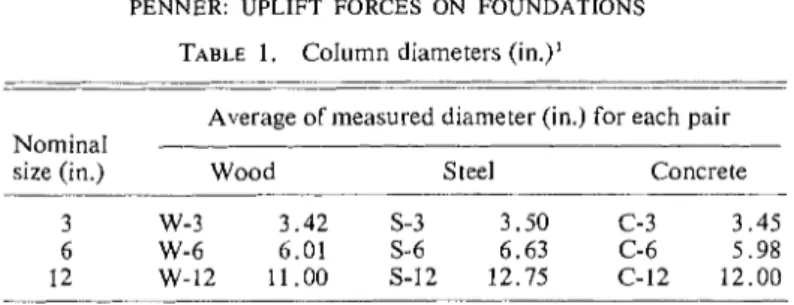
TABLE 1. Column diameters (in.)'
Average of measured diameter (in.) for each pair Nominal
size (in.) Wood Steel Concrete
-
'1 in. = 2.54 crn.
In addition, ice lenses form normal to the direction of heat flow and the resultant forces are in the direction of heat flow. Complex thermal patterns, therefore, result in complex force fields and this inhibits the developmcnt of analytical or theoretical solutions to the problem as noted above.
Methods and Materials
Colirtntl ar~rl Block Cotlcrete Wall Cor~str~rctiotz and It~stollatiot~
Wood, concrete, and steel columns, 3, 6, and 12 in. (7.6, 15.2, and 30.5 c m ) in diameter were used in this present study. T w o of each material and size were installed randomly on the site; the results reported are based on averages.
The 3- and 6-in. (7.6- and 15.2-cm) diameter wood (cedar) columns were turned from solid stock obtained locally but the 12-in. (30.5-cm) columns were turned from laminated stock made from four
6 X 6-in. (15.2 X 15.2-cni) timbers. The surfaces of
the wood columns at the time of installation were sniooth, untreated, and unweathered.
The concrete columns were made from locally purchased ready-mix concrete. For the 3-in. (7.6-cm) diameter colun~ns the concrete was placed inside a plastic pipe form; the 6- and 12-in. (15.2- and 30.5-cni) diameter colunins were formed in sono- tubes. A reinforcing rod was placed down the center line of all the concrete columns to facilitate handling and installation. Column surfaces were smooth with little evidence of air entrapment at the interface between the concrete and form.
The steel columns consisted of rolled steel pipes. The manufacturer's surface coating was removed with a solvent and the final treatment was to wire brush the surface until it was clean and relatively smooth. One-inch (2.5-cm) thick boiler plates were welded to both ends of the steel pipes to provide a substantial bearing surface for the force gauge at the upper end and a watertight seal at the lower end. Boiler plates were also placed on the upper ends of both the concrete and wood columns. These were seated with a neat cement-water mixture t o provide a stable bearing surface for the force gauges and to distribute the load uniformly over the column ends. The measured diameters of the various column types and sizes are given in Table 1.
Thermocouples were installed at 1-ft (0.3-m) intervals on one of each column type and size with
the exception of the 3-in. (7.6-cm) diameter wood and concrete colunins. For those, soil temperature profiles measured at two locations on the site were used to estimate the length of column exposed to the frozen layer for adfreeze calculations. All columns were 6 ft (1.8 m ) in length and embedded in the soil to a depth of 5 ft (1.5 m ) . Columns were placed in augered holes 6 in. (15.2 c m ) larger than the column diameter and backfilled immediately with the same soil, then compacted to approximately the original density.
The block concrete wall was constructed in a trench 2 ft (0.6 m ) wide, 5 ft (1.5 m ) long, and 5 ft (1.5 m ) deep. The wall, 8 in. (20.3 c m ) wide and 4 ft (1.2 n ~ ) long, extended about 8 in. (20.3 c m )
above the ground surface after completion. A 6 I
12 1/2 steel beam was placed on the block concrete wall to distribute the load uniformly across the top of the wall.
Temperatlrre Measuren~ents otz the Site
Ground temperatures were measured at two loca- tions on the snow cleared test site well away from snowbanks around the perimeter of the site. Twenty- gauge copper-constantan thermocouples were attached to 1-in. (2.5-cm) diameter wooden dowels at 6-in. (15.2-cm) intervals to a depth of 4.5 ft (2.7 m ) . Eighteen inches (45.7 c m ) of the thermocouple lead were wrapped around the dowel at each thermocouple location t o prevent errors due to heat flow along the wire. Both ground and column temperatures were recorded daily at about 0830 h with a digital data acquisition system.
S~irveys
A rock anchored, 0.75-in. (1.9-cm) high tension steel rock bolt was used as a bench mark for level surveys. Weekly surveys were carried out in the top surface of all columns and on the center point of the reaction frames. The survey points on the structures were 3-in. ( I - c m ) self tapping screws.
The ground surface deflection pattern was also determined weekly from level surveys on lag bolts set into the asphalt surface at 0.5, 1, 2, 3, 4, 5, 6, and 7 ft (0.15, 0.3, 0.6, 0.9, 1.2, 1.5, 1.8, and 2.1 m ) from the embedded steel columns and at the same distance from the sides and ends of the concrete block wall. T w o lines of markers were used at the columns and four lines for the concrete wall. In the latter case, two lines were set out perpendicular t o the long dimension of the wall and one from each end. T h e heave data given in the paper are the
326 C A N . G E O T E C H . J . V O L . l l , 1974
average of surveys on the two lines of s ~ i r f a c e markers.
Soil nrrd Site Corrdi!ior~s
The test site, approximately 72 X 106 ft (21.9 X
32.3 m ) in size, was located on National Research Co~rncil of Canada property on the Montreal Road
toward the eastern city limits of Ottawa, Ontario. A
detailed description of the soil deposit is given else-
where (Crawford 1951 ). T h e moisture content was
about 4 4 % in the autumn and the average particle size analyses showed the soil to consist of about 7 0 % clay size particles and 3 0 % silt size. A working sur- face for the construction phase was provided by re- moving the grass sod and placing a 1.5- to 3-in. (3.8- t o 7.6-cm) thick gravel pad and a 1.5-in. (3.8-cm) overlay of asphaltic concrete. Bedrock at the site, which was between 11 and 2 0 ft (3.3 and 6.1 m ) below the ground surface, provided a convenient n1e;lns of anchoring the reaction frames.
A view of the site, its surroundings, and the test installations are shown in an early winter view in Fig. 1. The test area was snow cleared whenever necessary. T h e building behind the test site is a teni- perature controlled instrument hut used for the temperature measuring data acquisition system and
other instrumentation. A Stevenson screen located to
the left of the instrument hut was ~rsed to measure air temperatures for freezing index calculations. Design of Reactior~ Frnuies f o r Colun~rrs orrd
Forrtzdotiot~ Wall
T h e reaction frames shown in Fig. 1 were anchored
18 in. (45.7 c m ) below bedrock surface with 0.75-in.
(1.9-cni) high tension rock bolts and 1.25-in. (3.2- c m ) expansion shells at the four corners of the frame. The design and constr~iction are described in detail
in a previous paper (Penner and Gold 1971 ) dealing
with a comparison of adfreeze strength o n small
diameter columns.
Force Mcns~rrer~ierr/s - Ditlorl Galrgrs
T h e ~rplift forces on the 3-in. (7.6-cm) diameter columns were measui-ed with 10-kip (454-kg) capacity force gauges, with 25-kip (11 350-kg) gauges for the 6-in. (15.2 c m ) columns and with 50-kip (22 700-kg) gauges for the 12-in. (30.5-cm) diameter and the block concrete wall. T h e gauges were centered be- tween the ends of the columns and the bottonl of the reaction franie. For the wall, the uplift force was
measured by ~ising a Dillon gauge and a dummy
gauge having similar deformation characteristics. They were placed a1 opposite ends of the structure between the wall and the reaction frame. T h e uplift force was taken to be twice the force measured o n the Dillon gauge. Force readings were carried out daily starting at about 0830 h.
Experimental Results and Discussion
Block Concrete Wall
Heave Force, Adfreeze Strength, and Groicnd Surface Defortnation
The measured uplift forces and calculated adfreeze strengths for this installation were given in a prcvious paper for the winter of
PENNER: UPLIFT FORCES ON FOUNDATIONS 0 . 3 0 I I MAR 10 J A N 2 5 JAN 19 JAN I I DEC 2 1 0 . 1 5
C
WALL (AVERAGE OF LlNE NO. 1 AND NO. 2
DEC 21
B L O C K
DEC 14
l 5
t
1Ib) AT WALL ENDS [AVERAGE OF LINE NO. 1 AND
NO. 2 ) L I N E ?
:
.
f
. I HOV24,ICL-
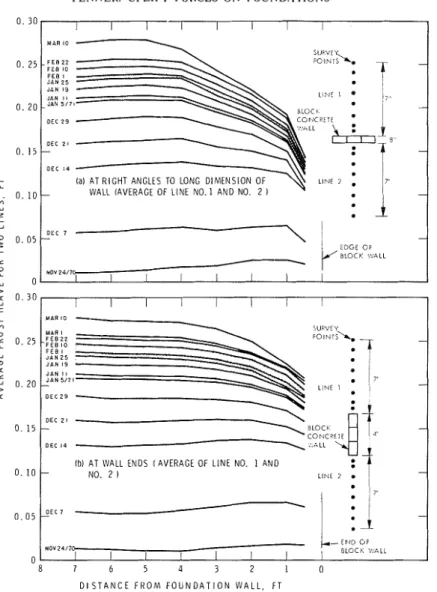
E N D O f I I I I I I B L O C K '.,!,ILL 0 8 7 6 5 4 3 2 1 0 D I S T A N C E F R O M F O U N D A T I O N W A L L . FTFIG. 2. G ~ O L I I I ~ s ~ ~ r f a c e heave at elids of 4-ft (1.2-rn) long concrete wall and at right angle
to long dimension of wall, 1970-1 971.
1969-70. Thc ground deformation mcasure- mcnts around the structures, later found to be
necessary,
werc not made until thc 1970-71 winter pcriod and are rcported here.Thc ground surface deflection pattern based on weekly surveys is quite different at thc ends of the wall from that at the sidcs (Fig. 2 ) . The surfacc deflcction pattern shows that the ad- freezing of the soil suppresses thc heave rate in thc vicinity of the wall and this providcs a novel method of calculating uplift forces. Thc daily force measurements, adfreeze strcngths based on the area of the wall exposccl to the frozcn layer, and vertical movements of the
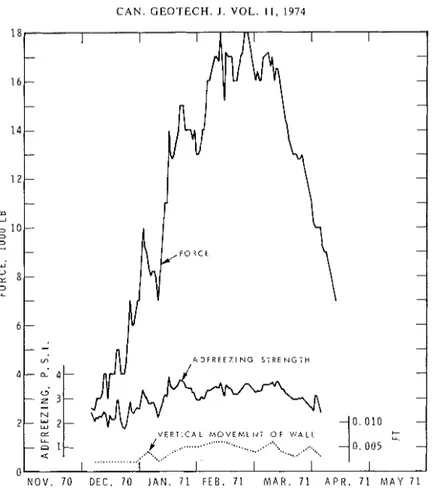
wall duc to the strain in thc reaction asscmbly and gauges, arc given in Fig. 3.
Preciicting Total Uplift Force fro~?z the Groulzci Surface Deflectiorz Pcrttern
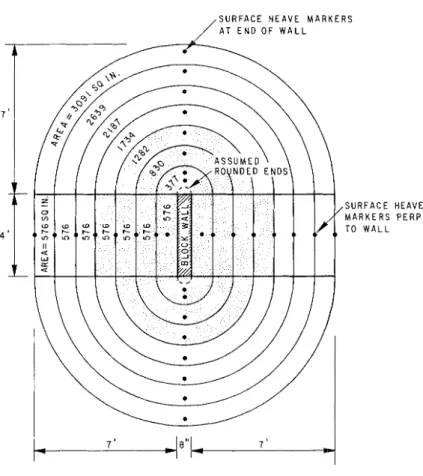
The ground surface heavc pattern was used previously (Pcnncr 1970) and was shown to givc reasonable estimates of the heave forces developed at the freezing plane. In this case the structurc was a rigidly held plate at the ground surfacc. The saine approach is used in the prescnt study to estimatc the total vertical force on the block concrete wall by adfreezing. The important assun~ptions are that, ( a ) the
C A N . GEOTECH. J . VOL. l I, 1974
N O V . 70 D E C . 70 J A N . 71 F E B . 71 M A R . 71 A P R . 71 M A Y 71
FIG. 3 . Force nieasurenients, calculated adfreeze strengths, and vertical movement of block
wall during heaving period, 1970-1971.
main heaving forces are developed at the bot- tom of the frozen layer, and ( b ) the ground surface heave pattern results from thc resisting forccs of the adfrceze to the wall. Both arc considered to be reasonable assumptions. Some redistribution of unfrozen water has bcen shown to occur within the frozen layer under labora- tory conditions but from field measurements of ground heaving at various depths it appears this can be neglected. The deformation behavior of ice sheets around structures (Lofquist 1944) is thought to validate the second assumption although less well documented for soils (Sal- tykov 1944). This resistance to heave extends out from the wall and reduces the rate of heave at the freezing plane as shown by the heave pattern given in Fig. 2.
A solution can be developed if the influence of load on the heave rate is known for the soil in question. It was shown by Line11 and Kaplar (1959) that heave rate R can be expressed by
the following equation:
[ 1
1
R = R,,eUPwhere: R, = heave rate at frost line, but not influenced by pile;
R = heave rate at pressure P; P = applied pressure; and
a = constant for a given soil type (negative value).
The value of a for Leda clay at this particular site, shown previously to give reasonable values of P (Penner 1970), was -0.126. The R,, value is the heave rate taken a distance of 7 ft (2.1 m ) from the pile. A t this distance, the influence of the piles on the ground heaving is not measurable.
The overburden due to the weight of the frozen layer is the same at all points away from the wall and hence does not enter into the calculations. P is, therefore, the pressure at the
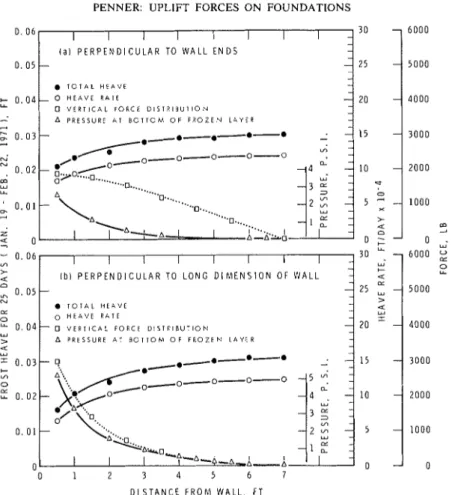
PENNER: UPLIFT FORCES ON FOUNDATIONS 329 l a 1 P E R P E N D I C U L A R TO W A L L E N D S
3
2 5 T O T A L H E A V E 20 A P R E S S U R E A T B O T T O M O F F R O Z E N L A Y E R-
0 . 0 6 LL l b ) P E R P E N D I C U L A R TO L O N G D I M E N S I O N O F W A L L 4 a 25 w T O T A L H E A V E a 4 0 H E A V E P A T E LL 0 w > A P R E S S U R E A T U O T T O h ~ O F F R O Z E N L A Y E R 4 VI 0 2 0 0 0 0 . 0 1 - 1 0 0 0 0 I I 0 0 1 2 3 4 5 6 7 D l S T A N C E F R O M W A L L . FTFIG. 4. Total heave, heave rate, vel-tical pressure, and force distribution a t bottoni of frozen layer a s a function of dist:uice from wall. Pel-iod Jan. 19-Feb. 22, 1971.
freezing front resulting from the resistance to heave imposed by adfreezing of the frozen soil layer to the fixed wall.
The maximum 01- near maximum ~ ~ p l i f t
forces were dcvelopcd during the period from January 19 to February 22, 197 1 as shown by the shaded portions in Fig. 2. The heave rates werc then calculated at distances from the wall of from 0.5 to 7 ft (0.15 to 2.1 rn) at both the ends and the sides (Fig. 4 ) . These rates werc then used in Eq. 1.11 to calculate the pressurc and finally the uplift forces in 1 ft (0.3 m ) increments from the pile, in the area pattern shown in Fig. 5. The pressures calculated were divided by the particular area t o which it ap- plied (see Figs. 2 and 5 ) and the force calcu- lated was plotted at the center of the givcn area e.g. the force between 1 and 2 ft (0.3 and
0.6 m ) from the pile was plotted at a distance
of 1.5 ft (0.46 m ) from thc pile (Fig. 4 ) .
Summing the ~ipward force at the ends of the wall gives a value of 10 400 Ib (4680 kg) and for the sides 1 l 900 Ib ( 5 3 5 5 kg) giving a total uplift force of 22 300 Ib ( 10 035 kg). The measured maximum uplift force for the wall was 18 000 Ib ( 8 100 kg) (Fig. 3 ) .
T h e agrceincnt found betwcen calculated and measured forces supports the validity of the heave and load transfer mechanism pro- posed. It was assumed, however, that there was c o interaction betwcen the different rates of heaving at the ends and sides. T h e heave boundaries between the sides and ends are not thought to be as sharply defined as those used in the calculations but no appropriate method was found to allow for the interaction.
T h e rationale on which the analytical ap- proach is based is reasonablc because the heaving phenomenon involved is well under- stood. The upward force is a dircct result of
CAN. GEOTECH. J . V O L . l I . 1974 S U R F A C E H E A V E M A R K E R S / A T E N D O F W A L L H E A V E P E R P N O T E : D O T T E D A R E A S H O W S G R E A T E S T D E F O R M A T I O N
FIG. 5. Pattern of areas involved for calc~~lation of total force.
ice lens growth and the force generated is trans- mitted to the fixed wall. The differential heave pattern measured could only result from inter- ference with ice lens growth.
Uplift Forces on Ernbeclded Colut~zns
Thc adfreeze studies for the wood and concrete columns extended over two consecu- tive winters, 1970-7 1, and 197 1-72. Steel columns were added to the later study. The actual diameters of the columns were somc- what different from the nominal values and are given in Table 1. The symbol W is used to identify the wood columns, C the concrete, and S the steel, each accompanied by the nominal diameter, e.g. C-3 is a 3-in. (7.6-cm) diameter concrete column.
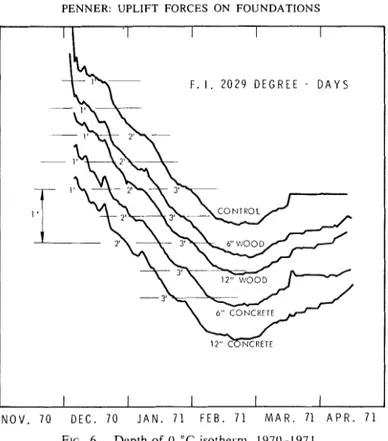
1970-71 winter and in Fig. 7' for the 1971-72 winter. The column lengths over which the temperature was below 0 OC, and the average tcmperaturc, were much different for the steel columns than for the wood and concrete columns as would be expected. F i g ~ ~ r e 8 gives comparisons of the temperature profile on the 12-in. (30.5-cm) diameter columns for three arbitrarily selected days during the 1971-72 winter and Fig. 9 shows the influence of the column diameter on the column tempcrature profile. The temperat~lrc profiles for the wood column were almost the same as the ground temperature profile. The 12-in. (30.5-cm) diameter concrete column had temperatures a little lower than the ground at the same depth The time-depth relationship of the 0 OC
'The depth scale has been offset for each curve in
isotherm measured at locations On the site the graphs (Figs. 6 and 7 ) to avoid the confusion of
(not infl~lenced by col~lmns) and those for the overlapping lines but the same scale has been rnain- various columns are given in Fig. 6 for the tained throughout as indicated.
PENNER: UPLIFT FORCES ON FOUNDATIONS
F. 1 . 2 0 2 9 D E G R E E - D A Y S
I I I I I
N O V . 70 D E C . 70 J A N . 7 1 F E B . 7 1 M A R . 71 A P R . 7 1
FIG. 6 . Depth of O " C isothel.ni. 1970-197 1 .
but the 6-in. (15.2-cnl) column had a tem- pcrature profile very similar to that for thc ground. Large divcrgenccs from the ground temperaturc profile arc very evident on the steel column and, as may be seen, this effect increases with colunln diameter.
The column area used to calculate adfrcezc strengths was based on the depths of the 0 "C isotherm measured directly on the columns except for the 3-in. (7.6-cm) wood and con- crete columns. Thcse columns were not instru- mented for tcmperat~lrc measurements and the depth of the 0 "C isotherm was assumed to be that given by the soil temperature profile. The error introduced in this way is not thought to be significant because thc dependence of the depth of the 0 "C isotherm for the 6-in. (15.2- c m ) wood and concrete columns was found to be almost the same as for the undisturbed ground.
Some movement of the columns, although small compared with the total heave, was un- avoidable. The vertical movements ranged be- tween 0.005 and 0.020 ft (0.0015 and 0.0061 m ) depending on the force imposed on the pile. These movements were due to the conlpression
of the force gauge and slight adjustments in thc reaction framc and rock bolt assembly as thc load increased.
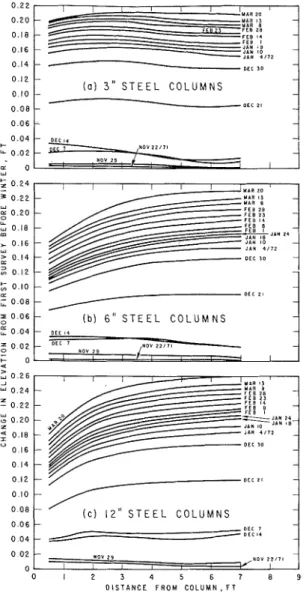
Sreel Col~tt?~n.s
The average ground surface heave patterns established from weekly level surveys on two radial lines of markers for each column are given in Fig. 10. These heave patterns display the samc general characteristics as those for the ends and sides of the concrete wall. The greatest suppression of heave in the surrounding soil was around the 12-in. (30.5-cm) diameter column and the least around the 3-in. (7.6-cm) column, in fact, the ground around the 3-in. (7.6-cm) column showed little evidence of heave suppression.
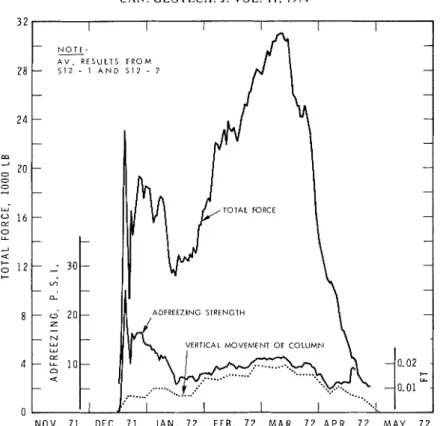
Figure 11 gives daily force measurements, calculated adfreeze values, and column strain based on the average for two 12-in. (30.5-cm) diametcr steel colunlns. T h e area of the column within the frozen zone for adfrecze calculation was based on the daily position of the 0 "C isotherm on the soil - steel column interface. Graphs similar to Fig. 11 were prepared for all columns but the results will be presented in
C A N . G E O T E C H . J . VOL. l l . 1974
I I I I I
F. I . 1 9 2 0 D E G R E E - D A Y S
I I I I I
N O V . 7 1 DEC. 7 1 J A N . 7 2 F E B . 7 2 M A R . 7 2 A P R . 7 2
FIG. 7. Depth of 0 " C isotherm, 1971-1972.
tabular form only to conserve space. The de- tailed field results for one pair of columns ( 12-in. (30.5-cm) diameter) are given here to show thc pattern of the total force and ad- frceze values during one winter pcriod to draw attention to the daily variations that occur during naturally varying climate conditions. These variations are a direct reflection of the response of the ground temperature and ground temperature gradients to changes in air tem- perature. Adfreeze strengths are temperature dependent and ground thermal gradients are of paramount importance in establishing heave rates and hence displacement rates in the soil surrounding the columns. Both are involved in
the transfer mechanism of uplift forces from frozen soil to column.
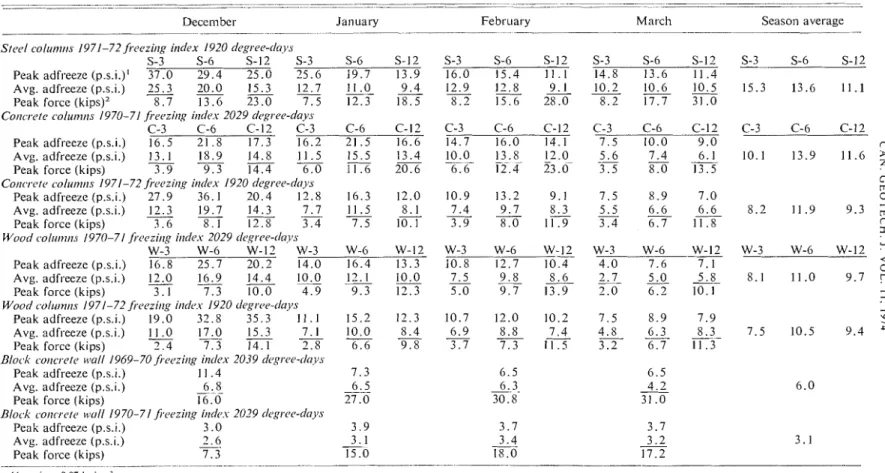
Adfreeze strength comparisons between col- umn type and diameter are made on the basis of peak values for the month and average monthly means (Table 2 ) . Adfreeze strengths for thc steel columns are highest for the small- est column (3-in. (7.6-cm) ), intermediate for the 6-in. (15.2-cm), and lowest for the 12-in. (30.5-cm) diamctel- column. This is thc order in which the results would be expected to fall based on the predicted values for the block wall ends and sides. It is also in agreement with the analysis of Lofquist (1944) for uplift forces by ice covers on structures when the
PENNER: UPLIFT FORCES ON FOUNDATIONS 333 la1 D E C E M B E R 1 7 . 1 9 7 1 0 8 3 0 H A I R T E M P E R A T U R E . - 7 . 3 " C l l l l l l l l l (bl D E C E M B E R 30. 1 9 7 1 0 8 3 0 H - A l R T E M P E R A T U R E , - 1 5 . 8 C - - -
-
-\
YJ
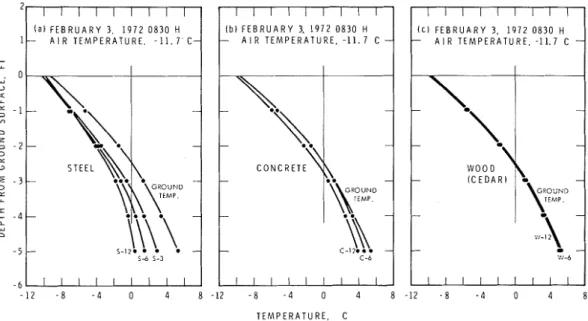
- 5-12. C-12. l l l l l l l l l I I I I I I I I I ( c ) F E B R U A R Y 3. 1 9 7 2 0 8 3 0 H - A I R T E M P E R A T U R E , - 1 1 . 7 C -:\\
-:
q1.
:
\
\\
- 5-12 C - I 2 - ';-I2 I I I I I I I I I T E M P E R A T U R E , CFIG. 8. Comparison of temperature profiles on the large diameter steel, wood, and concrete
piles a t various times (luring the winter. Note: ( I ) Piles were exposed I ft (0.3 m ) above ground surface, snow clearetl area. ( 2 ) Ciround temperature profile similar to that of wood pile.
F E B R U A R Y 3. 1 9 7 2 0 8 3 0 H A I R T E M P E R A T U R E . - 1 1 . 7 ' C l l l l l l l l l l b l F E B R U A R Y 3. 1 9 7 2 0 8 3 0 H - A I R T E M P E R A T U R E . - 1 1 . 7 C - - - - - -
..
-KEYD
- -'A
- C-12...
- C - 6 I I I I I I I I I ( C l F E B R U A R Y 3. 1 9 7 2 0 8 3 0 Ht
A I R T E M P E R A T U R E . -11.7 C T E M P E R A T U R E . CFIG. 9. c o m p a r i s o n of ten1peratu1.e profiles on piles of various sizes and materials in rela- tion to the ground t e n i p e r a t ~ ~ r e profile on the site. Note: Broad line in part ( C ) includes the temperature profile f o r wootl-12, -6, and n a t ~ ~ r a l ground, snow cleared area.
water level rises, a problem that has many tween column material and size, damage to the similarities to the adfreezing uplift forces on structure may occur unlcss peak adfrceze values structures in frost-susceptible soils (Penner and resulting from rapid changes in the ground Gold 1971). temperature are known. These are also given While weekly or monthly adfrecze values in Table 2 for all the foundation structures in- are thought to bc useful for comparisons bc- volved in the present study: 2 years of observa-
TABLE 2. Monthly mean, peak adfreeze, and peak force values for columns and the block concrete wall ... . .
.- -- . . . ..- . .
December January February March
. . . - .
... .- -
-S/ecxl co1un111s 1971-72fi(~ezi11g inrlex 1920 r1egrc.e-clo)'s
S-3 S-6 S-12 S-3 S-6 S-12 S-3 S-6 S-12 S-3 S-6 S-12
Peakadfreeze(p.s.i.)' 37.0 2 9 . 4 25.0 25.6 1 9 . 7 13.9 16.0 1 5 . 4 11.1 1 4 . 8 13.6 11.4
Avg. adfreeze (p.s.i.)
25.3
20.0
15.312.7
11.O
9
.
4
12.9
1 2 . 89
.
1
10.2 10.6 10.5
Peak force (kips)2 8 . 7 1 3 . 6
23.0
7 . 5 12.3 18.5 8 . 2 15.6 28.0 8 . 2 1 7 . 7 31.0Co~lcrete c . o l ~ o n ~ ~ s 1970-71 f i e r z i ~ ~ g i~lrles 2029 dc,g~~c~c,-doy~
C-3 C-6 C-12 C-3 C-6 C-12 C-3 C-6 C-12 C-3 C-6 C-12
Peak adfreeze(p.s.i.) 16.5 2 1 . 8 17.3 1 6 . 2 2 1 . 5 16.6 14.7 16.0 14.1 7 . 5 10.0 9 . 0
Avg.adfreeze(p.s.i.)
13.1
18.9
14.8
11.5
15.5
1 3 . 4 10.0 1 3 . 8 12.0-5.6
7.4
6
.
1
Peak force ( k i ~ s ) 3 . 9 9 . 3 14.4 6 . 0 11.6 20.6 -6T6 12_4 23.0 3 . 5 8 . 0 13.5
Co,rcrc/o C O ~ U I ~ I I ~ 1971-72 fieezi11.y i~lrfc~x 1920 rlegree-r10j.s
Peak adfreeze (p.s.i.) 27.9 36.1 2 0 . 4 1 2 . 8
Avg. adfreeze (p.s.i.)
12.3 19.7
14.3
7
.
7
Peak force (kips) 3.6 8 . 1 12.8 3 . 4
~ o o r / ~ O I N I ~ I I S 1970-71 fieezil~g i11r1ex 2029 ciegrrc,-c~o)~s
W-3 W-6 W-I? W-3
Peak adfreeze (p.s.i.) 1 6 . 8 25.7 20.2 14.0
Avg. adfreeze (p.s.i.)
12.0
16.9
14.4 10.0
Peak force (kips) 3 . 1 7 . 3 1 0 . 0 4 . 9
Wood co1~on11.s 1971-72 fieezil~g illrlc..u I920 elegrc~c~-claj~s
Peak adfreeze (p.s.i.) 19.0 3 2 . 8 35.3 1 1 . I
Avg. adfreeze (p.s.i.) Q
17.0
15.3
7
.
1
Peak force (kios) . . , 2 . 4 7 . 3 14.1 2 . 8
B10c.k couo.e/e ~ t ~ o l l 1969-70 fi.c,c,zi~~g i11c1e.x 2039 dc,&~rc~c~-rlr~ys
Peak adfreeze (p.s.i.) 11.4
Avg. adfreeze (p.s.i.) -- 6 . 8 -
Peak force (kips) 16.0
Block co~~cre/c, 1t.011 1970-71 fi.ec,zi~~g i11r1c.v 20-79 c/c.,prc~e-rlcrys
Peak adfreeze (p.s.i.) 3 .O
Avg. adfreeze (p.s.i.) - 2 . 6
Peak force (kips) 7 . 3
... Season average .... . . . . . . . . . . . . . . . . . ... .... . ' l p.s.i. - 0.07 kg/cml. '1 kip - 454 kg.
PENNER: UPLIFT FOR( :ES ON FOUNDATIONS 335 I
'
'
' M A R 1 0 I?'*
' ? .,, ( a ) 3 " S T E E L C O L U M N S-
0 . 0 8 --C____- o c c 21 0 . 0 6 1 I I Y A R 11 J A N 4 / 7 2 O E L l O - - (bl 6 " S T E E L C O L U M N S - - D E C $ 4 - O L T 7 - HOY 2 9 "0" 22,- 1/
1 -I I O L C Z I ( c ) 12" S T E E L C O L U M N S 0 . 0 6 D C C I DISTANCE FROM COLUMN. FTFIG. 10. Ground surface heave pattern around 3-, 6-, and 12-in. (7.6-, 15.2-, and 30.5-cm) steel columns, 1971-1972.
tions on thc block concrete wall, 1969-70 and 1970-71; 2 years on the wood and concrete columns, 1970-71 and 1971-72; and 1 year on the stecl columns 1971-72.
T h e tcmperaturc at the bottom of thc 6- and 12-in. (15.2- and 30.5-cm) steel columns which were embcdded to a depth of 5 ft (1.5 m ) droppcd bclow 0 " C at the cnd of February 1972 (Fig. 7 ) . This did not occur on any of thc other columns. T h e maximum force shown in Fig. 11 (12-in. (30.5-cm) steel columns) may be high by 3000-4000 Ib (1350-1800 kg) because of basal heaving. I t should be
notcd, however, that the hcave forces and di- rection of heat flow at the frcezing point arc always normal to the frcezing planc (Fig. 12) which probably accounts for the relatively small contribution t o thc total force aftcr the frost line penctrated beyond the cnd of the column. Only the vertical componcnts of the force contribute t o uplift.
Thc rates of vertical movement of the frozen soil (heave rate) relative to thc steel columns and adfreeze strengths o n a weckly basis are givcn in Fig. 13. A t the bcginning of the wintcr when the frost penctration rates and frost hcave rates werc at their highcst the adfreeze strength was also high. T h e rate of rclative displaccment between soil and column appears t o influcnce the apparent adfreeze strength which is de- scribed in Soviet literature and more rccently by Johnston and Ladanyi ( 1 9 7 2 ) .
Calculation of the total uplift force from the hcaving pattern around the steel piles, as was carried out for the block concrete wall, was not possible. As the maximum forces wcre being approached the frost linc had advanced beyond the base of the two larger columns (6- and 12-in. ( 15.2- and 30.5-cm) diameter) hcnce the uplift forccs could not be assigned to adfrcezc only.
Wood and Concrete Colurnns
T h e adfrceze measurements on steel columns discussed previously were for one winter only, 1971-72. T h c same measureincnts for wood and concrete columns werc carried out for two consecutive wintcrs, 1970-7 1 and 1971-72
(Table 2 ) . T h e general pattern of adfrcezc and total uplift forces was similar to thc stecl columns. T h e exception was that the lowest adfreeze values were obtained on the 3-in. (7.6-cm) diameter columns for both materials and both winter periods. T h e order for the 6- and 12-in. (15.2- and 30.5-cm) diamcter columns was thc same as for the stecl columns, i.e. the higher adfreezc values occurred o n the 6-in. ( 15.2-cm) diameter columns. T h c reason for the anomaly regarding the 3-in. (7.6-cm) diameter columns remains unexplained although onc possibility is that the stress and the asso- ciated strain of the soil around small diameter wood and concrete columns were sufficiently high t o cause yielding.
CAN. G E O T E C H . J . VOL. 1 1 , 1974
NOV. 7 1 D E C . 7 1 JAN. 7 2 F E B . 7 2 MAR. 7 2 APR. 7 2 M A Y . 7 2
FIG. 11. Total force, adfreeze strength for 12-in. (15.2-cni) diameter steel pile, 1971-1972.
FIG. 12. Schematic of direction of heat flow and force as freezing front approaches bottom of 12-in. (15.2-cm) steel column.
PENNER: UPLIFT FORCES ON FOUNDATIONS I I I 1 N O T E :
-
1 . A D F R E E Z I N G S T R E N G T H S A R E W E E K L Y A V E R A G E S O F D A I L Y R E A D I N G S F O R D U P L I C A T E C O L U M N S 2 . H E A V E R A T E S M E A S U R E D A T-
6 L O C A T I O N S O N S I T E 5 3-
- A D F R E E Z E S T R E N G T H H E A V E RATE-
S 6 --
- 0-0' 0 I I I I T I M E 0 D E C . 7 1 J A N . 7 2 F E B . 7 2 M A R . 7 2 A P R . 7 2FIG. 13. Unimpeded frost heave rate on small footings site trer.slts steel column adfreeze
strength, 1971-1972.
0
at the onsct of cold weather in the fall, although the maximum total uplift force on the pile occurred much later in the winter. Similar re- sults were obtained for the steel piles.
Summary
Adfreeze strengths may vary from year to year as evidenced by the 1970-71, 1971-72 results for wood and concrete columns, and the concrete block wall rcsults for 1969-70, 1970-71 (Table 2 ) . While the overall severity of the wintcrs based on the freczing index was similar, the differences may be attributable to other climatic influences such as changes in the moisture regime or the pattern of cold and warm pcriods during the winter.
The adfreezc strengths were highest for steel followed by concrete and wood. This is at- tributed mostly to the influence of temperature on adfrecze strength. The steel columns were normally colder than the wood and concrete columns. Saltykov ( 1944) and Tsytovich et al.
(1959) have both shown the increase in ad- freeze strength as the temperature dccreascs.
The maximum uplift forces were also higher on the steel columns. This is partly accounted for by the higher adfreezc strengths and the longer column length over which the adfreeze force was acting (Figs. 8 and 9 ) . Extreme values in adfreezc strength differ by about a factor of two for the different materials studied, but for some periods the range is much less. Adfreeze strengths for the block wall are again much less than for any of the columns studied
(Table 2 ) .
Adfrecze strengths were highest for the smallest steel columns (3-in. (7.6-cm) diam- cter) followed by lower values for the 6-in. ( 1 5.2-cm) columns and lowest for the 12-in. (30.5-cm) columns. Thc results for the 3-in. (7.6-cm) diameter wood and concrete columns do not fall into this pattern but the 6- and 12-in. ( 1 5.2- and 30.5-cm) diameter columns followed the pattern for steel columns.