COLLABORATIVE INTERACTIVE METHODOLOGY FOR ENVIRONMENTAL SITE SELECTION
by EMILIE HUNG
Bachelor of Science in Agricultural and Biological Engineering Cornell University, 1997
Submitted to the Department of Civil and Environmental Engineering In Partial Fulfillment of the Requirements for the Degree of
MASTER OF ENGINEERING
IN CIVIL AND ENVIRONMENTAL ENGINEERING at the
MASSACHUSETTS INSTITUTE OF TECHNOLOGY June 1998
©Emilie Hung All rights reserved
The author hereby grants to M.I.T. permission to reproduce and distribute publicly paper and electronic copies of this thesis in whole or in part.
Signature of the Author
Department of Civil and Environmei Engineering May 21, 1998
Certified by
P(- $iesor Feniosky Pefia-Mora Assistant Professor of Civil and Environmental Engineering Thesis Supervisor
Certified by
Dr. Judith Pederson MIT Sea Grant College Program
Accepted by
Professor Joseph M. Sussman Chairman, Department Committee on Graduate Studies
JUN 0219
98
Collaborative Interactive Methodology for Environmental Site Selection
by Emilie Hung
Submitted to the Department of Civil and Environmental Engineering on May 20, 1998, in partial fulfillment of the requirements for the degree of
Master of Engineering in Civil and Environmental Engineering
ABSTRACT
The motivation for the Boston Harbor Navigation Improvement Project (BHNIP) is to ensure that Boston has a reliable and modern port by deepening the channels for container vessels and improving navigational efficiency. This effort requires the dredging and treatment of sediment that has become contaminated by the dumping of human and industrial wastes and port activity through the years. The BHNIP has selected the use of in-channel capped borrow pits as a treatment method for contaminated sediment. This option is the most cost-effective disposal method with public acceptance. As a result, the site selection for the containment of the dredged material has become highly controversial as the industry and public voice their concerns and opinions.
Confronting the interests to site selection is a difficult task as opinions clash between environmental organizations, businessmen, and the public. Reaching a consensus requires the sharing and understanding of information, along with the cooperation and collaboration of people. The goal of this project was to develop a methodology and a system to aid the communication and collaboration between the involved parties in the decision making process. In creating the system tool, an interactive web site was generated to provide a common ground for information to be analyzed, shared and transferred. The site also would monitor if and how individuals collaborate their values with one anther to reach a consensus. By generating a user profile, the system stored the interests of users and showed how these interests compare with other parties. The system would allow for communication between parties and would capture how interests may change according to the interactions. It is realized that parties would change the priority or threshold of their values based on communications, conversations, and alliances formed with other parties. The tool would then be able to suggest feasible sites for borrow pits based on the adjusted perspectives and expectations of these groups or alliances.
Thesis Supervisor: Professor Feniosky Pefia-Mora
Assistant Professor of Civil and Environmental Engineering Thesis Supervisor: Dr. Judith Pederson
ACKNOWLEDGMENTS
Hold Fast to Dreams
by Langston Hughes
Hold fast to dreams For if dreams die Life is a broken-winged bird
That cannot fly. Hold fast to dreams For when dreams go Life is a barren field Frozen with snow.
I thank everyone who encouraged me to dream, believed in my dreams, and kept my dreams alive. May your dreams also be empowering and far reaching.
TABLE OF CONTENTS
1 Motivation for Collaborative Interactive Methodologyin Environmental Disputes ... 8
1.1 Importance of Collaboration and Interaction ... 13
1.2 Objectives of the Collaborative Interactive System ... ... 16
1.3 Hypothesis of Collaborative Interactive Systems ... 16
1.4 Benefits of Collaborative Interactive Systems ... 17
2 Requirement Analysis ... 18
2.1 System Accessibility and Interactivity ... ... ... 18
2.3 Data Storage and Retrieval ... 20
2.4 System Scenarios ... 20
3 Theories on Decision M aking and Negotiation ... ... 24
3.1 Game Theory ... . ... 24
3.2 Co-operative Gam e Theory ... ... 26
3.3 Environmental Negotiation and Conflict Resolution ... 27
3.3.1 Escalation and Entrapment ... 28
3.3.2 Effective Consensus Building. ... 29
4 Related Research and Literature Review ... ... 31
4.1 Collaborative Software and Methodology for the Environment ... 31
4.1.1 Urban Planning and Riverfront 2000... ... 31
4.1.2 Design Rationale... ... ... 33
4.2 Disposal Sites for Dredged Sediment ... ... 34
4.2.1 New York/ New Jersey Harbor.. ... 34
5 Information Tool Model ... 38
5.1 Data .... .... ... .... ... . ... 39
5.2 Site Selection ... 39
5.3 User Profile ... 40
5.4 Database ... ... 41
6 Methodology for Collaboration in Environmental Site Selection ... 43
6.1 C ollect ... .. . ... ... ... ... 44
6.2 Filter ... . ... ... 44
6.3 T ransport ... ... ... . . .... 45
6.4 A ccess ... 45
6.5 Interpret ... ... ... .. ... 46
7 Components of the System ... ... 47
7.1 Microsoft FrontPage98 ... ... 48
7 .1.1 W eb S ite ... ... .. . ... . ... ... 4 8 7.2 M icrosoft A ccess... .. ... ... ... ... 49
7.3 G IS A rcV iew ... ... ... ... ... 50
8 Collaborative Interactive System Scenarios ... 52
8.1 C om petitive ... ... .. .. ... ... 53 8.2 C ooperative ... ... ... ... ... 54 8.3 "W hat-if"... ... . ... .. ... ... ... ... .54 9 C onclusions ... ... . ... 56 9.2 Access Database... .. ... 57 9.3 GIS ArcView... ... 60 10 Future Research ... ... ... 62
10.1 Social and Casual Interaction ... ... 62
10.2 Future Applications ... 63
10.3 Simulation Model Development ... 63
APPENDIX A ... ... ... 65
A PPEN D IX B ... ... 67
APPENDIX C ... 70
LIST OF FIGURES
FIGURE 1-1: Dredged Material Disposal Options ... 10
FIGURE 1-2: FIGURE 1-3: FIGURE 4-1: FIGURE 4-2: FIGURE 5-1: FIGURE 5-2: FIGURE 6-1: FIGURE 7-1: FIGURE 7-2: FIGURE 7-3: FIGURE 8-1: FIGURE 9-1: FIGURE 9-2: FIGURE 9-3: FIGURE 9-4: FIGURE 9-5: Disposal Cell Scheme ... 11
Boston Harbor Navigation Improvement Project Area ... 15
Interaction for Land Use Map ... 33
New York/New Jersey Project Area ...35
Information Tool Model ... 38
Sam ple Scroll B ar ... ... 40
Information Flow Process ... ... 43
Specification Analysis ... ... 47
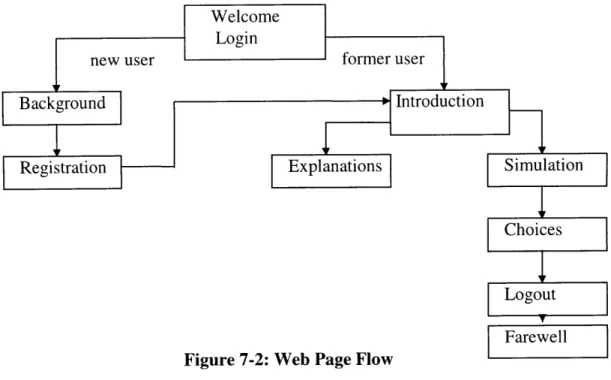
Web Page Flow ... ... 49
Internet Database Connector ... 50
User Choices for System Scenario ... 52
Opening Page to Web Site ... 57
Relationship of Database Tables ... 59
Database Table with Sample User Profile... ...59
Resultant Picture with Feasible Region ... ... 61
LIST OF TABLES
TABLE 1-1: Economic Analysis ... ... ...9
TABLE 1-2: Borrow Pit Criteria ... .. ... 12
TABLE 3-1: Negotiation Flow Process ... 30
Chapter 1
1 Motivation for Collaborative Interactive Methodology
in Environmental Disputes
The Boston Harbor and its waterfront have supported industry and activities for several centuries. The use of the port for fishing, shipping, and commercial industries brings revenue to Boston's economy (USACE & Massport 1995). Silting or sediment deposition in the navigation channels render them inaccessible to ships with deep drafts. These shallower channels make navigation difficult and inconvenient if ships need to wait for high tides before entering the harbor and unloading before low tide. If the vessels use other ports instead, this inefficiency leads to the loss of business for Boston. Sediments can be deposited in three additional ways: (a) from fine solids in rivers and streams settling out of the water column in the slower moving harbor, (b) from current and wave action washing solids in from the ocean as well as redistributing and eroding shorelines and channel boundaries, and (c) deposits from storm water and combined sewer outfalls (USACE & Massport 1995). Much of the city still has a combined sewer outfall system (CSO) that combines runoff with sewage in the same pipelines. When it rains, CSO's send the overflow and associated sediment, particles, and organic material into the harbor. Therefore, after decades of sediment and waste accumulation, the channels require dredging to maintain an operational depth.
The motivation for the Boston Navigation Improvement Project (BHNIP) was to dredge areas of the harbor in order to improve navigational efficiency. Depth maintenance and the creation of a greater depth to accommodate wider and deeper vessels were the primary goals of BHNIP (USACE & Massport 1995). Dredging to a minimum required depth and width would enable larger vessels to maneuver easily in the channel. If the deepening went below the pre-existing bed levels, it could result in the movement of sediment into these deepened areas by currents and waves (Yell & Riddell 1995).
Concerned industries using the port wrote the U.S. Army Corps of Engineers (USACE) with letters rallying for the approval and implementation of the BHNIP. Companies that handled containers in the port were prevented from navigating during low tide. And if the vessels could not afford to wait, they bypassed the port altogether. For companies with an exportation business such as Rexham Inc, the export business represents 15% of more than one hundred million gross sales (USACE & Massport 1995). The loss of revenue threatened the jobs of this business. They felt that it was the obligation of Boston to mandate the accommodation of larger vessels.
A cost benefit analysis, based on March 1995 price levels. The results listed in Table 1-1 demonstrated that it was beneficial to undergo the dredging project (Table 1-1 USACE & Massport 1995).
Table 1-1: Economic Analysis (USACE & Massport 1995)
Annual Benefits $ 3,594,000
Annual Cost $ 2,487,000
Benefit-Cost Ratio 1.4
Although there was wide support for the BHNIP, the effects of dredging on the environment cannot be ignored. By its very nature, dredging affects the nature and characteristics of the land and waters below. The dredging of the Inner Harbor is estimated to generate 1.0 million cubic yards (cy) of contaminated silt, 1.8 million cy of underlying parent material, and 0.1 million cy of rock. The estimated cost for the disposal of contaminated sediment is over 20 million dollars (USACE & Massport 1996). The underwater excavation and disposal process must be safe, economical and environmentally sound. Several disposal options exist, but an optimal disposal plan will factor regulatory requirements, environmentally acceptable disposal of contaminated sediment, cost, and public opinion in the choice of a preferred option. In the case of Boston Harbor, engineers decided that the Least Environmentally Damaging Alternative was in-channel disposal cells with a clean cap cover.
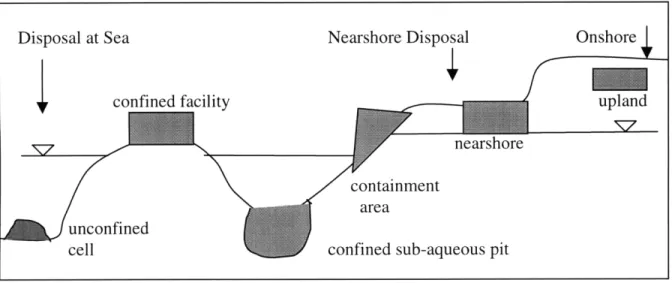
There are three options for disposal of dredged material: (1) disposal at sea, (2) disposal in shoreline enclosures, and (3) onshore disposal (Dolin & Pederson 1991; Bray et al. 1997). Figure 1-1 shows a diagram of these alternatives (NJDEP 1997). Regulations, cost, and contaminant characteristics are all factors that determine a chosen method. Moreover, each option has its environmental side effects. For example, shoreline enclosures can be low-cost or high integrity depending on the preferred type. They may have high berms or special liners to retain contaminants. However, regulations often prohibit shoreline enclosures to protect the existing ecosystem.
Disposal at Sea Nearshore Disposal Onshore
confined facility upland
nearshore containment
area unconfined
cell confined sub-aqueous pit
Figure 1-1: Dredged Material Disposal Alternatives (NJDEP 1997)
Onshore disposal is an option when there is a site that can accept the dredged material. The dredged material typically must be de-watered and then may be used for landfills, restoring wetlands, or construction materials. De-watering the sediment and decontaminating it to acceptable levels is often costly and the question of how the contaminant will be treated still must be addressed. In addition, on shore disposal may pollute groundwater and be difficult to process and to clean (Bray et al. 1997).
Offshore disposal can occur in several geographical zones such as deep-ocean, inlet, and near-shore. These options breakdown further into specific options. Unconfined disposal, confined disposal into seabed depressions, confined disposal between underwater dykes,
and formation of islands are all a subset of disposal at sea (Bray et al. 1997). Recently, capping of confined disposal, borrow pits have also become popular offshore disposal options.
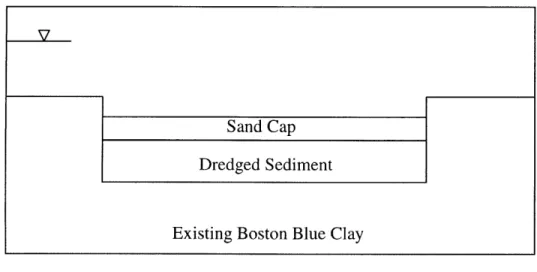
The alternative determined for the Boston Harbor was the use of borrow pits (cells) constructed in-channel and capped with a three foot layer of clean sand (Massport & USACE 1995). This in situ, offshore disposal method is called capping (Fig. 1-2). It is defined as the controlled accurate placement of contaminated dredged material at an open water site, followed by a covering or cap of clean isolating material (Palermo 1994). Capping has been practiced in the U.S. since the mid 1970's and the U.S. Army Corps of Engineers continues to perform and permit capping projects with a total of 20 projects on both East and West Coasts (Clausner 1994). It has been recognized as an effective method for containing and sequestering the toxic effects of contaminated sediment (Engler 1989), although its effectiveness at depths greater than 30-60m is questioned. For Boston Harbor, the displaced clean parent material will be disposed of in 300 feet of water offshore of the Massachusetts Bay Disposal Site (Massport & USACE 1996).
Sand Cap
Dredged Sediment
Existing Boston Blue Clay
Figure 1-2: Disposal Cell Schematic (Fitzgerald 1998)
Although the BHNIP has identified and is testing the use of disposal cells with capping in the Inner Harbor, there remains a need for a long-term solution. The main issue deals with locating additional borrow pits to handle the expected 7 million cy of the
contaminated sediment expected in the next 50 years (USACE & Massport 1996). Concerned industries, public, environmental advocates, and regulatory agencies have begun to voice their preference and concerns with certain locations, while standards and regulations also prevent site selection. The current criteria for sub-aqueous borrow pits as an aquatic containment facility are shown in Table 1-2.
Table 1-2: Borrow Pit Criteria (Metcalf and Eddy 1992)
1. Material from the borrow pit excavation should be reusable elsewhere, and therefore the pit must be located in an area where there are commercially-usable sand and/or gravel deposits.
2. To foster reuse of the excess borrow pit excavate, the pit must be located within an economically feasible distance of an area where there is a need for the excess material.
3. The site must be located in an area where the dispersal of dredged sediment into the water column would be minimal
4. Depth to bedrock must be sufficient for excavating the pit
5. The site must be located in an area where oceanographic conditions would not cause
disturbance of the cap on the pit.
6. Adverse impacts to threatened or endangered species or their habitat areas must be avoided.
7. The project should not adversely affect other federal, state, or local protection areas, and disposal must be consistent with management of protected areas.
8. The site must not cause adverse impacts to commercial and recreational fishing. 9. The site can not interfere with navigation; therefore channels, anchorages, and other
restricted areas were removed from consideration.
10. Aesthetic impacts and impacts to recreational areas must be avoided
11. Disposal must avoid adverse impact to designated historical or cultural resources. Areas which would result in impacts to these resources and to the sites listed on or eligible for listing on the National Register of Historic Places must be avoided.
Although the BHNIP is a positive step for Boston's port industry, it is under the watchful eye of environmental, recreational, and fishing industry proponents. The government has the difficult task of mediating and mitigating the interests and issues among the interest groups. Few system tools and methodologies exist to promote the cooperation, information sharing and analysis between these groups to reach a consensus. The Internet, however, is gaining popularity as a tool for information sharing and analysis.
The dawning of the information age and increasing use of the Internet has rapidly brought both valid and invalid information to users. This capability is global in breadth as it enables people to debate, to share, and to galvanize around central issues, but it does not necessarily create a global community. Locally, the fundamental geographical boundaries that we live, exchange, and interact in create a community. The drawback from obtaining information over the Internet is the void of human interaction. It is the lack of social and casual interaction and collaboration between people over the Internet that fails to create a sense of community. Perhaps as humans, we have not realized how to use technology to form communities. Further compounding the isolation is a lack of tools and systems that promote collaboration and interaction over the Internet.
The motivation for my project was to equip global and local communities with a methodology and system tool that would enable them to contribute ideas and opinions to the issues surrounding environmental site selection.
1.1 Importance of Collaboration and Interaction
The selection of dredged material disposal sites for contaminated sediments involves a tedious and often controversial process. The process begins with the dissemination and the clear presentation of information combined with the cooperation of involved parties. Issues arise when individuals and groups require information of varying scope, technicality, and depth. Engineers and scientists may want numerical data to analyze and
to use as quantitative evidence, while the public may only have special interests, qualitative values, and preferences. This dichotomy leaves policymakers with the difficult task to integrate information from all parties to reach a solution. Thus, the methodology in which information is presented, extracted, and utilized, plays a key role in determining the satisfaction, interaction, and success of site selection.
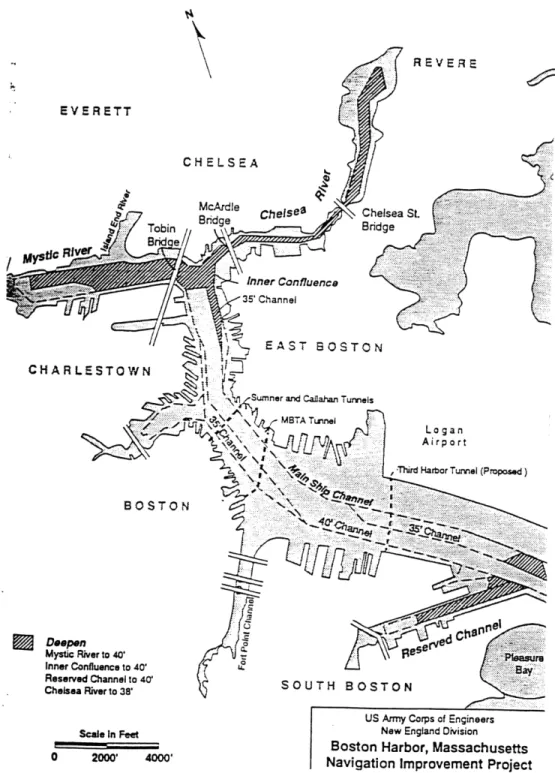
In the case of the BHNIP, policymakers use the input from the public, environmentalists, and scientists to decide on feasible areas within the Inner Harbor to dig cells to hold contaminated sediment. Figure 1-3 shows the area involved in the BHNIP. In the process of selecting containment areas, such as the in-channel disposal sites in Boston Harbor, data are generated for site and risk assessments. Often the volume of data is so large that filtering relevant information to the appropriate people in the appropriate manner becomes a problem.
It is not uncommon for consultants or project proponents to manipulate and bias outcomes to reflect their interests--especially when selecting from a large number of sites where several factors such as regulations and economics are considered. Other compounding issues regarding the data are unequal availability and access. Often not all the issues are equally addressed and represented. This imbalance creates a cornucopia of means and reasons, and it makes reaching a consensus a long road of persuasion and explanation. If a respected data analysis system that represented all issues existed, it
would accelerate the consensus process.
To improve the site selection process through common information analysis and sharing, advances in software, such as ArcView, are used to manage and to interpret spatial data. ArcView can extrapolate information such as land coverage from the Geographic Information System (GIS) databases and utilize tables with longitudinal and latitudinal coordinates to visually map the data. Unfortunately these packages are often costly and may require technical training.
REVERE EVERETT CHELSEA e McArdle EAST BOSTON CHAR
and Callahan Tunnels
Logan
Airport
Third Harbor Tunnel (Proposed)
BOSTON
Deepen Mystic River to 40' Inner Confluence to 40'
Reserved Channel to 40'
Chelsea River to 38' SOUTH BOSTON
US Army Corps of Engineers New England Division
Boston Harbor, Massachusetts 0 2000' 4000' Navigation Improvement Project
Figure 1-2: Boston Harbor Navigation Improvement Project Area (USACE & Massport 1988)
1.2 Objectives of the Collaborative Interactive System
As a result of diverse opinions, the cooperation of people to interpret information and to decide on disposal sites has always been complex. In the case of Boston Harbor and other public dredging projects, dissimilar interests and biased knowledge between environmentalists, industry, and the public make consensus for site selection a challenge. There is a formal process that involves public meetings and hearings where involved parties present their gathered information and concerns. There are also comment periods and presentations where opinions and issues are discussed. This project addresses the potential need for a tool designed to supplement and to speed up the consensus process.
The application of collaborative interactive tools toward resolving environmental disputes was the focus of this thesis project. The objective of this project was to develop a methodology that promoted the collaboration between individuals and parties to reach a feasible site selection for contaminated dredged material. An interactive system would observe how and if individuals and groups changed their values-whether it be scientific, industrial, or preferential-to compromise and reach a consensus. The complements that highlighted the collaborative and interactive capabilities over the Internet were the integration of a GIS software package called ArcView and a centralized database. The methodology unified facets of collaboration towards consensus by addressing the human nature of interaction, and common information accessibility and analysis.
1.3
Hypothesis of Collaborative Interactive Systems
The fundamental theories of human decision-making explain the actions and decisions of people with their varying interests. I hypothesized that these fundamental assumptions could not be ignored and instead there was a co-operative interaction that evolved to determine the acts, decisions, and negotiations of the involved parties in selecting borrow pit sites. The methodology developed to promote collaboration for environmental site consensus could be used to test the hypothesis.
1.4 Benefits of Collaborative Interactive Systems
There were several benefits to an interactive, collaborative system, along with multiple observations gained. Fundamentally, the system was accessible to anyone on the Internet. This feature provided users with information and results regarding feasible disposal sites that normally would be hard to visualize and organize otherwise. The benefits of ArcView were that the project files took and filtered large amounts of data, and then graphically generated images that could be understood by a lay person. The information system challenged the boundaries of how software and programs have evolved so that computer scientists and specialists are not the only people who can develop a system that handles and manipulates large amounts of information.
The second benefit of the system tool would be in the data and insight received by observing how individuals interact with the system to reach a decision. The web-based system was developed to have as little bias as possible, thereby representing all issues equally. Any changes in decisions and original biases would be reflected in the data. The storage of the information created a profile of the user interactions and reasons. The information would be useful to policymakers in determining with whom, when, and if groups form alliances. Also, the interactive system would allow for potential collaboration between groups. Explanations and information provided by users could sway people to change their decision values. Most importantly, the data would show if the system were a functional tool to generate alliances and site consensus.
Chapter 2
2 Requirement Analysis
The objective of the requirement analysis stage is to collect more detailed requirements for the methodology and to establish a baseline architecture for the development of the system tool. The scope of the problem regarding site selection for the dredging is generally controversial. Therefore, this thesis project developed a collaborative methodology and system tool to catalyze the site selection process. To begin formulating and conceptualizing the methodology, the first step is to perform a requirement analysis. The focus of the analysis is to identify the developed system features and characteristics. Specifically, this chapter pinpoints the requirements for the system tool, how it was built, and the technology used.
2.1 System Accessibility and Interactivity
The accessibility and interactivity of the system is a key requirement. Being able to access the system builds the common ground for information sharing and analysis. As discussed earlier, interpreting volumes of environmental data often form discrepancies between results because people may manipulate them to represent their interests. Also, some analysis software is costly and unrealistic for the general public to purchase for their personal usage. Universal system accessibility allows the use and the ability to analyze the same data using software that is typically unavailable.
Interactivity of the shared data promotes a better understanding of the issue , and the interrelated nature of factors in data analysis. The system must engage the users-encouraging them to input data, see other values, change or store data. Through this
means, the system tool and methodology are more flexible and adaptable to the variants in human interaction and decision-making.
2.2
System Filtration and Presentation of Information
The system filtration and presentation of information generates and relays different forms of information to the relevant people. In general there are four types of information that are useful in a public debate: (1) data, (2) models, (3) preferences, and (4) conclusions (O'Hare 1987).
1. Data are facts and figures as a result of collection and testing. It is the accepted value of a physical constant. Engineers and scientists use numerical data to conduct analyses and formulations. For Boston Harbor, the data around the issues are collected as explanations, values, professional opinions, and observed results from experts. The compilation of data creates layers of information regarding specific issues around nautical features, recreation, and marine biota. These layers are weighted differently depending on public preferences, thus, generating another set of data that marks the distribution of importance and opinion towards site selection for dredged material (Fitzgerald 1998).
2. Conceptual models are explanations or mechanisms that involve a causal relationship. The data are assumed and do not have to be proven. Formulated models are verified and calibrated using collected data. Users of the system tool need information presented in comprehensible visual manners. Software packages such as ArcView map data input by the users and depict areas of higher suitability given their value selection.
3. Preferences are properties of individuals, and subject to change. Individual preferences for disposal of contaminated sediment in Boston Harbor are based on
economics, ecosystem, and values to create a range of preferred disposal options-offshore, nearshore, onshore.
4. Conclusions are decisions recommended by others. In Boston Harbor, regulations, costs, and public opinion motivate the conclusions of policymakers. In particular, it is in the best interest of policymakers to reach a consensus among the public to avoid lawsuits and time spent in litigation.
2.3
Data Storage and Retrieval
Data storage and retrieval allows for the creation and extraction from user profiles. The methodology included the recording of the interactions of the public to generate a profile. These recorded profiles would then be useful in exhibiting the impact and functionality of the system as a tool for collaboration. The responses would also be helpful for policymakers to see the preferences and interactions of the public. This feature holds the essence of collaboration and cooperation--if users can see other values and allow the
values to influence their own decisions towards weighed preferences.
2.4 System Scenarios
The ideal functionality of the system will support three scenarios: (1) cooperative, (2) competitive, and (3) what-if. Whether these scenarios are utilized depends on how the user interacts with the system--users are given options and choose their scenario.
(1) A cooperative system allows users to see the results of other users' decisions. It gives the user an idea of what the other person values. In true cooperation, users would then compromise or incorporate other interests in addition to their own. For example, the
lobstermen realize that in cooperating with recreational users, they will achieve preferred sites. The aspect of the system that will provide this feature will be in the option to see other users' values and results in the GIS page.
(2) In a competitive scenario, the user does not see the results of other users. If the system only supported a user to input their values and to see their results, it would be a true competitive scenario. There may be users who enter the system and only use it to input their values and nothing else. They may choose not to collaborate, not to re-simulate or see other values. For example if the lobstermen took an adamant stance to their site preferences, then they would not care about the other issues and would not factor those concerns in their site preferences.
(3) The "what-if' scenario allows a user to play with the system to see the impact of everyone's roles. It informs users on hypothetical scenarios and situations that later allow them to foresee and predict the influence of various issues. In the "what-if"' situations, extremes can be simulated and the breadth of outcomes is revealed. In this scenario, the lobstermen would change the weight of lobster habitat or other data layers in the simulation to see how it changes the site preferences. It provides a benchmark and a sense for options and alternatives.
2.5
Risks
It is important to recognize the risks associated in the creation and elaboration of a system tool and methodology. A large part of the requirement analysis poses questions that break down the system tool into a series of risks (Booch et al. 1997). Risks are obstacles that may hinder the performance and functionality of the system and methodology. Overcoming and recognizing the hurdles are critical to success. In general, there are three categories of risks that must be addressed:
(1) technological risks-These risks apply to the technology. How well does the technology and equipment work? Can the system tool actually deliver the functions that users need through a Web browser connected to a database?
(2) skill risks-- Human skills can also be a factor in the development of the system. Are the staff, talent, and expertise available?
(3) political risks-- Especially in value-added projects, political forces can be a hindrance in the use and creation of a system. Are there political forces that can get in the way and seriously affect the project? Funding, publicity, and visibility can all influence what is and is not included in the system. These socio-economic factors are powerful when they arise (Booch et al. 1997).
Technological risks definitely had a role in the development of the system. Sufficient hardware existed in terms of the computer, infrastructure, and architecture. Problems and delays existed in obtaining and installing the proper software. Because this is a rapidly growing area, several versions of the software were released in a few months, each having their own compatibility issues. Obtaining and installing the proper web server and browsers had a significant role on the functionality of the software. Ultimately, Internet Information Server 3.0 with Active Server Pages, Internet Explorer 3.0, ArcView 3.0a, FrontPage98, and Access97 were installed.
Traditionally, the engineers involved in building a system tool, such as the one created for this project, involve people with a strong computer science background. More recently, in an attempt to reach a broader spectrum of consumers, software companies have tried to make their packages extremely user friendly by decreasing the amount of programming necessary and general computer knowledge. The intent is to enable a person to link their knowledge, models, and tools to computer-based information systems. The drawback of this system is relying on the developer to identify and distinguish between system and technological problems. Other resources available to the developers are telephone software support and general knowledge from colleagues.
Since the system was not funded or planned to be integrated into the project, no political risks existed. However, should the system tool ever be used as a methodology for siting additional borrow pit areas, there may be social and public factors which challenge the acceptance of the tool. For example there may be biases as to the number and types of
people to enter and use the system. Also, there may be accessibility issues and questions regarding the assumptions made in collecting and creating the data layers.
Chapter 3
3 Theories on Decision Making and Negotiation
A collaborative methodology provides a tool which helps increase interactivity, awareness, and communication to reach a consensus for decisions such as site selection for dredged material disposal. In order for the tool to be effective, an understanding of human actions towards decision making and negotiation is necessary. This knowledge provides an insight to how and why users will act, thus, alluding to the reasons for each component of the collaborative system.
3.1 Game Theory
Game theory provides a quantitative logic and explanation for the social interactions of individuals. How people behave in society is a constant stream of strategic decisions. The interaction of decisions effect thinking and actions. One of the branches of social science that studies strategic decision making is called game theory. Many types of games such as chess, advertising, and sports are encompassed in this theory. The binding element in these games is that one does not act in a vacuum. The essence of a game of strategy is the interdependence of the players' decisions.
There are two traditional forms of game theory: strategic (sequential) and extensive (simultaneous). For a strategic form, the model is comprised of three things: (1) a list of participants or players (2) a list of strategies for each player, and (3) a list of payoffs that the players must receive for each array of strategies, one for each player (Kreps 1990).
The players make alternating moves. Each player, when it is his/her turn, must look ahead to how his/her current actions will affect the future actions of other, and his/her own future actions in turn. An example of this sort of game is tic-tac-toe. In anticipating the rival's response, a player looks ahead and reasons back. A general point is that for this principle to apply, it is essential that earlier moves be observable to those who choose
later.
The second type of model of a game is the extensive form game where the key features are 1) the timing of actions which players may take, and 2) the information they will have when they must take those actions. The popular game of 'rock, paper, scissors' is an example of this form, and the traditional prisoner's dilemma (Dixit & Nalebuff 1994). In the extensive form, players respond at the same time, ignorant of the other players' current actions. However, each must be aware that there are other active players, who in
turn, are similarly aware and so on.
The collaborative methodology developed for evaluating responses to the siting of dredged material is of the strategic form. All the features of the strategic model are represented in the collaborative methodology. The players can identify the other groups of players represented (environmental advocate, interested public, shipping industry, among others) and have access to their strategies (weighed values for site preferences). The capabilities of the ArcView simulation scripts show how the payoffs of the weighted values relate to the players.
Regardless of form, game theory has two fundamental assumptions that must be noted: 1) everyone plays to maximize their best interest and gain the most 2) everyone plays only their interest and does not consider the interests of others. This theory would work if it were applied to situations such as competitive markets where a company is entering and competing with others in the same niche. More frequently, this theory is applied to situations where the assumptions are not valid and instead a model of cooperative game theory evolves.
3.2
Co-operative Game Theory
Adam Smith (1976) examined the nature and cause of wealthy nations and described an invisible hand that guided people to pursue their own interest, and in doing so the outcome would be the best of all possible worlds. In reality, there are caveats and exceptions to the rule of the invisible hand. For example there are limited resources in the cases of environmental commons-global areas that are available, accessible, and consumed by anyone such as air and water. The tragedy of the commons manifests itself when people unknowingly or unconsciously ruin the commons when having the freedom to use it in their individual best interest (Scarlett 1997). This examples shows that if everyone acts within their best interest, it will bring ruin to the commons and the end result will be in no one's best interest. Therefore it is best to apply a co-operative game theory strategy.
In the situation of cooperative game theory, two parties form alliances to generate a situation that works out best for both of them (Dixit & Nalebuff 1994). These are situations where feasible or realistic solutions do not arise when playing in individual best interest or if players do not want to maximize their gains. In cooperative game theory, groups form alliances to create and to realize outcomes that benefit and satisfy both parties. The problem that arises are the understandings of how these alliances are created, how faithful the groups are to each other, and how to evaluate the fairness and equity of the decisions reached. Broad assumptions must be made because it is not known how and why values are assigned, especially when alliances are formed.
In the case of Boston Harbor, the "game" is a simulation that highlights viable sites for capping. It would be unrealistic to assume that people have not already formed verbal or non-verbal alliances. It is the natural human interaction for people to talk to one another about their interests and preferences. Therefore, when they simulate the selection of
Alliances formed by groups can be a web of possibilities. Understanding each solution for the groups-best and worst case scenarios--can be an even more complicated task. In assuming that alliances are formed, the evaluation of solutions needs to consider if the alliances are isolated incidents, or if there is indeed an entire network of influence effecting an individual decision.
3.3 Environmental Negotiation and Conflict Resolution
The outcomes from decision making using game theory is either (1) site selection reached, or (2) no site selection is reached. However, a consensus must be reached in site selection issues and game theory does not account for this. Environmental negotiation and conflict resolution acknowledges that consensus must be reached and that "no site selection" is not an option. Environmental negotiation is defined as a game. "It is a most serious game that people use to decide the quality of their air, of their water, of their soil, and of the life around them. It is the cumulative outcome of these most important games that will determine the quality of human life and the future of all life in our world" (Gorzynski 1991). As in any game, there are players, styles, strategies and tactics to environmental negotiation. Environmental negotiations are multi-disciplinary--combining elements of science and engineering, politics and government, public health and sensitivities, economic theory and marketplace reality.
An approach to negotiation is interactive bargaining. The strategy is to search for both tangible and intangible items to trade or to make deals. It is the deliberate aim or environmental negotiation to incorporate a wide variety of stakeholders. The constructive exploitation of groups with differing values on items creates a situation where all can gain. Hence, the limiting factor is the availability of items, or feasibility of the deals. The success of integrative bargaining is the cooperation and collaboration between parties, where they view each other as mutually dependent. Desired situations rest on the
The success of integrative bargaining is the cooperation and collaboration between parties, where they view each other as mutually dependent. Desired situations rest on the indispensable actions of everyone involved. Such collaboration promotes trust and positive relationships. This emotional and psychological climate strengthens the process that was initiated with the avowed goal of 'togetherness" (Glasbergen 1995). The collaborative methodology adopts this approach to negotiation. The ability of the system to represent hypothetical scenarios and to link all the weighted values in mapping feasible regions exemplifies the understanding that all the parties are mutually dependent. In the collaborative system, however, the amount of interaction and collaboration will be to the choice of the player.
3.3.1 Escalation and Entrapment
Collaboration can be difficult because of psychological barriers that are explained as escalation and entrapment. Emotions can override the ability to reason. A classic example of this is the dollar bill auction. In this scenario, a mediator auctions a dollar bill to the highest bidder. The catch is that the second highest bidder must pay the mediator the amount of their losing bid, and bidders are not allowed to communicate with one another. The participants, as soon as they go over $0.50 are trapped in a pattern of escalation. Once the bids exceed $1, both parties are trapped and locked into destructive bids that are hard to escape. And the same is true of distributional disputes where a conflict of desire, to advance self-interests, leads to disaster. When such conflicts arise, psychological and emotional patterns rise and the situation becomes hard to diffuse. Since it is easy to lose control over these situations, it is suggested that participants pay close attention to escalations of emotions (Susskind et al. 1978).
The BHNIP saw a similar scenario of escalation and entrapment where the emotions of the public prevented conflict resolution. In deciding on a containment or treatment method for the contaminated sediment, the public rejected five preferred alternatives
frustrations raise, the range of acceptable alternatives chosen by the USACE and Massport was narrow. Too narrow, perhaps, because the BHNIP was forced to create additional alternatives that had many pros and cons already represented in the first presented set (USACE & Massport 1995).
3.3.2 Effective Consensus Building
Fortunately, approaches to resolving environmental disputes have been developed and tested over the past few years. These tools are negotiated approaches to consensus building. The consensus requires informal, interaction of stakeholder groups and a
voluntary effort to seek "all gain' versus "win-lose" situations. Consensual solutions are better-and will be accepted-only if all the stakeholder parties are confident they will get more from a negotiated agreement that they would from unilateral action, or from conventional means for resolving distributional disputes.
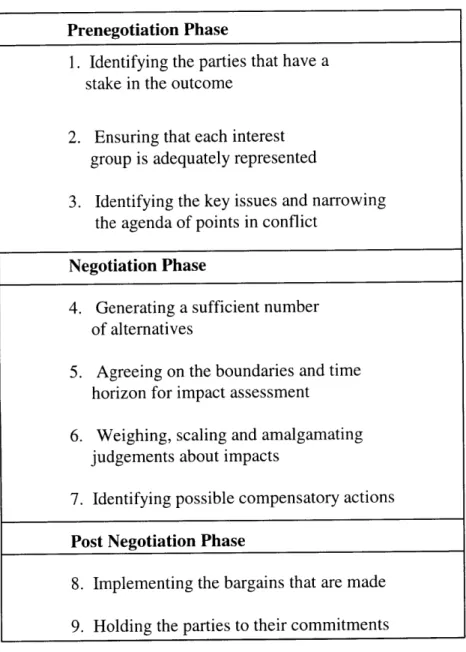
Distributional disputes involve several parties and are therefore more difficult to successfully manage. Most distributional disputes require an intermediary who provides nonpartisan assistance at key steps of the negotiation process. Such situations are deemed assisted negotiations. Unassisted negotiation means that no one has been asked to manage the process of negotiating. There is no mediator, rather people work on mutually agreed terms to resolve issues. Assisted or not, negotiations must go through three phases: Pre-negotiation, negotiation, and post negotiation (Susskind et al. 1978). Within each phase there are several steps that must occur. These steps produce agreements that are not challenged in court and likely to be less expensive and more responsive. Resolutions must be handled effectively as the problems turn into creative problem-solving situations. The approach in Table 3-1 transcends the failures of the existing market mechanisms and provides desirable alternatives (Susskind et al. 1978).
Table 3-1: Negotiation Flow Process (Susskind et al. 1978) Prenegotiation Phase
1. Identifying the parties that have a stake in the outcome
2. Ensuring that each interest group is adequately represented
3. Identifying the key issues and narrowing the agenda of points in conflict
Negotiation Phase
4. Generating a sufficient number of alternatives
5. Agreeing on the boundaries and time horizon for impact assessment
6. Weighing, scaling and amalgamating judgements about impacts
7. Identifying possible compensatory actions Post Negotiation Phase
8. Implementing the bargains that are made 9. Holding the parties to their commitments
Chapter 4
4 Related Research and Literature Review
As technology drives changes in behavior, there has been an increasing trend to develop tools that promote collaboration and site consensus-such as the goals of this project. Few have combined the two. This chapter discusses the case studies of some of these tools.
4.1
Collaborative Software and Methodology for the
Environment
The forefront of activity in the information age revolves around the interactivity and collaboration of people using software packages such as Lotus Notes and accessing the Internet. This concept can be applied to handling the amount of information and negotiation surrounding environmental disputes. Leveraging the Internet as a medium to generate discussion and to promote consensus may make the process less troublesome.
4.1.1 Urban Planning and Riverfront 2000
Since computers enable people to communicate and share resources quickly, it has become increasingly popular in the urban planning process. Recently, efforts to share and to discuss issues over the Internet have been used by urban planners to inform the public and bring them together on a common issue such as Riverfront 2000.
The director of research for the Community Development Agency in St. Louis, Missouri, Charles Kindleberger, and a number of experts in hypermedia produced a system called Riverfront 2000 to plan for the future development of St. Louis' 19 miles of Mississippi River shoreline. The objective of the system was to provide environmental, historical, and land use information of potential development sites on the Mississippi River front.
Riverfront 2000 not only provided text, but also maps and videos of the area-thus, illustrating advantages and disadvantages of a location. Information was available to a user by clicking a button on a location along the river. This flexibility allowed for the exploration of "what-if" scenarios as well as reports by "cutting and pasting" in the word-processing mode (Wiggins & Schiffer 1990). Without Riverfront 2000, urban planners would be forced to conduct site visits and to collect all relevant information when discussing a particular area at once. Instead, the St. Louis City Planning Agency established a community network accessible in the neighborhood community centers. Computer-mediated communication facilitated collective action since it reduced group organization transaction costs.
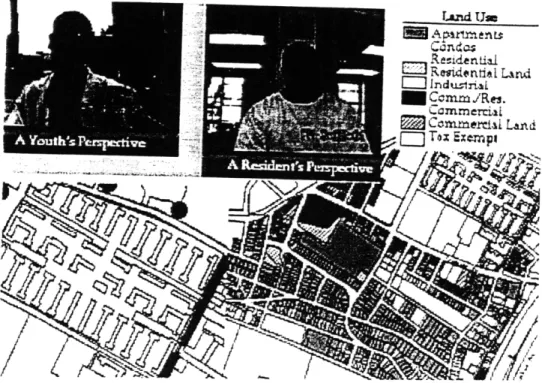
Systems like Riverfront 2000 allow synchronous and asynchronous communication between people and groups of people. Email, chats, bulletins, and postings all provide the means for such communication. But Riverfront 2000's main focus was to post and to retrieve information through a hypermedia context. Where hypermedia is defined as "allowing one to combine interactive video, maps, animation, text, graphics, sound, and statistical data in a non-linear format" (Wiggins & Schiffer 1990). Figure 4-1 shows a how two people might interact with a map of the site and land use (Wiggins & Schiffer 1990). In the figure there are two people representing a youth and resident perspective. The idea is for the two individuals to interact and to discuss how they wish for the land to be used, utilizing the map on the computer.
Land U= nd Re-iduntit F Reiidondati LandI [ lndu..rinl
m
CnmmJRe. .ammercLl m Comtutei Lanxd = F Tax ExiFigure 4-1: Interaction for Land Use Map (Wiggins & Shiffer 1990)
4.1.2 Design Rationale
Collaborative systems have also been used for conflict resolution in project management. Especially in large-scale engineering projects, the need to share information is enormous. Design specifications and drawings are often too large, intricate, and lack means to show how the design and decisions were made. Tools are being generated, among other objectives to 1) facilitate effective coordination across engineering disciplines 2) capture process and decision rationale, 3) forecast impact of design decisions (Pefia-Mora et al. 1995)
In particular, the Intelligent Engineering Systems Laboratory (IESL) at MIT developed a mitigation system. The Design Recommendation Intent Model (DRIM) captures and manages the design rationale of software development in order to support conflict mitigation. To date, the efforts and focus of the IESL team at MIT is through multiple participants-computer-supported conflict-mitigation-active computer support design rationale.
4.2 Disposal Sites for Dredged Sediment
As mentioned earlier, dredging activity in waterways, coasts, and harbors maintains navigation for commercial and recreational uses. For urban harbors and ports, the management and disposal of contaminated dredged sediment involves reaching public consensus for short and long-term solutions. In general there are three categories for disposal: upland, nearshore, and aquatic. Upland involves stabilizing the sediment and then disposing it off site. Upland uses of dredged sediment include landfill cover, construction fill, road base material, concrete blocks, and vaults. Nearshore involves sequestering sediment behind barriers. The other disposal strategy is aquatic. Preferred disposal options for Boston Harbor are aquatic disposal (unconfined offshore) for both clean and contaminated sediments (in-channel, capped). The focus of following case studies will highlight the environmental consequences, actions, agencies, and public sentiments related to aquatic disposal sites options.
4.2.1 New York/New Jersey Harbor
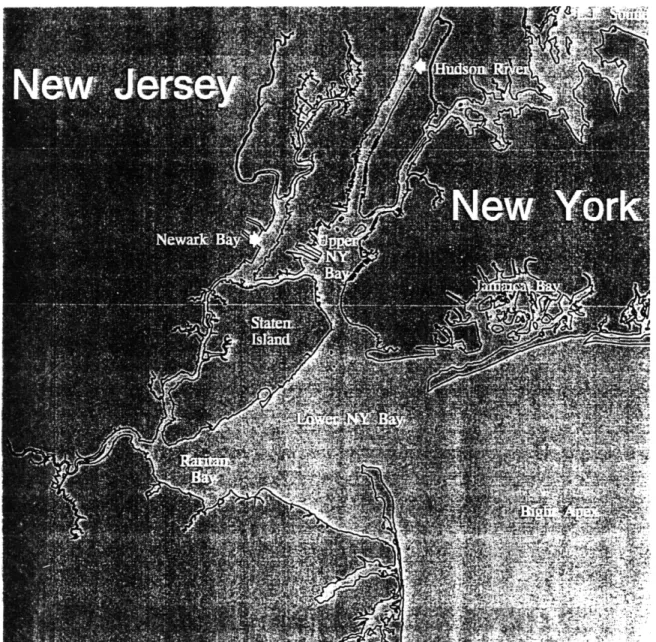
The debate between business and environmental groups over the dredging of New York/ New Jersey harbors has been long and heated. Since 1973, the Mud Dump Site, an approximately two-square-nautical mile area was used to dump dredged sediment. Thirty dredging projects in the port were authorized by the USACE resulting in the removal of 6.8 million cubic yards of dredged material. Two million cubic yards were used for upland construction projects while the remaining 4.8 million cubic yards were authorized to be disposed of at the Mud Dump Site (USACE NY 1996). September 1997 signaled the last scow to the Mud Dump Site carrying contaminated sediment. Legislative action in the Clinton administration prohibited dumping at sea dredged sediment from New York Harbor and the Upper Newark. At a result, the Army Corps of Engineers has suggested the construction of sub-aqueous pits and containment areas close to shore and
upland disposal for additional dredged sediment. Figure 4-1 shows the study area for the New York/ New Jersey area (NDEP 1997).
However, controversy and negative public sentiment over the selected option continues with volatile emotions and restraining orders to halt activity. The outcome of the case is being closely monitored for valuable lessons that may be applied to other projects. Environmental activists in New York explain that U.S. ports lag behind other industrial sectors when it comes to treatment and disposal of environmentally dangerous materials. The public outcry of "not in my backyard" has been a theme that has led to the public involvement in the dredging projects at every level of the permitting process (NJMR
1996).
Meanwhile, the industry has a different perspective. Representatives of the American Association of Port Authorities describe ports nationwide as having reached "crisis proportions". A survey carried out by the association last year indicated that two thirds of US ports rated environmental problems as the most serious issue facing them (Cottrill 1993). The industry claims that regulations have become overly stringent, and in doing so have effected the viability of ports and the business associated with them.
The current outreach method used by the New York/New Jersey Harbor region to gain community acceptance is through a program by Institute of Marine and Coastal Sciences at Rutgers University and Brookhaven National Laboratories process (NJMR 1996). The project identifies, evaluates, and demonstrates technologies to the public. The goals are first to engage the public in a variety of forums to discuss the costs, benefits, impacts, and issues associated with decontamination strategies. They want to inform the public and to help them understand the scope of technologies and options. More importantly, the project aims to initiate discussion on the siting of future decontamination facilities. Public outreach efforts are designed to ensure that potential host communities receive the best information available on decontamination technologies leading to the informed decisions on the future management of containment dredged materials.
There is a range of approaches to establish and to maintain a dialogue between the parties. The targeted citizenry are elected local officials who require the best available
information to address questions related to siting, economics, and environmental issues. These approaches include making formal presentations, hosting public meetings, facilitating informal discussion groups, and establishing citizens advisory committees (NJMR 1996). This approach has also been used in Massachusetts to facilitate the decisions to use in-channel disposal sites with capping.
Chapter
5
5
System Tool Model
After analyzing the problem and defining the requirements, integrating an understanding human decision making and negotiation, and finally, reading up on similar case studies, the model for the information tool was developed. This chapter examines where the information lies and what the information contains. The system tool model shows the attributes and characteristics of information held within a case. Moreover, it shows the relationships and links between the entities. In this model, users, site selection, and data storage holds the essential information needed by everyday users. Figure 5-1 shows the attributes and relationships for the system tool model in UML language.
DATABASE storage query tables forms
Figure 5-1: System Tool Model DATA
collect numerical values quantified justification compiled as layers input values SITE SELECTION data manipulation graphs/visuals
custom script/ Avenue
USER background
numerical preferences interaction
5.1 Data
The data were collected and compiled from several resources. In terms of the topological data containing longitudes and latitudes, land boundaries, and coastal areas, the data were obtained from United States Geological Survey (USGS) and Massachusetts GIS database. These are all input as numerical values or characterized by labels.
There was also data transposed from human value to quantified values, by nature the information was not quantifiable. Explanations supplied by experts or knowledgeable individuals and groups provided the numerical data by ranking the values. These experts put a quantified value on qualitative data. These quantified values are explained and justified in the explanations compiled by Scott Fitzgerald and a few examples of bathymetry and currents are shown in Appendix A (Fitzgerald 1998). This transformation of information was a potential area for bias as the numerical data was based on human judgement. However, for each issue (lobster, eelgrass, shellfish, nautical features, etc.) a respected and trusted group or representative was selected to quantify the data. Their reasons were outlined in the explanations that were accessible to all the users.
5.2
Site Selection
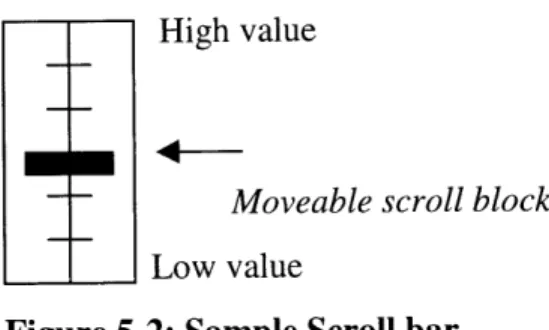
Site selection results from manipulated, filtered, and mapped data. The preferred option is to take data and convert it to the ArcView files and internal databases. The software package is user friendly and can rapidly graph data. The application developed by Scott Fitzgerald (1998) customized scripts in Avenue that allowed interaction with the system tool. The scripts created a dialog box where users moved scroll bars to change the importance of a data layer. Figure 5-2 shows a sample scroll bar. Each layer (lobster, eelgrass, shellfish, nautical features, etc.) was represented by a scroll bar. The categories are physical harbor features, marine biota, and miscellaneous recreation. Internally, the
system interprets users' "high values", "low values", and "mid-values" and translates them into corresponding numerical values.
High value
Moveable scroll block Low value
Figure 5-2: Sample Scroll bar
Once all the user values were placed on each category, the graphing feature of the application utilized the numerical values for the data and graphed it onto a map of Boston Harbor. The results were a color gradient showing the feasible regions in the harbor for borrow pits. The site selection feature and project developed by Scott Fitzgerald (1998) was the common analysis tool for the data. No external data could be added or included without administrators changing the data handling of ArcView. The ArcView project was a management tool that allowed all users to access the same data layers and used the same manipulation tools. In a system where user choices are saved, users could compare and contrast their results (from the color gradient) with others and contribute their site preferences.
5.3
User Profile
The user profiles contained the background information and site preferences. The background consisted of relevant experience, education, representative group, interests, harbor usage, and related areas of interest. This information could be useful to policymakers in understanding the context of how users value the resource and dredging of harbors. How users interact could be interpreted from the responses and changes in the outcomes based on other user responses. As discussed earlier, game theory describes scenarios when users pick sites in their best interest.
The user profiles may explain why users choose their site selection preferences based on the site selection model. Any interaction or collaboration with other values and the system in general could be recorded and stored in the databases of profiles. If users logged in several times, or if they reran the simulation often, the iterations would be recorded and policymakers would have a better understanding of what issues and values the users were considering. As a backup to the statistics that correlate the motives behind user interaction, a survey was posted right before logout. The answers to the survey were reflected in the profile and specifically asked the user if any values were changed regarding issues, who influenced them, and in what way (increased value, decreased value). And most importantly, the survey asked if the change occurred (before, during, or after entering the site) and prompted the user to select the time period. This information would be necessary to determine whether or not the system was effective in bringing about change, interaction, and collaboration towards the site preferences and would be a large stride towards accomplishing site consensus.
5.4
Database
Tracking and recording the motives to user interaction once they have accessed the site selection model was a difficult task as noted in the development of this system and in other research. Information regarding how users interacted with their options was stored in a database. The data could then be placed in tables, and subsequent queries and summary reports could be performed and created. In other words, the opinions and the amount of interchange between the public groups would be noted with its respective reason and justifications. The storage feature allowed for queries that could be extrapolated from the database system and into the simulation model. For example, if a user wanted to see the preferred values of all interested public, a query to the database for the representing group (interested public) would return their preferred values.
The relevant stored information that is needed by policymakers has yet to be determined. However, in initially creating the database infrastructure and collecting an array of information, it would be easier to query the system and to add to the tables of information in order to generate requested information as forms and reports. Database software packages such as Microsoft Access are designed to handle large amounts of data and are capable of customizing reports, and successfully querying the tables of user profiles.
Chapter 6
6 Methodology for Collaboration
in Environmental Site Selection
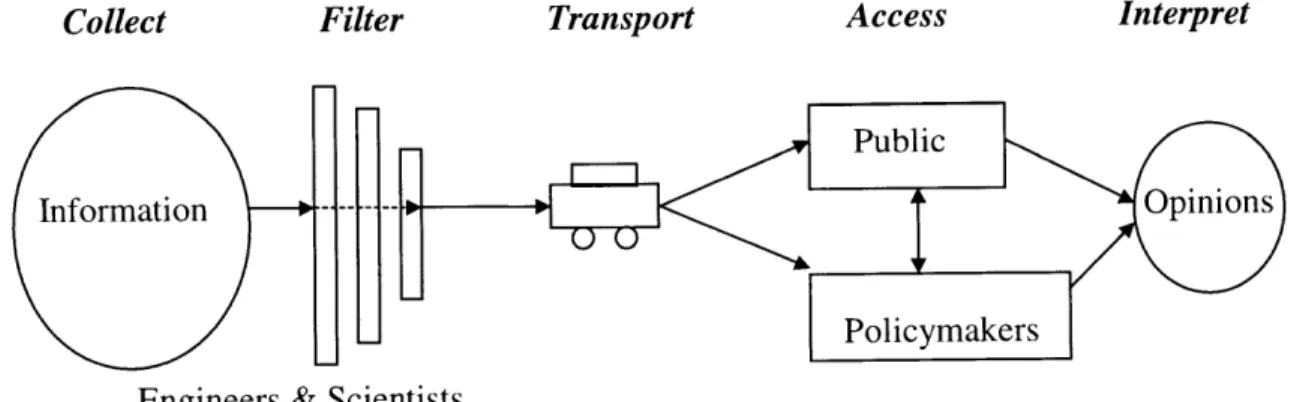
This chapter describes a general methodology for information processing and identifies the flow framework of the system tool model. The filtering and the distribution of information were essential features to the system because of the varying types of information and people participating. There are four processes for the information processing: (1) collect, (2) filter, (3) transport, (4) access, and (5) interpret. Intertwined in the process are three primary groups who will handle the information: engineers and scientists, public, and policymakers/authorities. Figure 6-1 depicts the flow of how these groups would enter the system and interact with each component of it.
Collect Filter Transport Access Interpret
Engineers & Scientists