HAL Id: hal-02266575
https://hal.archives-ouvertes.fr/hal-02266575
Submitted on 14 Aug 2019
HAL is a multi-disciplinary open access
archive for the deposit and dissemination of
sci-entific research documents, whether they are
pub-lished or not. The documents may come from
teaching and research institutions in France or
abroad, or from public or private research centers.
L’archive ouverte pluridisciplinaire HAL, est
destinée au dépôt et à la diffusion de documents
scientifiques de niveau recherche, publiés ou non,
émanant des établissements d’enseignement et de
recherche français ou étrangers, des laboratoires
publics ou privés.
host
Aonghus Lavelle, Thomas Walter Hoffmann, Hang-Phuong Pham, Philippe
Langella, Eric Guedon, Harry Sokol
To cite this version:
Aonghus Lavelle, Thomas Walter Hoffmann, Hang-Phuong Pham, Philippe Langella, Eric Guedon, et
al.. Baseline microbiota composition modulates antibiotic-mediated effects on the gut microbiota and
host. Microbiome, BioMed Central, 2019, 7 (111), �10.1186/s40168-019-0725-3�. �hal-02266575�
R E S E A R C H
Open Access
Baseline microbiota composition modulates
antibiotic-mediated effects on the gut
microbiota and host
Aonghus Lavelle
1, Thomas Walter Hoffmann
2, Hang-Phuong Pham
3, Philippe Langella
2, Eric Guédon
4and
Harry Sokol
1,2,5*Abstract
Background: Normal mammalian development and homeostasis are dependent upon the gut microbiota. Antibiotics, essential for the treatment and prophylaxis of bacterial infections, can have collateral effects on the gut microbiota composition, which can in turn have far-reaching and potentially deleterious consequences for the host. However, the magnitude and duration of such collateral effects appear to vary between individuals. Furthermore, the degree to which such perturbations affect the host response is currently unclear. We aimed to test the hypothesis that different human microbiomes have different responses to a commonly prescribed antibiotic and that these differences may impact the host response.
Methods: Germ-free mice (n = 30) humanized with the microbiota of two unrelated donors (A and B) were subjected to a 7-day antibiotic challenge with amoxicillin-clavulanate (“co-amoxiclav”). Microbiome and colonic transcriptome analysis was performed, pre (day 0) and post antibiotics (day 8) and subsequently into recovery (days 11 and 18).
Results: Unique community profiles were evident depending upon the donor, with donor A recipient mice being dominated by Prevotella and Faecalibacterium and donor B recipient mice dominated by Bacteroides and Parabacteroides. Donor A mice underwent a marked destabilization of their microbiota following antibiotic treatment, while donor B mice maintained a more stable profile. Dramatic and overlapping alterations in the host transcriptome were apparent following antibiotic challenge in both groups. Despite this overlap, donor A mice experienced a more significant alteration in gene expression and uniquely showed correlations between host pathways and key microbial genera.
Conclusions: Germ-free mice humanized by different donor microbiotas maintain distinct microbiome profiles, which respond in distinct ways to antibiotic challenge and evince host responses that parallel microbiome disequilibrium. These results suggest that inter-individual variation in the gut microbiota may contribute to personalized host responses following microbiota perturbation.
Keywords: Microbiome, Antibiotics, Transcriptome, Gut
© The Author(s). 2019 Open Access This article is distributed under the terms of the Creative Commons Attribution 4.0 International License (http://creativecommons.org/licenses/by/4.0/), which permits unrestricted use, distribution, and reproduction in any medium, provided you give appropriate credit to the original author(s) and the source, provide a link to the Creative Commons license, and indicate if changes were made. The Creative Commons Public Domain Dedication waiver (http://creativecommons.org/publicdomain/zero/1.0/) applies to the data made available in this article, unless otherwise stated.
* Correspondence:[email protected]
1Sorbonne Université, INSERM, Saint-Antoine Research Center (CRSA), Paris,
France
2INRA, UMR1319 Micalis, AgroParisTech, Jouy-en-Josas, France
Background
The mammalian microbiome incorporates a vast and di-verse range of microorganisms that have co-evolved to live with us, contributing essential functions through their col-lective genetic and metabolic repertoire [1]. Ecological di-versity and inter-individual variation are hallmarks of the healthy gut microbiome [2] and appropriate assembly of microbial communities in infancy and their maintenance in adulthood is of critical importance for metabolic [3] and immune [4] maturation, with the microbiome playing a role in both immune education and homeostasis. Many common environmental exposures can have demonstrable effects on the microbiome, including mode of birth deliv-ery [5], antibiotic use [6, 7], reduced dietary diversity [8], and prescription medications [9], and some associations with these exposures and subsequent development of im-mune, inflammatory, or metabolic conditions have been made [7,8,10–13].
Antibiotic treatment, one of the fundamental medical achievements of the past century, represents a notable ex-ample of microbiome perturbation, with rapid and some-times enduring changes to the community structure [14]. Antibiotic administration during the neonatal “window period”—when the gut microbiota is in part responsible for immune education [15]—may have long-term
conse-quences, and early life antibiotics have been associated with increased risk of asthma, obesity, and Crohn’s disease [6,7,11,16]. Furthermore, antibiotic use is directly associ-ated with the development of vancomycin-resistant Enterococcus(VRE)[17], recurrent Clostridium difficile in-fection (CDI)[18], and the emergence of antibiotic resist-ance as a global health threat [19]. Notably, response and recovery of human gut microbiota communities following antibiotic treatment can be highly variable between indi-viduals, as described in the context of responses to the antibiotic ciprofloxacin [20] and the routine prescription of antibiotics clarithromycin and metronidazole for the treatment of Helicobacter pylori infection [21]. Whether such changes are restricted to the microbiota or result in a downstream alteration in intestinal host response as well is not currently clear.
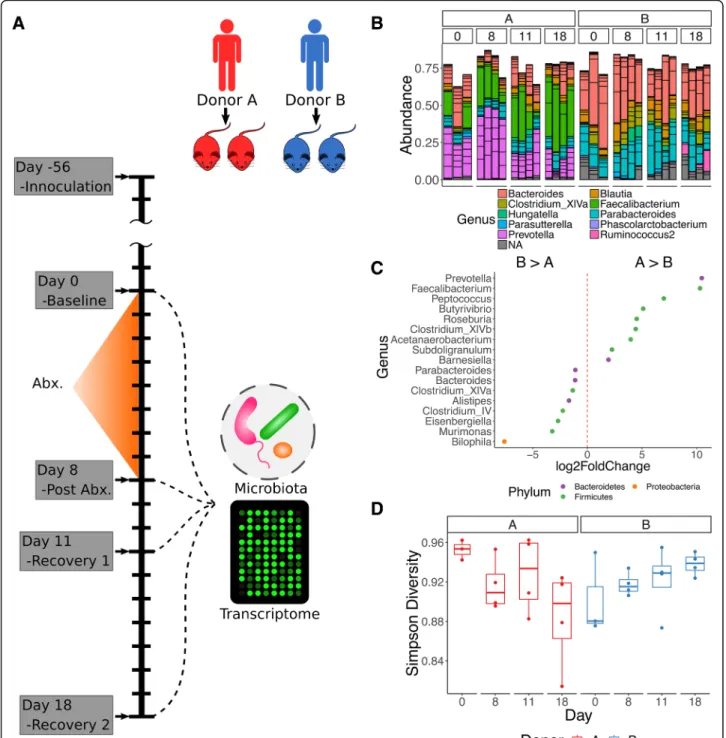
Due to the importance of the microbiota for host homeostasis and the marked collateral effects of antibi-otics on the microbiota, we posed the questions: (a) can antibiotic administration result in correlated fluctuations of the microbiota and host colonic transcriptome? and (b) if so, is there evidence of a personalized response? To an-swer these questions, we characterized the microbiota and the colonic transcriptome of germ-free mice (GFM) hu-manized with fecal samples from two unrelated healthy human donors, before and after treatment with the broad-spectrum antibiotic amoxicillin-clavulanate (i.e., co-amox-iclav), commonly used to treat various infections in clin-ical practice (Fig.1a).
Results
In total, samples from 30 mice passed quality controls, 15 in each group. One animal from the donor B group at day 0 (D0) was excluded due to low microarray signal intensity values. Four hundred fifty-four OTUs (oper-ational taxonomic units—see the “Methods” section for the definition as we used the dada2 pipeline [22]), were identified following filtering and were assigned to 51 genera (mean sequences per sample following filtering 6089, range 4219–8835, rarefaction curves presented in Additional file1: Figure S1A).
Baseline microbiome composition modulates
susceptibility and recovery following antibiotics exposure
Donor A recipient mice (donor A mice) had a markedly different community compared to mice from donor B. Donor A mice had a microbiota composition dominated by Prevotella (mean 26.6% (SD 13.6%)) and Faecalibacter-ium (mean 24.9% (SD 12.5%)), with Bacteroides (mean 17.3% (SD 7.8%)) being the third most dominant genus (Additional file2). In donor B mice, the dominant genera were Bacteroides (mean 37.9% (SD 12.2%)) and Parabac-teroides(mean 19.6% (SD 7.6%)), with less than 1% mean abundance of both Faecalibacterium and Prevotella (Fig.
1b, c). Samples for each donor were aggregated at each time point and submitted to enterotype clustering with the MetaHIT data set [23,24] (following manual filtering to assure all genera matched) (Additional file 1: Figure S1B). This confirmed clustering of donor A mice with the Prevotella enterotype and donor B mice with the Bacter-oides enterotype. Online reference-based enterotyping [25] similarly classified these samples to the Prevotella and Bacteroides enterotypes.
The response to antibiotic administration was markedly different between the two donor groups. Immediately fol-lowing co-amoxiclav treatment (D8—day 8), donor A mice demonstrated an increase in Prevotella sequences from baseline (D0) (from mean 27.4% (SD 5.9%) to mean 44.9% (SD 3.7%)) with a significant reduction in this genus by late recovery (mean 13.9% (SD 7.7%)) and a corre-sponding increase in Faecalibacterium OTUs at these time points (D0—mean 13.1% (SD 10.5%), D8—mean 21.3% (SD 5%), D11 (day 11)—mean 23.6% (SD 13%), D18 (day 18)—mean 38.5% (SD 7.4%); Fig. 1b, Additional file
2). There was a trend of decreasing proportional abun-dance in Bacteroides throughout the study in the donor B group, although this did not reach significance at any time point (D0—49.3% (SD 17.5%), D8—40.9% (SD 9.7%), D11—31.9% (SD 12%), D18—32.2% (SD 4%)), while Para-bacteroides remained largely stable throughout (Add-itional file 2). Diversity was not significantly altered by antibiotic treatment (Fig.1d, Additional file3). Comparing different time points using DESeq2 for donor A mice, there was a significant reduction in Clostridium XIVb at
D8 from baseline (D0), a significant reduction in Rose-buriaat D8 from D0, a significant reduction in Prevotella between D8 and D18, a significant increase in Blautia at D18 compared to D8, and a significant increase in Dorea at D18 compared to D8 (Fig.2a).
In contrast to donor A mice, only one genus, Rumino-coccus, increased significantly in donor B mice at D18 (Fig. 2b). Overall, there was a much more marked
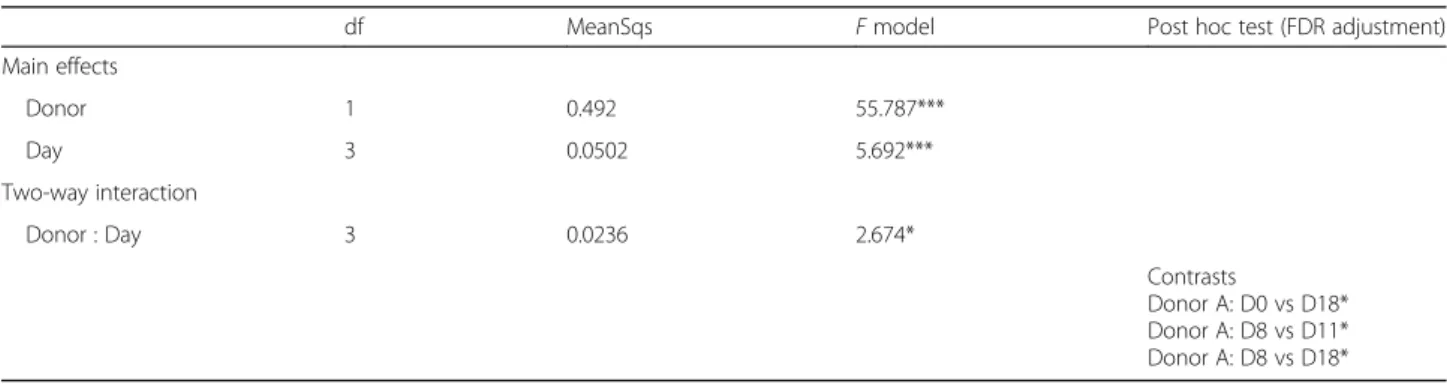
disruption of the community structure in mice from donor A mice when compared to donor B mice, evident in PCoA plots of weighted unifrac distance (Fig.2c). To determine if there was a significant difference in terms of the effect of donor and day post antibiotics, we performed a two-way PERMANOVA, which indicated a significant interaction between donor and day (Table1). A post hoc analysis demonstrated differences only for donor A, at
Fig. 1 a Schematic of study design, including donor groups, antibiotic treatment, and recovery period as well as sampling points. b Barplots of relative genus-level abundance of the 50 most abundant OTUs in each sample. c Differentially abundant genera by DESeq2 between donor groups, including all time points. d Simpson diversity stratified by donor and time point
Fig. 2 a Genera differentially abundant (adjusted P value < 0.01) in donor A mice by DESeq2. b Similar to a but for donor B mice. c Weighted unifrac distance with per group. Results of the corresponding two-way PERMANOVA are presented in Table1. d PCoA of weighted unifrac distances for donor A alone, with genera that correlate significantly with PCoA axes (Spearman’s correlation, P value after correction 0.1) and PERMANOVA R2
and P value for univariate comparison. e PCoA for donor B as in d with weighted unifrac distances. No significant correlations were present. PERMANOVA R2
and P value for univariate comparison
Table 1 Results of two-way PERMANOVA of weighted unifrac distances (random seed for rooting tree, 1234). P values (***< 0.001, *< 0.05)
df MeanSqs F model Post hoc test (FDR adjustment) Main effects Donor 1 0.492 55.787*** Day 3 0.0502 5.692*** Two-way interaction Donor : Day 3 0.0236 2.674* Contrasts Donor A: D0 vs D18* Donor A: D8 vs D11* Donor A: D8 vs D18*
pairwise contrasts between D0 vs D18, D8 vs D11, and D8 vs D18 (false discovery rate (FDR) P values < 0.05). Correl-ation of the PCoA scores with genera demonstrated a correlation between a number of key taxa, including Pre-votellaand Faecalibacterium, associated with the changes in donor A mice (Fig. 2d). No correlations were evident for donor B mice (Fig.2e). While we did not have a no-antibiotic control group, we designed the study such that antibiotic-induced changes to the microbiota must occur independently in two cages. To ensure this was the case, we used a distance-based method to determine if within-cage differences over time (Additional file4: Figure S2A) were significantly different from time point-specific dis-tances, including between-cage effects at D8 (post antibi-otics) (Additional file 4: Figure S2B and S2C). We observed a significant shrinking in the distance post anti-biotics in donor A mice but did not observe a similar
reduction in donor B mice, suggesting that the effects of antibiotics in this group were not above the baseline within-cage variability over the course of the study (Add-itional file4: Figure S2C).
Taken together, these results demonstrated a marked effect of co-amoxiclav administration on the microbiota of donor A mice, with notable shifts in the dominant genus Prevotella and a number of less abundant genera. In contrast, the microbiota profile of donor B mice remained relatively unaffected.
Antibiotics induce dramatic changes on host
transcriptome, which overlap independently of baseline microbiota composition
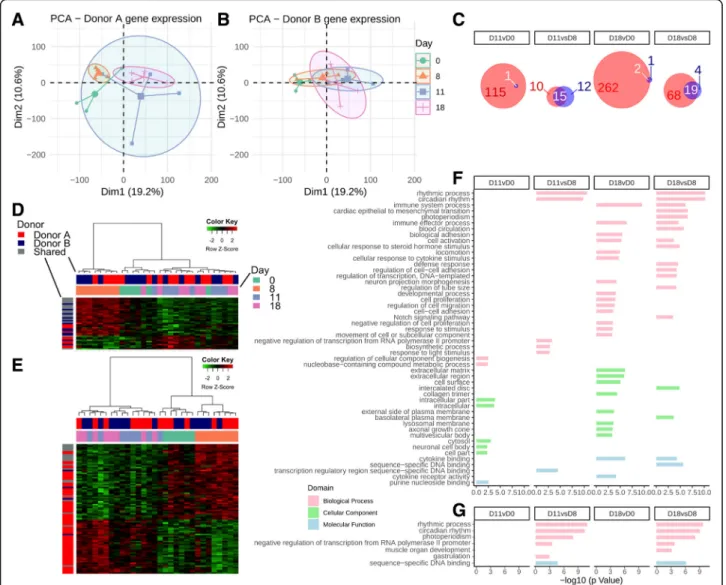
Gene expression was assessed initially with PCA for all mice combined (Fig. 3a). This demonstrated a pattern associated with antibiotic treatment, with the main
Fig. 3 a PCA plots of gene expression data following antibiotic treatments for all mice combined, clustered by day with respect to antibiotic treatment. b Heatmap of differentially expressed genes at the D18 vs D0 contrast. c GO enrichment analysis, followed by submission to REVIGO, stratified by contrast
separation between early (D0 and D8) and recovery (D11 and D18) time points. Figure 3b represents differentially expressed genes between D18 and D0 (1845 in total), which again demonstrate clear clustering between early (D0 and D8) and recovery (D11 and D18) time points. Gene Ontol-ogy (GO) analysis with the goana function in limma identi-fied a large number of significant GO terms between different contrasts, so the top 100 were submitted to REVIGO and of the resulting output, those with a − log10(P value) > 5 were plotted. This analysis demonstrated significant changes in many terms, prominently biological processes concerned with extracellular matrix organization, cellular adhesion, signaling, cell migration, developmental processes, and circadian rhythm (Fig.3c).
A combined analysis of both groups in our study also demonstrated significant differential gene expression al-terations at D8 relating to genes associated with circa-dian rhythm, consistent with previously reported findings following antibiotic treatment, including altered expression of Per genes, Cipc, Prkaa2, NR1D2/Rev-ErbA, Ciart, NPAS2/CLOCK, NFIL3/E4BP4, and ARNTL/ BMAL1 [26] (Additional file 5: Figure S3). Recent work has precisely explored the relationship between circadian rhythm and the microbiome and identified diurnal bio-geographic changes in microbial proximity to the epithe-lium which orchestrate epithelial and host circadian processes [27–29].
When the same analysis was repeated for each donor group individually, more significantly differentially expressed genes were detected in the donor A than donor B group (Fig.4a–c). While only a limited number
of differentially expressed genes were evident for donor B mice, there was notable overlap in those genes that were with donor A mice (Fig. 4c). Additionally, heat-maps of contrasts D11 vs D8 (Fig. 4d) and D18 vs D8 (Fig. 4e) including these genes, while dominated by donor A, still demonstrated clear clustering based on early (D0, D8) and late (D11, D18) time points, again suggesting that even though these genes did not meet the threshold for differential expression for donor B, there was a common pattern in response to co-amoxi-clav. GO terms with at least four genes were submitted to REVIGO (donor A, Fig.4f; donor B, Fig.4g) demon-strated common activation of circadian rhythm terms at D8 compared to recovery time points (D11 and D18), while terms relating to immune system processes, cell adhesion and response to stimulus were evident in donor A mice at D18 when compared to the early time points (D0 and/or D8).
Taken together, these results demonstrate a marked ef-fect of co-amoxiclav administration on the colonic tran-scriptome of humanized mice. Gene expression analysis identified changes in genes involved in extracellular matrix organization, cellular adhesion and motility, developmental
processes, circadian rhythm, and immune system pro-cesses. While the pattern of gene expression was similar re-gardless of the baseline (D0) microbiota, the degree of change appeared to be more marked in mice humanized by donor A than by donor B. As these were the mice that had a more marked alteration in the microbiota compos-ition in response to co-amoxiclav, we next investigated whether correlation between the transcriptome and micro-biota was evident.
Host transcriptome-microbiota correlation reveals marked covariance between the microbiota and GO pathways in donor A mice but not in donor B mice
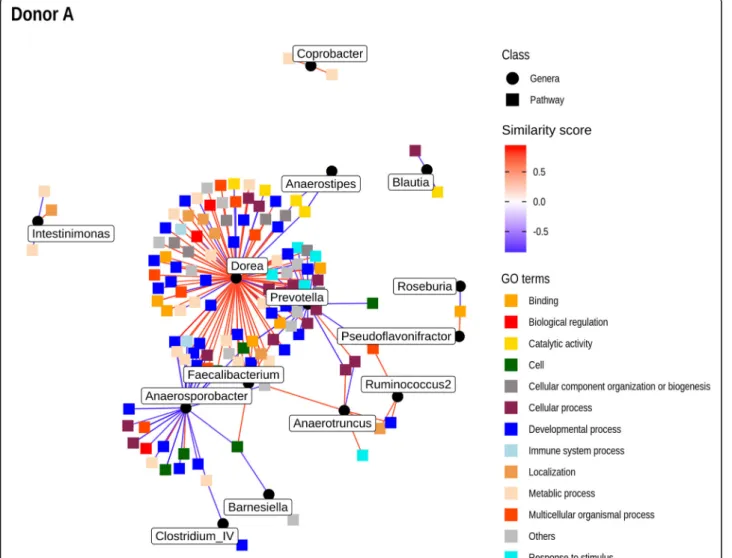
Due to the large number of differentially expressed genes across the different contrasts, we used Gene Set Variation Analysis (GSVA) to identify gene pathways associated with antibiotic treatment. To perform correlation with microbial taxa, we used Hierarchical All-against-All significance test-ing [30], a recently developed technique for determining relationships between multi-omics datasets (Fig. 5, Add-itional files6and7). This method identifies significant cor-relations between individual features of both datasets, as well as identifying correlations between clusters of features. Performed using Spearman’s correlation values on the genus-level abundance from each donor and the corre-sponding pathway abundance from GSVA, a large number of correlations were evident for donor A mice following multiple-hypothesis correction, including a number of dominant and/or differentially abundant bacterial taxa from that donor (Prevotella, Dorea, Faecalibacterium, Blautia, and Roseburia). Figure5represents a network plot of significant correlations between individual pathways and bacterial genera for donor A mice. The pathways are col-ored by high-level GO assignments. Furthermore, path-way-bacteria correlations, including additional clusters determined by HAllA, are represented in Additional file6
(data) and Additional file7: Figure S4. In contrast, no sig-nificant correlations between pathway expression and the microbiota were evident for donor B mice.
Taken together, these results demonstrate correlation between host pathways and microbiome composition was unique to donor A mice. However, as the anti-biotic-induced changes in donor B mice were consider-ably weaker, such correlations are harder to detect and higher numbers of mice would probably be required in this case.
Discussion
We report that GFM humanized with different human donor microbiota maintain a unique community profile and experience individualized responses to oral anti-biotic administration. Mice humanized with donor A microbiota were dominated by Prevotella and Faecali-bacterium, with a lesser contribution from Bacteroidetes
and underwent marked fluctuations in terms of their dominant genera, most prominently Prevotella and Fae-calibacterium, as well as in other lower abundance gen-era within the community. It is notable that by D18, the mean abundance of Prevotella was approximately half that of baseline (D0), while the mean proportional abun-dance of Faecalibacterium was almost three times the baseline (D0) (Fig. 1b and Additional file 2), suggesting that the donor A group had a lower resilience, without return to baseline by the end of the study.
In contrast to donor A, donor B mice were much more resilient to antibiotic administration, with the notable exception of a late bloom in Ruminococcus sequences at D18. Bacteroides was the dominant genus in this group with Parabacteroides, the second most dominant genus. As mentioned, there was a trend of decreasing
proportional abundance in Bacteroides throughout the study in the donor B group, although this did not reach significance. Notably, most dramatic changes in micro-biota composition occurred in the recovery period.
We did not observe a significant change inα-diversity over the duration of the study. We note that there were only three baseline (D0) mice in each group and this may have accounted for our inability to detect a signifi-cant change. Furthermore, as we did not detect changes in general in the donor B group, it is consistent that we did not detect a change in α-diversity either. In terms of donor A mice, we did note a drop-off in the Simpson diversity at D18 (Fig. 1d) but changes in this donor group appeared to be dominated by compositional changes rather than a reduction in richness (unique OTUs).
Fig. 4 Gene expression analysis for both donor groups individually. a PCA as in Fig.3a, isolating donor A gene expression. b PCA for donor B expression alone. c Contrasts with differential genes and the relative contribution from donor A and donor B. Red represents donor A, blue donor B, and white overlap. d D11 vs D8 heatmap of differential gene expression. e D18 vs D8 heatmap of differential gene expression. f GO
Marked effects of antibiotics on the colonic transcrip-tome were also demonstrated, again most notably in the recovery period. In a pooled analysis, there was a signifi-cant increase in many processes related to biological ad-hesion and sensing (Fig. 3), perhaps due to stimulation from a rebound recovery in bacteria following the with-drawal of antibiotics. When analyzed individually, the gene expression changes were more marked for donor A mice, suggesting that the more dramatic perturbations in composition associated with this donor group were reflected in the transcriptome. Stronger evidence for this conclusion can be drawn from the multiple correlations detected between enriched GO pathways and the micro-biota composition of donor A mice (Fig. 5), in contrast to those of donor B. While these correlations only repre-sent an association, it must also be noted that the total bacterial load was not quantified in this study and as such, the changes in composition may reflect significant
changes in mucosal-associated bacteria, which were per-haps more dramatically altered in donor A mice.
Recently, a study has elegantly elucidated the effects of an ablative cocktail of antibiotics on the colonic tran-scriptome, identifying that depletion of the microbiota, direct antibiotic effects on the host, and the effects of antibiotic-resistant microbiota account for the alter-ations [31]. This study also demonstrated downregula-tion of immunity with antibiotic treatment, while identifying significant direct toxicity of antibiotics on mitochondrial function. Interestingly, a recent study in healthy adults using a cocktail of antibiotics demon-strated dramatic, rapid shifts in microbiome compos-ition, followed by near-complete recovery within 6 months [32]. In contrast, our study utilized a more gen-tle perturbation with a single antibiotic combination commonly used in human medicine, in order to deter-mine correlations between disturbances in the
Fig. 5 Network plot of significant correlations between GO pathways drawn from GSVA and genera abundance for donor A mice determined by the HAllA method. Corresponding GO pathways are provided in Additional file6
microbiota and the transcriptome, in addition to their relationships to baseline microbiota composition.
Our data suggest that while the response to antibiotics is very different between groups of GFM humanized by different donors, and therefore enterotypes, gene expres-sion patterns in response to antibiotics are similar. How-ever, the magnitude of the change detected was more evident in the donor A group, suggesting that the mag-nitude of microbiota perturbation influences the subse-quent changes in gene expression. Such a conclusion fits with numerous observations in murine models highlight-ing the importance of the baseline microbiota, its impact in a range of settings, and the requirement for methods to quantify and standardize microbiome effects in ani-mal models [33]. These data also suggest that in multi-omics studies incorporating the microbiome, temporal analysis within individuals may yield more insights than aggregating data between individuals with very different baseline microbiota compositions. This was clearly evi-dent in our results, where aggregation of data led to a complete loss of the covariance structure due to the dif-ferent levels and responses of shared bacterial genera be-tween donor groups. These findings would also fit more broadly with emerging data indicating that our micro-biome represents an important element of our personal-ized response to environmental factors [34,35].
A number of limitations should be noted in our study. Only two donors groups were available for analysis and therefore findings relating to the behavior of individual genera, both in their response to antibiotics and their as-sociation with host transcriptome response, cannot ne-cessarily be extrapolated to include a range of donor microbiome compositions. Furthermore, varying doses of antibiotics, administration protocols, and antibiotic cocktails have been used in previous studies, limiting direct comparisons. It is important to note that we did not sequence the original donor communities and there-fore we cannot characterize precisely the true extent of engraftment of strains or the resulting compositional similarity to the original fecal sample. We have based our conclusions on this model protocol as it is estab-lished in our facility in multiple studies that replicate phenotypic traits of the donor [36–39], as well as from other groups, where seminal findings have established that up to 85% of human taxa can be established follow-ing oral gavage [40]. However this study and other simi-lar studies have used higher initial concentrations, and other studies have used higher quantities again [41], as well as repeated dosing schedules [42]. We do however note that the microbiota communities in our study clus-tered closely with human donors from the MetaHIT consortia, suggesting we had recapitulated an adequate proportion of the donor microbiota in each group. In addition to these specific points in relation to our study,
humanized GFM also suffer from a number of limitations, including the effects of a non-native microbiota and im-paired immune development in the humanized mouse in-testine and these must also be acknowledged [43].
In addition, we did not use a no-antibiotic control group but instead housed mice in one of two separate cages for each donor group. This design implicitly required that changes be consistent across cages in each donor group. We acknowledge however that this represents a limitation in our study. We have used the cage effects in the study to demonstrate significant convergence of microbiota com-munities in donor A post antibiotics (D8) and not in donor B. However, conclusions from both the microbiota and host transcriptome must take into account the lack of a no-antibiotic control group.
Finally, recent work has demonstrated the importance of bacterial load in characterizing the microbiome, and changes in total bacterial counts in both donor groups may have contributed to some of the effects seen [44]. Conclusions
In summary, we have demonstrated that a commonly prescribed antibiotic can exert significant effects on the gut microbiota, in concert with colonic gene expression. Notably, while the host response appeared to be con-served, the degree of activation was related to the degree of microbiota perturbation, resulting in correlations be-tween host transcriptome and the microbiota unique to one donor community. These findings offer a window into the role that our microbiome plays in mediating our personalized response to medications such as antibiotics. Materials and methods
Study design
All procedures in relation to the care and use of laboratory animals were carried out in accordance with European guidelines and the local ethics committee approved this study. Germ-free male 6-week-old mice (n = 31) were transferred into two sterile separate isolators (Table 2; ANAXEM, INRA, Jouy-en-Josas, France) for the 10-week duration of the study and had ad libitum access to irradi-ated feeds and sterile water. Mice were observed once a day to ensure their welfare. For colonization, GFM were inoculated orally with 250μl of a 10−2 dilution of whole fecal homogenate from two healthy adults (termed donors A and B) with no history of intestinal problems or intake of antibiotics 3 months prior to the beginning of the study, resulting in a single donor fecal microbiota transplant-ation per isolator (donor A (n = 15) and donor B (n = 16)). Mice in each isolator were housed in two separate cages (Table2), with the aim to have four mice per time point (two per cage) following antibiotics in each group. The human donors who provided a fecal sample gave their verbal consent to do so. Fifty-six days after microbiota
inoculation, samples were acquired at baseline (day 0 (D0); donor A (n = 3), donor B (n = 4)), followed by the administration of the penicillin antibiotic amoxicillin in combination with theβ-lactamase inhibitor clavulanic acid once a day (80 mg and 10 mg/kg) to all remaining mice. We chose this antibiotic as it is a commonly prescribed, broad-spectrum human antibiotic, and treatment was continued for a total of 7 days, similar to the duration of a typical treatment for a community infection [45], followed by sampling at days 8 (D8), 11 (D11), and 18 (D18) (Fig.
1a). We choose this dose as it is intermediate between doses used in previous rodent studies [46, 47] and is the current recommended dosing for children under 40 kg body weight in France [48].
Sampling
At each time-point, a subset of animals was sacrificed (see Table 1), the large intestine (colon) was removed and luminal contents acquired and processed for the ex-traction of community microbial DNA. RNA exex-traction proceeded directly from the large intestine. We did not have prior data to estimate the duration of the recovery period to monitor and so early recovery (D11, 3 days post-cessation of antibiotics) and late recovery (D18, 10 days post-cessation of antibiotics) time points were chosen.
Gene expression
Total RNA was isolated from the large intestine with the RNeasy Mini Kit (Qiagen, Courtaboeuf, France) accord-ing to the manufacturer’s instructions. RNA 6000 Nano chips on a Bioanalyzer 2100 (Agilent Technologies, Les Ulis, France) were used to assess RNA integrity. Gene expression profiling was performed with the SurePrint G3 Mouse GE 8x60 K Microarray (Design ID: 028005, Agilent Technologies). Further details are provided in supplementary methods in Additional file8.
DNA extraction and sequencing
Fecal samples were weighed and resuspended in 250μl of 4 M guanidine thiocyanate in 0.1 M Tris at pH 7.5 (Sigma) and 40μl of 10% N-lauroyl sarcosine (Sigma) for 10 min at room temperature. Five hundred microliters of 5% N-lauroyl sarcosine in 0.1 M phosphate buffer (pH 8.0) was then added and incubated at 70 °C for 1 h. A
mixture of sterilized silica beads (0.1- and 0.6-mm diam-eter) was added and the tube shaken three times at 6.5 m/s for 30 s in a FastPrep apparatus (MP Biomedicals). Fifteen milligrams of polyvinylpolypyrrolidone was then added to the tube, and this was vortexed and centrifuged at 20,000×g for 5 min. Following the recovery of the supernatant, the pellets were washed with 500μl of TENP (50 mM Tris (pH 8), 20 mM EDTA (pH 8), 100 mM NaCl, 1% polyvinylpolypyrrolidone) and centrifuged for 5 min at 20,000×g and the new supernatant was added to the first supernatant. The washing step was re-peated twice. The pooled supernatant was centrifuged briefly to remove particles and then split into two 2-ml tubes. Precipitation of nucleic acids was performed by adding one volume of isopropanol for 10 min at room temperature with centrifugation at 20,000×g for 10 min. Pellets were then resuspended and pooled in 450μl of 100 mM phosphate buffer at pH 8 and 50 ml of 5-M po-tassium acetate. The tube was placed on ice overnight and then centrifuged for 30 min at 20,000×g. The super-natant was subsequently transferred to a new tube con-taining 20μl of RNase (1 mg/ml) and incubated at 37 °C for 30 min. Nucleic acid precipitation was performed by adding 50μl of 3-M sodium acetate and 1 ml of absolute ethanol. The tube was incubated for 10 min at room temperature and the nucleic acids were recovered by centrifugation at 20,000×g for 15 min. The resulting DNA pellet was finally washed with 70% ethanol and then dried and resuspended in 100μl of Tris–EDTA (TE) buffer.
Amplicon libraries for barcoded 454 pyrosequencing were generated by PCR of the V3–V4 hypervariable re-gion of the 16S gene with the primers 343F 5′-TACG GGAGGCAGCAG-3′ and 806R 5′-GGACTACCAGGG TATCTAAT-3′. Barcodes are available in the supple-mentary methods (Additional file8).
Bioinformatic and statistical analysis Transcriptome analysis
Following the pre-processing of raw transcriptome data (described in detail in Additional file 8), statistical ana-lysis was performed in the R statistical environment (R version 3.6.0) [49].
Differential gene expression analysis
Principal component analysis was performed using the ade4 (v1.7-13) [50] and factoextra (v1.0.5) packages in R. Differential gene expression was performed using the limma package (v3.36.5) and the eBayes test [51]. Multiple testing corrections were made using the Benja-mini-Hochberg method (adjusted P values < 0.05). Dif-ferentially enriched pathways in the Gene Ontology (GO) databases were identified using the goana function in the limma package. To remove redundancy, GO
Table 2 Number of samples according to time points, donors, and cages Donor Cage D0 D8 D11 D18 A 1 2 2 2 2 A 2 1 2 2 2 B 1 2 2 2 2 B 2 2 2 2 2
terms that were significantly enriched (adjusted P value < 0.01) were submitted to REVIGO [52] and the output presented by way of– log10 (P value).
Microbiome analysis
Demultiplexing of pyrosequencing fasta and quality files was performed with QIIME (v1.9.1) [53] and FASTQ files were created which were loaded into R and ana-lyzed using the DADA2 package (v1.10.0), optimized for pyrosequencing output [54] (see Additional file 8) to give a table of amplicon sequence variants (referred to as operational taxonomic units (OTUs) throughout). Taxonomic assignments were performed using the RDP v16 (Ribosomal Database Project) training set specially formatted for the DADA2 package [55]. Phylogenetic tree construction utilized the DECIPHER [56] and Phan-gorn [57] packages. All subsequent microbiome analyses were performed through the phyloseq (v1.24.2) and vegan (v2.5-5) packages in R [22,58,59].
Alpha diversity was presented using the Simpson di-versity index. Differential abundance between donor groups and between different time points within donor groups was assessed using DESeq2 (v1.24.0) (FDR P values < 0.01) and significance was confirmed by Mann-Whitney testing [60]. Beta diversity was assessed with principle coordinate analysis (PCoA) of weighted unifrac distances [61] on proportional abundance data (propor-tion normalized). A two-way PERMANOVA was per-formed, using donor and day as main effects and the interaction between donor and day as the interaction term. Post hoc pairwise testing was performed using the “pairwise.perm.manova” function from the RVAideMe-moirepackage (v 0.9-73) [62]. Spearman’s correlation of
genus-level microbial taxa was also performed against the first two principal coordinate axes for each donor group individually to illustrate bacterial genera associ-ated with major variation. P values were adjusted with the Benjamini-Hochberg method and correlations with adjusted P values < 0.1 were retained. Graphs were made using ggplot2 (v3.1.1) [63] (Additional file9).
Correlation of microbiota and transcriptome
To determine if there was evidence of the correlation between antibiotic-induced changes in the microbiota and the transcriptome, we firstly used Gene Set Vari-ation Analysis (GSVA) to identify enriched GO pathways across the entire transcriptome data set, using the R package GSVA (v1.32.0) [64]. GO pathways were derived from a murine version of the Molecular Signatures Data-base (MSigDB) [65]. GSVA output was then submitted to limma to determine differentially expressed pathways. This allowed for dimensionality reduction, reducing the total number of transcripts (18,217) and differentially expressed genes (3630) to 182 differentially expressed
pathways across all contrasts. Due to the extreme differ-ences in microbiota composition between the two donor groups, pathway scores were correlated with genus-level bacterial abundance for each group individually. Correl-ation was performed using the Hierarchical All-against-All (HAll-against-AllA) approach developed for multiomics data sets [30], having discarded pathways with log fold changes of < 0.5. Benjamini-Hochberg-adjusted P values of < 0.1 were retained from the results and were plotted using ggraph and igraph [66] (Additional file10). Additional files
Additional file 1:Figure S1. A. Rarefaction curves for 16S sequences per sample. Observed species and Shannon diversity are presented. B. Data from MetaHIT and this study submitted to enterotyping with mean abundance at each time point for each donor group, demonstrating clustering of donor A with the Prevotella enterotype and donor B with the Bacteroides enterotype. (TIFF 1269 kb)
Additional file 2:Tables of proportional abundance of different genera in the different donor groups. (XLSX 18 kb)
Additional file 3:Results from statistical tests of significance for different diversity metrics. (XLSX 8 kb)
Additional file 4:Figure S2. Distance-based analysis examining the effects of antibiotics within and between cages. Schematic of the weighted unifrac distances between time points within individual cages for a donor group (S2A) and the distances at individual time points, including those between cages (S2B). In S2C, these distances are plotted for both donor groups, indicating a significant shrinking in distance post antibiotics (D8) in donor A mice, while there is no significant difference for donor B mice. (TIFF 1150 kb)
Additional file 5:Figure S3. Heatmap of differentially abundant genes relating to the circadian rhythm at the contrasts for both donor groups (all mice) combined. (TIFF 943 kb)
Additional file 6:Output from HAllA correlations of GSVA and genus abundance. (XLSX 43 kb)
Additional file 7:Figure S4. Heatmap output from Hierarchical All-against-All significance procedure for donor A. (PDF 138 kb)
Additional file 8:Supplementary methods and pyrosequencing barcodes. (DOCX 118 kb)
Additional file 9:Output describing the code used for microbiota analysis. (HTML 3490 kb)
Additional file 10:Output describing the code used for transcriptome analysis. (HTML 2420 kb)
Abbreviations
CDI:Clostridium difficile infection; DNA: Deoxyribonucleic acid;
EDTA: Ethylenediaminetetraacetic acid; FDR: False discovery rate; GFM: Germ-free mice; GO: Gene Ontology; GSVA: Gene Set Variation Analysis;
HAllA: Hierarchical All-against-All significance testing; MsigDB: Molecular Signatures Database; OTU: Operational taxonomic units; PCA: Principal component analysis; PCoA: Principal coordinate analysis; PCR: Polymerase chain reaction; RNA: Ribonucleic acid; VRE: Vancomycin-resistant Enterococcus Acknowledgements
Not applicable. Authors’ contributions
EG, TWH, PL, and HS contributed to the conceptualization and methodology; EG, TWH, PL, and HS the investigation; HPP, AL, and HS the data analysis; AL and HS the writing of the original draft; EG, TWH, PL, AL, and HS the writing, reviewing, and editing; EG and PL the funding; and HS the supervision of the manuscript. All authors read and approved the final manuscript.
Funding
Eric Guédon and Philipe Langella also thank Syndifrais-CNIEL (Paris, France) for their financial support with the project Exibam. Aonghus Lavelle has re-ceived funding from the People Programme (Marie Curie Actions) of the European Union's Seventh Framework Programme (FP7/2007-2013) under REA grant agreement n. PCOFUND-GA-2013-609102, through the PRESTIGE programme coordinated by Campus France.
Availability of data and materials
Microarray data is available from the Gene Expression Omnibus (GEO) with accession number GSE131785, while microbiota sequencing data is available from the Sequence Read Archive (SRA) with accession number
PRJNA544904. Files detailing the code used for the analysis are available as R knitr.html files. For the microbiota analysis, this is in Additional file9, and for the transcriptomic analysis, this is in Additional file10.
Ethics approval and consent to participate
All procedures in relation to the care and use of laboratory animals were carried out in accordance with European guidelines, and the local ethics committee approved this study.
Consent for publication Not applicable. Competing interests
The authors declare that they have no competing interests. Author details
1Sorbonne Université, INSERM, Saint-Antoine Research Center (CRSA), Paris,
France.2INRA, UMR1319 Micalis, AgroParisTech, Jouy-en-Josas, France.3ILTOO Pharma, 14 rue des reculettes, Paris, France.4STLO, INRA, Agrocampus Ouest,
Rennes, France.5Department of Gastroenterology, Saint Antoine Hospital, Assistance Publique– Hopitaux de Paris, Sorbonne Universités, 184 rue du Faubourg Saint-Antoine, 75571 Paris CEDEX 12, Paris, France.
Received: 27 May 2019 Accepted: 18 July 2019
References
1. Ley RE, Hamady M, Lozupone C, Turnbaugh PJ, Ramey RR, Bircher JS, Schlegel ML, Tucker TA, Schrenzel MD, Knight R, Gordon JI. Evolution of mammals and their gut microbes. Science. 2008;320:1647–51. 2. The Human Microbiome Consortium. Structure, function and diversity of
the healthy human microbiome. Nature. 2012;486:207–14.
3. Cox LM, Yamanishi S, Sohn J, Alekseyenko AV, Leung JM, Cho I, Kim S, Li H, Gao Z, Mahana D, et al. Altering the intestinal microbiota during a critical developmental window has lasting metabolic consequences. Cell. 2014;158: 705–21.
4. Chung H, Pamp SJ, Hill JA, Surana NK, Edelman SM, Troy EB, Reading NC, Villablanca EJ, Wang S, Mora JR, et al. Gut immune maturation depends on colonization with a host-specific microbiota. Cell. 2012;149:1578–93. 5. Mueller NT, Bakacs E, Combellick J, Grigoryan Z, Dominguez-Bello MG. The
infant microbiome development: mom matters. Trends Mol Med. 2015;21: 109–17.
6. Korpela K, Salonen A, Virta LJ, Kekkonen RA, Forslund K, Bork P, de Vos WM. Intestinal microbiome is related to lifetime antibiotic use in Finnish pre-school children. Nat Commun. 2016;7:10410.
7. Metsala J, Lundqvist A, Virta LJ, Kaila M, Gissler M, Virtanen SM. Prenatal and post-natal exposure to antibiotics and risk of asthma in childhood. Clin Exp Allergy. 2015;45:137–45.
8. Claesson MJ, Jeffery IB, Conde S, Power SE, O'Connor EM, Cusack S, Harris HM, Coakley M, Lakshminarayanan B, O’Sullivan O, et al. Gut microbiota composition correlates with diet and health in the elderly. Nature. 2012;488: 178–84.
9. Maier L, Pruteanu M, Kuhn M, Zeller G, Telzerow A, Anderson EE, Brochado AR, Fernandez KC, Dose H, Mori H, et al. Extensive impact of non-antibiotic drugs on human gut bacteria. Nature. 2018;555:623.
10. Bager P, Wohlfahrt J, Westergaard T. Caesarean delivery and risk of atopy and allergic disease: meta-analyses. Clin Exp Allergy. 2008;38:634–42. 11. Ungaro R, Bernstein CN, Gearry R, Hviid A, Kolho K-L, Kronman MP, Shaw S,
Van Kruiningen H, Colombel J-F, Atreja A. Antibiotics associated with
increased risk of new-onset Crohn’s disease but not ulcerative colitis: a meta-analysis. Am J Gastroenterol. 2014;109:1728.
12. Ananthakrishnan AN, Khalili H, Konijeti GG, Higuchi LM, de Silva P, Korzenik JR, Fuchs CS, Willett WC, Richter JM, Chan AT. A prospective study of long-term intake of dietary fiber and risk of Crohn’s disease and ulcerative colitis. Gastroenterology. 2013;145:970–7.
13. Stark CM, Susi A, Emerick J, Nylund CM. Antibiotic and acid-suppression medications during early childhood are associated with obesity. Gut. 2019; 68:62–9.
14. Jernberg C, Lofmark S, Edlund C, Jansson JK. Long-term ecological impacts of antibiotic administration on the human intestinal microbiota. ISME J. 2007;1:56–66.
15. Al Nabhani Z, Dulauroy S, Marques R, Cousu C, Al Bounny S, Déjardin F, Sparwasser T, Bérard M, Cerf-Bensussan N, Eberl G. A weaning reaction to microbiota is required for resistance to immunopathologies in the adult. Immunity. 2019.
16. Beaugerie L, Langholz E, Nyboe-Andersen N, Pigneur B, Sokol H, Epicom E. Differences in epidemiological features between ulcerative colitis and Crohn’s disease: the early life-programmed versus late dysbiosis hypothesis. Med Hypotheses. 2018;115:19–21.
17. Ubeda C, Taur Y, Jenq RR, Equinda MJ, Son T, Samstein M, Viale A, Socci ND, van den Brink MR, Kamboj M, Pamer EG. Vancomycin-resistant Enterococcus domination of intestinal microbiota is enabled by antibiotic treatment in mice and precedes bloodstream invasion in humans. J Clin Invest. 2010;120: 4332–41.
18. Buffie CG, Jarchum I, Equinda M, Lipuma L, Gobourne A, Viale A, Ubeda C, Xavier J, Pamer EG. Profound alterations of intestinal microbiota following a single dose of clindamycin results in sustained susceptibility to Clostridium difficile-induced colitis. Infect Immun. 2012;80:62–73.
19. Laxminarayan R, Duse A, Wattal C, Zaidi AKM, Wertheim HFL, Sumpradit N, Vlieghe E, Hara GL, Gould IM, Goossens H, et al. Antibiotic resistance—the need for global solutions. Lancet Infect Dis. 2013;13:1057–98.
20. Dethlefsen L, Relman DA. Incomplete recovery and individualized responses of the human distal gut microbiota to repeated antibiotic perturbation. Proc Natl Acad Sci USA. 2011;108:4554–61.
21. Jakobsson HE, Jernberg C, Andersson AF, Sjölund-Karlsson M, Jansson JK, Engstrand L. Short-term antibiotic treatment has differing long-term impacts on the human throat and gut microbiome. PLOS ONE. 2010;5: e9836.
22. Callahan BJ, Sankaran K, Fukuyama JA, McMurdie PJ, Holmes SP. Bioconductor workflow for microbiome data analysis: from raw reads to community analyses. F1000Res. 2016;5:1492.
23. Costea PI, Hildebrand F, Arumugam M, Bäckhed F, Blaser MJ, Bushman FD, de Vos WM, Ehrlich SD, Fraser CM, Hattori M, et al. Enterotypes in the landscape of gut microbial community composition. Nat Microbiol. 2018;3: 8–16.
24. Le Chatelier E, Nielsen T, Qin J, Prifti E, Hildebrand F, Falony G, Almeida M, Arumugam M, Batto J-M, Kennedy S, et al. Richness of human gut microbiome correlates with metabolic markers. Nature. 2013;500:541. 25. http://enterotypes.org/. Accessed 4 Sept 2018.
26. Mukherji A, Kobiita A, Ye T, Chambon P. Homeostasis in intestinal epithelium is orchestrated by the circadian clock and microbiota cues transduced by TLRs. Cell. 2013;153:812–27.
27. Thaiss CA, Zeevi D, Levy M, Zilberman-Schapira G, Suez J, Tengeler AC, Abramson L, Katz MN, Korem T, Zmora N, et al. Transkingdom control of microbiota diurnal oscillations promotes metabolic homeostasis. Cell. 2014; 159:514–29.
28. Thaiss CA, Levy M, Korem T, Dohnalová L, Shapiro H, Jaitin DA, David E, Winter DR, Gury-BenAri M, Tatirovsky E, et al: Microbiota diurnal rhythmicity programs host transcriptome oscillations. Cell. 2016;167:1495-1510.e1412. 29. Weger BD, Gobet C, Yeung J, Martin E, Jimenez S, Betrisey B, Foata F, Berger
B, Balvay A, Foussier A, et al: The Mouse Microbiome is required for sex-specific diurnal rhythms of gene expression and metabolism. Cell Metab. 2019;29:362-382.e368.
30. Rahnavard G, Franzosa EA, McIver LJ, Schwager E, Lloyd-Price J, Weingart G, Moon YS, Morgan XC, Waldron L, Huttenhower C: High-sensitivity pattern discovery in large multi’omic datasets. huttenhowersphharvardedu/halla. 31. Morgun A, Dzutsev A, Dong X, Greer RL, Sexton DJ, Ravel J, Schuster M,
Hsiao W, Matzinger P, Shulzhenko N. Uncovering effects of antibiotics on the host and microbiota using transkingdom gene networks. Gut. 2015;64: 1732–43.
32. Palleja A, Mikkelsen KH, Forslund SK, Kashani A, Allin KH, Nielsen T, Hansen TH, Liang S, Feng Q, Zhang C, et al. Recovery of gut microbiota of healthy adults following antibiotic exposure. Nat Microbiol. 2018;3:1255–65. 33. Stappenbeck TS, Virgin HW. Accounting for reciprocal host–microbiome
interactions in experimental science. Nature. 2016;534:191.
34. Zeevi D, Korem T, Zmora N, Israeli D, Rothschild D, Weinberger A, Ben-Yacov O, Lador D, Avnit-Sagi T, Lotan-Pompan M, et al. Personalized nutrition by prediction of glycemic responses. Cell. 2015;163:1079–94. 35. Rothschild D, Weissbrod O, Barkan E, Kurilshikov A, Korem T, Zeevi D, Costea
PI, Godneva A, Kalka IN, Bar N, et al. Environment dominates over host genetics in shaping human gut microbiota. Nature. 2018;555:210. 36. Gerard P, Beguet F, Lepercq P, Rigottier-Gois L, Rochet V, Andrieux C, Juste
C. Gnotobiotic rats harboring human intestinal microbiota as a model for studying cholesterol-to-coprostanol conversion. FEMS Microbiol Ecol. 2004; 47:337–43.
37. Respondek F, Gerard P, Bossis M, Boschat L, Bruneau A, Rabot S, Wagner A, Martin J-C. Short-chain fructo-oligosaccharides modulate intestinal microbiota and metabolic parameters of humanized gnotobiotic diet induced obesity mice. PloS one. 2013;8:e71026–6.
38. Llopis M, Cassard AM, Wrzosek L, Boschat L, Bruneau A, Ferrere G, Puchois V, Martin JC, Lepage P, Le Roy T, et al. Intestinal microbiota contributes to individual susceptibility to alcoholic liver disease. Gut. 2016;65:830–9. 39. Le Roy T, Llopis M, Lepage P, Bruneau A, Rabot S, Bevilacqua C, Martin P,
Philippe C, Walker F, Bado A, et al. Intestinal microbiota determines development of non-alcoholic fatty liver disease in mice. Gut. 2013;62:1787–94. 40. Turnbaugh PJ, Ridaura VK, Faith JJ, Rey FE, Knight R, Gordon JI. The effect of diet on the human gut microbiome: a metagenomic analysis in humanized gnotobiotic mice. Sci Transl Med. 2009;1:6ra14.
41. Marcobal A, Kashyap PC, Nelson TA, Aronov PA, Donia MS, Spormann A, Fischbach MA, Sonnenburg JL. A metabolomic view of how the human gut microbiota impacts the host metabolome using humanized and gnotobiotic mice. ISME J. 2013;7:1933.
42. Arrieta M-C, Stiemsma LT, Dimitriu PA, Thorson L, Russell S, Yurist-Doutsch S, Kuzeljevic B, Gold MJ, Britton HM, Lefebvre DL, et al. Early infancy microbial and metabolic alterations affect risk of childhood asthma. Sci Transl Med. 2015;7:307ra152.
43. Arrieta MC, Walter J, Finlay BB. Human microbiota-associated mice: a model with challenges. Cell Host Microbe. 2016;19:575–8.
44. Vandeputte D, Kathagen G, D'Hoe K, Vieira-Silva S, Valles-Colomer M, Sabino J, Wang J, Tito RY, De Commer L, Darzi Y, et al. Quantitative microbiome profiling links gut community variation to microbial load. Nature. 2017;551: 507–11.
45. Woodhead M, Blasi F, Ewig S, Huchon G, Leven M, Ortqvist A, Schaberg T, Torres A, van der Heijden G, Verheij TJM. Guidelines for the management of adult lower respiratory tract infections. Eur Respir J. 2005;26:1138–80. 46. Beale AS, Faulds E, Hurn SE, Tyler J, Slocombe B. Comparative activities of
amoxycillin, amoxycillin/clavulanic acid and tetracycline against Chlamydia trachomatis in cell culture and in an experimental mouse pneumonitis. J Antimicrob Chemother. 1991;27:627–38.
47. Smith GM, Abbott KH. Development of experimental respiratory infections in neutropenic rats with either penicillin-resistant Streptococcus pneumoniae or beta-lactamase-producing Haemophilus influenzae. Antimicrob Agents Chemother. 1994;38:608–10.
48. http://www.doctissimo.fr/medicament-AUGMENTIN-ENFANT.htm. Accessed 7 July 2019.
49. R: R: A language and environment for statistical computing.: R Foundation for Statistical Computing, Vienna, Austria.http://www.R-project.org/2018. 50. Dray S, Dufour A-B: The ade4 Package: Implementing the duality diagram
for ecologists. 2007. 2007;22:20.
51. Ritchie ME, Phipson B, Wu D, Hu Y, Law CW, Shi W. Smyth GK: limma powers differential expression analyses for RNA-sequencing and microarray studies. Nucleic Acids Res. 2015;43:e47.
52. Supek F, Bošnjak M, Škunca N, Šmuc T. REVIGO summarizes and visualizes long lists of Gene Ontology terms. PLOS ONE. 2011;6:e21800.
53. Caporaso JG, Kuczynski J, Stombaugh J, Bittinger K, Bushman FD, Costello EK, Fierer N, Peña AG, Goodrich JK, Gordon JI, et al. QIIME allows analysis of high-throughput community sequencing data. Nat Methods. 2010;7:335. 54. Callahan BJ, McMurdie PJ, Rosen MJ, Han AW, Johnson AJA, Holmes SP.
DADA2: High-resolution sample inference from Illumina amplicon data. Nat Methods. 2016;13:581.
55. Cole JR, Wang Q, Cardenas E, Fish J, Chai B, Farris RJ, Kulam-Syed-Mohideen AS, McGarrell DM, Marsh T, Garrity GM, Tiedje JM. The Ribosomal Database Project: improved alignments and new tools for rRNA analysis. Nucleic Acids Res. 2009;37:D141–5.
56. Wright ES. DECIPHER: harnessing local sequence context to improve protein multiple sequence alignment. BMC Bioinformatics. 2015;16:322.
57. Schliep KP. phangorn: phylogenetic analysis in R. Bioinformatics. 2010;27: 592–3.
58. Oksanen J, Blanchet FG, Friendly M, Kindt R, Legendre P, McGlinn D, Minchin PR, O'Hara RB, Simpson GL, Solymos P, et al: vegan: community ecology package. R package version 24-5. 2017.
59. McMurdie PJ. Holmes S: phyloseq: An R package for reproducible interactive analysis and graphics of microbiome census data. PLOS ONE. 2013;8:e61217. 60. Love MI, Huber W, Anders S. Moderated estimation of fold change and
dispersion for RNA-seq data with DESeq2. Genome Biol. 2014;15:550. 61. Lozupone C, Knight R. UniFrac: a new phylogenetic method for comparing
microbial communities. Appl Environ Microbiol. 2005;71:8228–35. 62. Hervé M: RVAideMemoire: Testing and plotting procedures for biostatistics. .
2019;r package version 0.9-73.
63. Wickham H: ggplot2: elegant graphics for data analysis. Springer New York. 2009.
64. Hänzelmann S, Castelo R, Guinney J. GSVA: gene set variation analysis for microarray and RNA-Seq data. BMC Bioinformatics. 2013;14:7.
65. http://bioinf.wehi.edu.au/software/MSigDB/. Accessed 11 May 2018. 66. Csardi G, Nepusz T: The igraph software package for complex network
research. InterJournal. 2006;Complex Systems:1695.
Publisher’s Note
Springer Nature remains neutral with regard to jurisdictional claims in published maps and institutional affiliations.