HAL Id: hal-02157256
https://hal.insa-toulouse.fr/hal-02157256
Submitted on 15 Jun 2019
HAL is a multi-disciplinary open access
archive for the deposit and dissemination of
sci-entific research documents, whether they are
pub-lished or not. The documents may come from
teaching and research institutions in France or
abroad, or from public or private research centers.
L’archive ouverte pluridisciplinaire HAL, est
destinée au dépôt et à la diffusion de documents
scientifiques de niveau recherche, publiés ou non,
émanant des établissements d’enseignement et de
recherche français ou étrangers, des laboratoires
publics ou privés.
Marion Bonhomme, Hassan Haddou, Luc Adolphe
To cite this version:
Marion Bonhomme, Hassan Haddou, Luc Adolphe. GENIUS: A tool for classifying and modelling
evolution of urban typologies. 28ème conférence PLEA (Passive Low Energy Architecture), Nov 2012,
Lima, Peru. �hal-02157256�
GENIUS:
A tool for classifying and modelling evolution of urban typologies
Marion BONHOMME
1, Hassan AIT HADDOU
2, Luc ADOLPHE
31LRA, Ecole Nationale d’Architecture de Toulouse, France
2 Ecole Nationale d’Architecture de Montpellier, France
2 Institut National des Sciences appliquées, Toulouse, France
ABSTRACT: The work presented in this paper is part of two French national research programs (ACCLIMAT and MUSCADE) that assess the impacts of climate changes and city sprawl until 2100 on the urban areas of Toulouse and Paris. The projects use numerical models to simulate the behaviour of city components (microclimate, energy consumption, etc.) under different scenarios. These models, as most urban modelling tools, use data with high definition levels. However, in the case of a prospective project, the input data are imprecise. In particular, there is a lack of information about buildings footprints, roofs sloping, envelope materials, … In this sense, we developed a new tool to build high definition maps from available data, called GENIUS (GENerator of Interactive Urban blockS). GENIUS creates maps composed of “typical blocks” coming as shape-files of polygons with additional information (height, age, use, insulation…). The “typical blocks” come to seven archetypes of urban blocks that can be found in most European cities. The first task of our method is to transform an existing map into an “archetypical map”. To do this, the urban database of the IGN (French Geographical Institute) was used. The maps were divided into cells of 250 meters by 250 meters. For each cell, over 50 morphological indicators were calculated. Seven groups of blocks were identified by means of Principal Component Analysis. The obtained maps will enable us to come up with an accurate simulation of cities energy consumptions and microclimate both present and future.
Keywords: urban morphology, microclimate, energy
INTRODUCTION
During the last years, many research programs have assessed energy-efficient buildings and many models have been developed. However, those tools do not take into account issues related to the urban scale. The scale of urban development requires new paradigms that include urban form, energy use, renewable energy and urban microclimate. Few studies deal with the complexity of energy-efficient cities. Moreover, the temporal scale of urban development and climate change forces urban planners to reconsider the impact of their decisions in a far future (over a hundred years).
Cities are responsible for the majority of greenhouse gas emissions on the planet and they are estimated to consume 60% to 80% of the word energy. This situation is not improving as the urban population is growing. In 2030, about 60% of the word population will be living in urban areas [1]. The energy consumed and produced in the city is closely related to its morphology [2, 3]. Many studies tend to show that a dense urban form is more effective in terms of consumption for heating and transport but might not be as beneficial in terms of renewable energy potential. Indeed, the generation of
energy (electricity or heat) by solar panels and wind turbines might be reduced by dense urban morphologies. In particular, solar masks and roughness caused by buildings reduce renewable energy potential.
The urban form has also a strong impact on urban microclimate. Commonly referred to as urban heat island effect [4], the climatic change induced by the city results from several processes such as changes in the radiation
balance and aerodynamic effects of roughness induced
by the geometryof buildings[5, 6].
Urban research now focuses on observing and modelling effects of climate change and city sprawl on energy consumptions, greenhouse gases emissions and citizen comfort and health. In this area of research, the prospective project MUSCADE (funded by the ANR – National Agency for Research), having been assessing the impacts of climate changes and city sprawl of Paris until 2100. To assess those issues, most urban modeling tools use data with high definition levels. However, in the case of a prospective project, the input data is imprecise. In particular, there is a lack of information about buildings footprints, roofs sloping, envelope materials...
In this sense, we developed a new tool to build high definition maps from available data, called GENIUS. GENIUS creates maps composed of “typical blocks” coming as shape-files of polygons with additional information (height, age, use, insulation…). The “typical blocks” come to seven archetypes of urban blocks that can be found in most European cities.
The first task of our method is to transform an existing map into an “archetypical map” of seven typical urban blocks. In order to automatically indentify the seven typical blocks, we calculated indicators using existing urban databases.
Figure 1: Principle of generation of an “archetypical map” This approach has been used in different studies such as the “Local Climate Zones” defined by Stewart and Oke [7] and the classification of urban morphologies in the city of Marseille by Long [8]. The block generator is however able to provide additional individual attributes to each cell (in particular thermal insulation), and to make them evolve through time.
DATA TREATMENT
Several existing databases were available to create an initial map of archetypical buildings of Paris. However, in order to reproduce our work in different cities, we chose to work with databases available in a standardized form common to the entire French territory. Thus, we used two main data sources:
-‐ The 2008 urban database “BD Topo” produced by the IGN (French National Geographical Institute) which gives information regarding the shape (footprint and height) of buildings but also on the nature of the surfaces (vegetation, roads, and water). -‐ The data from the 2008 census of the INSEE (National Institute of Statistic and Economical Studies). These data are geotagged using a mesh division of the territory called IRIS (target size for each IRIS is 2 000 inhabitant).
To calculate the parameters, we used the GIS software ARCGIS. It allows the creation of "computational routines" also called ArcToolbox. By using those routines we meshed the study area (each cell has a resolution of 250 m by 250 m wide, which is the size of our “typical blocks”) and calculated indicators for each cell.
Regarding the size of “typical blocks”, we choose a grid that does not fragment the building too much while representing a relevant urban homogeneity. Statistical work was conducted as part of Nathalie Long thesis [8] and led to the conclusion that a mesh close to 200 m wide was relevant for the city of Marseille. Coming with similar conclusion for Paris, we choose a mesh of 250 m by 250 m, which also allowed us interoperability with other models in the MUSCADE project.
To convert as accurately as possible the available data at the IRIS scale (that is to say the unit in which geotagged statistical data are available) to the scale of the “typical blocks” the data associated with each statistical area were distributed in each cell or portion of cell. A weighting was then applied according to the build surfaces superimposed to a census blocks (see figure 2).
Figure 2: Weighting of census data
CHOICE OF TYPICAL BLOCKS
The "typical blocks" as we define them are archetypical representations of urban forms. According to Panerai [9], the type is an object which allows having a global view of a large population, whether it is buildings, or urban blocks, or neighborhood... The “typical blocks” selected have to represent contrasted urban forms allowing the identification of the impacts of different morphological factors on microclimate, energy consumption and renewable energy potential. Moreover, these urban forms have to represent Paris and other European cities. Finally, these "typical blocks" should represent the city possible developments for the next 100 years.
Various methods exist in the literature for the selection of urban types. We focused on two types: Methods such as "families of references" [3] consist in
identifying, for a city, all the buildings that are representative of a type or period. Methods such as "simplified morphologies" [10] consist in choosing
simplified theoretical morphologies that are
representative of urban forms to be studied. We chose an intermediate method with representative morphologies of existing urban forms, which will be simplified. These “typical blocks” are abstractions reflecting the reality. We chose seven typical blocks (see table 1). Note that these types are purely morphological and independent of their use. For example, both the ancient centre and the pavilion buildings can be houses or offices.
Table 1: The seven typical blocks
Continuous pavilion Discontinuous pavilion Continuous block Discontinuous block High-rise tower Ancient center Industrial building
This choice was validated by interviews with Parisian urban planners of the IAU-IDF (Institute of Urban Planning of the region Ile-de-France) and a questionnaire completed by members of the APUMP (Association of Professionals of Urbanism of the region Midi-Pyrenees). Furthermore, a study by Nathalie Long [8] led to similar conclusions with several classes of buildings: industrial buildings, Ancient centre, close centre, large housing blocks, multiple housing, and four types of pavilion.
INDICATORS SELECTION
We selected a large amount of parameters in order to complete a principal component analysis (PCA), assigning a typical block to each cell of our grid. A principal component analysis is a multi-criteria statistical
analysis allowing to: (1) select only significant
parameters, (2) calculate the euclidean distances between each individual (i.e., each cell), (3) group individuals according to their proximity.
With this in mind, we were as exhaustive as possible in the choice of parameters, knowing that they will be reduced by the PCA. We went through an exhaustive study of the literature regarding parameters that enable to characterize an urban typology. We divided those parameters into five areas: Insertion in urban fabrics, Public spaces (including the network of roads), Parcel of land, Urban block and Building. As explained by Panerai [9], a type of building must make sense in both spatial and temporal contexts. This is why the first area of analysis is the insertion in the urban fabric. For each of those areas we defined indicators that can be calculated at different scales and aggregated into each cell. In the end, we came up with over fifty parameters to describe urban morphology.
PRINCIPAL COMPONANT ANALYSIS
We carried out the Principal Component Analysis (PCA) with the software TANAGRA, that is a free and open-source data-mining software developed at the University of Lyon II by Ricco Rakotomalala for teaching and research purpose [11]. The PCA allowed us to identify some strong correlations between indicators. For instance, figure 3 represents the linear correlation between floor area ratio (floor area of a building divided by it footprint) and height of a building. We use those correlations to reduce the number of parameters to thirty.
Figure 3: Correlation between floor area ratio and height The second step of the PCA consists in clustering the individual into groups. There are eight criteria that are the most accurate to characterize Parisian typologies: built density, open space ratio, population density, average height of buildings, contiguity, percentage of individual housing units per multifamily housing units, density of road surface, root-mean-square deviation of buildings heights. Built density is the main criterion, but we
demonstrated that it is not sufficient to accurately determine the typologies of a city. The age of the buildings does not appear as an accurate criterion to identify a typology but we kept that parameter into our map because it will be helpful to characterize the thermal properties of the building and the way this building will evolve.
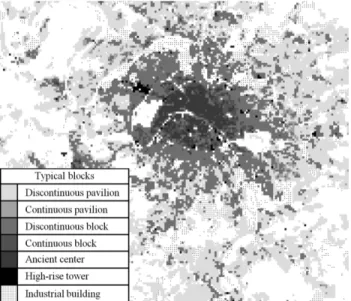
RESULT: PARIS ARCHETYPICAL MAP
Using this PCA we created an archetypical map of Paris and its suburbs (figure 4). In order to model the spread of the city until 2100, the map covers an area of 100 km by 100 km centered on Paris. For each typical block, we described the urban morphology with tables summarizing main criteria as shows of Table 2.
Figure 4: Portion of the archetypical map of Paris
Discontinuous pavilion:
This type of cells is the most usual; it covers the majority of the studied area (over 61%), mostly in the suburb. On a socio-cultural approach, most households wish to live in individual houses. Indeed, according to a national survey, 87% of French households would rather live in individual houses [12]. All the buildings are residential buildings with a homogeneous morphology. As we could imagine, the build density of pavilion is low (around 0.3), their average height is 6.6 m (corresponding to two levels), and the contiguity as the compactness are low (average contiguity is 0.03 and average compactness is 4.7). We observe some disparities in the density of green areas: thus higher than in the other typologies, it decreases as build density and road surfaces raise and as the houses get closer to the city centre. The explanation is mainly economic: as the real estate price level increases close to the city centre, households cannot afford large gardens.
Table 2: Main criteria for Continuous pavilion
Continuous pavilion:
With 3% of the surfaces, continuous pavilion are a transition between the city and the suburbs. Those residential buildings are rather homogeneous in their morphology and similar to the discontinuous pavilion. The main differences concern the build density that is slightly higher (with an average density of 0.7), as the average height (9.9 m, corresponding to three levels) and the contiguity (around 0.04). In relation to their location in the city, continuous pavilion has a lower density of green area and a higher density of roads. For both continuous and discontinuous pavilions, the ages of the buildings show that those morphologies were built continuously through times. This is consistent with the fact that individual housing was and still is a reference for households. In both cases, we can observe a raise in construction between 1949 and 1974 which corresponds to the need and the political will to build in large quantities after the war.
Discontinuous blocks
Those typical blocks represent 16% of the studied area. They are mainly residential, but 11.5% of them are office buildings. Discontinuous blocks are less homogeneous than pavilions. They can easily be characterized by higher
compactness (5.2) and heights (13.9 m, about 5 levels). Despite that, their density is not high (0.8 for the average built density), the ground being largely occupied by roads and green areas (parks or waste grounds).
Continuous blocks
Continuous blocks are typologies often met in dense areas close to the city center. They represent less than 2% of the studied area. Their heights are not very different from discontinuous blocks (18.4 m i.e. 6 levels) but their built density is twice higher (2.1) due to a high contiguity (0.29). Those buildings are often housings but can be occupied by offices (11.1%) especially on the first floor. We can observe that a large number of those buildings were built before 1949 and hygienic urban planning.
Ancient centre
Those typical blocks represent only 2% of the studied area but they might be the most notorious of Paris. Buildings of the ancient centre are either medieval or Haussmannian. Therefore, their block plan is very recognizable in particular the courtyard composing the blocks. Ancient centre is the typology that meets the highest density with an average built density of 3.1 and a maximum build density of 4.9. This morphology is very close to the continuous buildings though more homogenous. Those buildings, located in the centre of Paris, are offices (for 11.4%) or housing buildings (for 88.6%). As we expected, almost all of those buildings were built before 1949.
High rise tower
Paris is one of the rare capitals with few skyscrapers. As a consequence, high rise towers represent only 0.3 % of the studied area. Those building are either large housing blocks built in the years 1960-1970 (during the after-war housing crisis, industrialization of construction appeared as a solution), or office towers. Despite their heterogeneity, they are easily recognizable from their heights (around 40 m corresponding to 13 levels, up to 85 m corresponding to 28 levels). Their compactness is not the highest (5.0) and their contiguity is rather low (around 0.2) which leads to an average built density (around 2.6), despite the high rise factor. Indeed, the ground is largely occupied by green areas and road surfaces. The age of the buildings shows that those morphologies were not build before 1949 neither after 1989 (after 1970, large housing blocks construction was stopped because of the social and urban issues implied).
Industrial buildings
Industrial buildings, often neglected in urban
morphological studies, represent over 15% of the studied area. Those buildings are mostly industrial (81.2%) but
also commercial (15.8%) and agricultural (3%). They are strongly heterogeneous but their main similarity is large footprints. The age of the buildings shows that those morphologies were built continuously through times.
VALIDATION
The Institute of Urban Planning of the region Ile-de-France put at our disposal their urban database: the MOS (Model of Land Use). This nationally recognized database contains up to 81 classes of land use. For each class, we established a correspondence with our seven typical blocks. For instance, the class 25 “Continuous low rise housing” of the MOS, corresponds to our typical block “Continuous pavilion”.
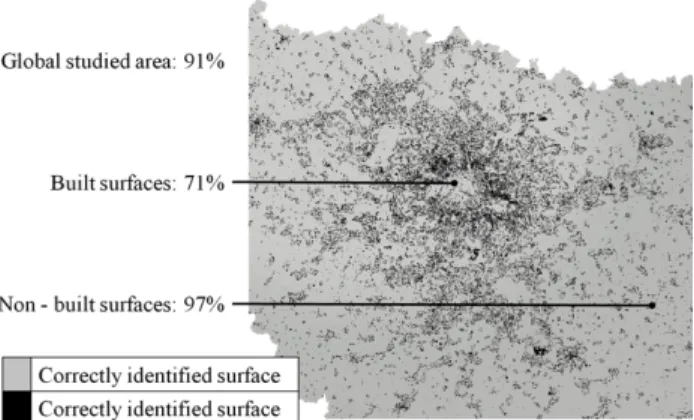
Figure 5: Validation of the map
With the GIS software ARCGIS, we intersected our map with the map of the MOS. For each portion of land obtained, we checked if the class of the MOS and the typical block were consistent. Then, we evaluated the percentage of the correctly identified surfaces. We obtained excellent results on the whole area with 91% of match. This result is partially due to the fact that GENIUS easily identifies non-built areas and that they constitute the majority of the studied zone. In the build area, the percentage remains good with around 71% of matching surfaces. The percentages are different according to the typical blocks. For each type, a detailed analysis shows that the first cause of error are some few mistakes between classes with similar densities. There are also some errors due to industrial buildings that are present in other typical block. Those errors can be due to the fact that industrial buildings are often larges buildings, and that they are cut by our grid creating some errors in the edges.
The map obtained is representative and will provide an accurate simulation of the city energy consumptions and microclimate in both present and future.
CONCLUSION AND OUTLOOKS
In a second phase, GENIUS transforms the initial map, year after year, by taking into account changes in density. In that sense, GENIUS communicates with NEDUM, a model developed by the CIRED (International Centre for Environment and Development), that simulates the spread of the city and provides information on build density [13]. NEDUM is a socio-economic model taking into account land-use and transport network interactions to determine spatial distribution of buildings density across the city.
GENIUS uses the maps produced by NEDUM to build, year after year, new maps at a more precise scale.The main assumption of our work is the continuity in urban form. As explained by Pannerai [9], the city keeps track of its history. Thus, it is very likely that the future shape of an urban block depends on its past form. We will therefore take into account each year the type of pre-existing “typical block” and cross this information with the changes in density given by NEDUM. As long as it remains within a density range compatible with its type, the cell keeps the same typology or (i.e. the same typical block). The typical block only changes if two conditions are met:
-‐ First condition: the building has existed for at least 50 years. Indeed, one cannot picture a city where buildings are put down and rebuilt every year, even though economic and demographic pressure is important.
-‐ Second condition: density exceeds the upper limit or is below the lower one of the typical block. We considered that the density can change in a cell: as long as this change is low, the type does not change. Beyond certain limits, the cell changes from one typical block to another. Those limits have been established through a statistical analysis of the existing city. Other range of density will allow us to adapt the evolution to different scenarios.
With those evolution rules, we will establish different scenarios to predict possible evolutions for the city of Paris. Three scenarios have been tested so far: business as usual (the urban sprawl goes on without any intervention), dense city (discontinuous pavilion is discouraged and the growth of the city is contained) and green city (the growth of the city is contained but the creation of parks is planned).
In the future, typical blocks maps will be transformed into a high definition maps. For each cell, we will define precise buildings footprint with additional information (floor surface, height, thermal characteristics) by taking
into account the corresponding “typical block” and the age of the cell.
With contrasting scenarios traduced into high definition maps, we will be able to use modelling tools to evaluate the environmental performances of those imaginary cities. How much energy will they consume? How much renewable energy will they be able to produce? Will they enhance heat island effect or protect the citizens from global warming? Moreover, the map of the current Paris will be a support to come up with a localised diagnostics, and thus be a tool for urban
planners facing environmental challenges. The
methodology developed in this paper is adapted to urban, suburban and rural zones. Thus, it can be adapted on different territories in Europe or others continents.
ACKNOWLEDGEMENTS
This work received support from the French National Research Agency (Agence Nationale de la Recherche) with the reference ANR-09-VILL-0003.
REFERENCES
1. Jollands. N. (2008) Cities and energy. In Competitive Cities and Climate Change. p 136.
2. Traisnel. J.-P. (2001) Habitat et développement durable. bilan rétrospectif et prospectif.
3. APUR. (2007) Consommations d’énergie et émissions de gaz à effet de serre liées au chauffage des résidences principales parisiennes.
4. Oke. T. R. The energetic basis of the urban heat island. In Quarterly Journal of the Royal Meteorological Society. 5. Oke. T. R. (1988) Street design and urban canopy layer climate. In Energy and Buildings 11. 103–113.
6. Eliasson. I. (1996) Urban nocturnal temperatures. street geometry and land use. Atmospheric Environment 30. 379–392. 7. Stewart, I., and T. Oke. (2009) Classifying Urban Climate Field Sites by “Local Climate Zones”. In International Association for Urban Climate 34
8. Long. N.. and Kergomard. C. (2005) Classification morphologique du tissus urbain pour des applications climatologiques. In Revue internationale de geomatique 15. 9. Panerai. P.. Demorgon. M.. and Depaule. J. C. (1999) Analyse urbaine. Parenthèses.
10. The Martin Center for architectural and urban studies - Department of architecture - University of Cambridge. (1997) Project ZED (toward Zero Emission urban Development). European Commission D.G. XII - Science. research and development. Cambridge (U.K.).
11. Rakotomalala. R. (2005) TANAGRA: a free software for research and academic purposes. In Proceedings of EGC. 12. Gaut. G. and Bedeau. L. (2007) Les français et leur habitat. Perception de la densité et des formes d’habitat. ODV.
13. Viguié. V. and Hallegatte. S. Technical report on NEDUM model development. VURCA Project. Task 2. deliverable n 2.