HAL Id: hal-00646701
https://hal.archives-ouvertes.fr/hal-00646701
Submitted on 30 Nov 2011
HAL is a multi-disciplinary open access
archive for the deposit and dissemination of
sci-entific research documents, whether they are
pub-lished or not. The documents may come from
teaching and research institutions in France or
abroad, or from public or private research centers.
L’archive ouverte pluridisciplinaire HAL, est
destinée au dépôt et à la diffusion de documents
scientifiques de niveau recherche, publiés ou non,
émanant des établissements d’enseignement et de
recherche français ou étrangers, des laboratoires
publics ou privés.
Low-level cues and ultra-fast face detection.
Sébastien M Crouzet, Simon J Thorpe
To cite this version:
Sébastien M Crouzet, Simon J Thorpe. Low-level cues and ultra-fast face detection.. Frontiers in
Psychology, Frontiers, 2011, 2, pp.342. �10.3389/fpsyg.2011.00342�. �hal-00646701�
Low-level cues and ultra-fast face detection
Sébastien M. Crouzet1and Simon J. Thorpe2,3*
1Department of Cognitive, Linguistic and Psychological Science, Brown University, Providence, RI, USA 2
Centre de Recherche Cerveau et Cognition, Université de Toulouse, UPS, Toulouse, France 3
Centre National de la Recherche Scientifique, CerCo, Toulouse, France
Edited by:
Gabriel Kreiman, Harvard, USA
Reviewed by:
Corrado Caudek, Università di Firenze, Italy
Paolo Martini, University of Warwick, UK
*Correspondence:
Simon J. Thorpe, Centre de Recherche Cerveau et Cognition, Université de Toulouse, 31062 Toulouse, France.
e-mail: simon.thorpe@cerco. ups-tlse.fr
Recent experimental work has demonstrated the existence of extremely rapid saccades
toward faces in natural scenes that can be initiated only 100 ms after image onset (Crouzet
et al., 2010). These ultra-rapid saccades constitute a major challenge to current models of
processing in the visual system because they do not seem to leave enough time for even a single feed-forward pass through the ventral stream. Here we explore the possibility that the information required to trigger these very fast saccades could be extracted very early on in visual processing using relatively low-level amplitude spectrum (AS) information in the Fourier domain. Experiment 1 showed that AS normalization can significantly alter face-detection performance. However, a decrease of performance following AS normalization
does not alone prove that AS-based information is used (Gaspar and Rousselet, 2009). In
Experiment 2, following the Gaspar and Rousselet paper, we used a swapping procedure to clarify the role of AS information in fast object detection. Our experiment is composed of three conditions: (i) original images, (ii) category swapped, in which the face image has the AS of a vehicle, and the vehicle has the AS of a face, and (iii) identity swapped, where the face has the AS of another face image, and the vehicle has the AS of another vehicle image. The results showed very similar levels of performance in the original and identity swapped conditions, and a clear drop in the category swapped condition. This result demonstrates that, in the early temporal window offered by the saccadic choice task, the visual saccadic system does indeed rely on low-level AS information in order to rapidly detect faces. This sort of crude diagnostic information could potentially be derived very early on in the visual system, possibly as early as V1 and V2.
Keywords: natural scenes, fast saccades, Fourier transform, amplitude spectrum, face detection
INTRODUCTION
The time needed to detect the presence of an object in a com-plex natural scene can be remarkably short (Potter, 1975;Thorpe
et al., 1996;Kirchner and Thorpe, 2006). The Kirchner and Thorpe
study showed that if two images are presented to human subjects left and right of a fixation, they can selectively saccade on the image containing an animal as early as 120–130 ms after stimulus onset. Recently, it has been show that this processing time could be even shorter if targets are human faces, with reliable saccadic responses
starting only 100 ms after image display (Crouzet et al., 2010).
Additionally, this extremely fast processing is associated with a very strong bias toward faces, such that when subjects attempt to saccade toward another category of stimulus such as vehicles (faces in this case were used as distractors), performance is particularly poor, especially when the saccades are initiated at short latencies.
This kind of extremely rapid processing puts very severe con-straints on underlying visual processing. Given that the earliest saccades toward faces can be initiated at 100 ms, it follows that the brain mechanisms that trigger the response must be even earlier. It is often assumed that the delays in the oculomotor circuit lead-ing to activation of the eye muscles are of the order of 20 ms or so, implying that the “decision” to move is presumably made at a latency of only 80 ms. Even a pure feed-forward processing sweep
from the retina to the human homolog of inferotemporal
cor-tex (IT), where object selective neurons are found (Tanaka, 1996),
might be too long as it is suggested by single-cell recordings in
monkeys (seeLamme and Roelfsema, 2000for a review; see also
Tsao et al., 2006) or Local Field Potentials in humans (Liu et al.,
2009). Instead, the visual system might base these rapid behavioral
decisions on information that is only partially processed, leading to what might be termed a “quick and dirty” processing strategy.
A good candidate to be the basis of this “quick and dirty” pro-cessing could be amplitude spectrum (AS) information of the image in the Fourier domain. The analogy between the early stages of processing in the visual system and Fourier analysis is
long standing (Marr, 1982; seeWestheimer, 2001for an
histori-cal review). Early visual processing has often been described as a
form of filtering operation (Campbell and Robson, 1968;Marr,
1982; Field, 1999). Although image semantics does not depend
on spatial-frequency amplitude but rather on phase information
(Oppenheim and Lim, 1981;Piotrowski and Campbell, 1982), the
Fourier spectral signatures of scenes have been used by
computa-tional models to infer scene categories (Oliva and Torralba, 2001;
Torralba and Oliva, 2003). Indeed, it has been suggested that the
human visual system can take advantage of these low-level nat-ural image statistics to perform more complex tasks. For example,
Crouzet and Thorpe Ultra-fast face detection
rapid image recognition can be biased by priming using
infor-mation concerning the AS (for global scene properties:Guyader
et al., 2004; or animal detection:Kaping et al., 2007). However,
studies that have directly manipulated the target images for recog-nition suggest that it is not used for global scene categorization
(Loschky et al., 2007;Loschky and Larson, 2008) but see (Joubert
et al., 2009), animal detection (Wichmann et al., 2006;Gaspar and
Rousselet, 2009), even using fast saccadic responses (Wichmann
et al., 2010).
However, face detection could be a special case. Amplitude information has been claimed to be responsible for face
pop-out in visual search (Vanrullen, 2006), but see also (Hershler and
Hochstein, 2006). Recently, a study explicitly tested the role of
amplitude information for fast saccades toward faces. Using a
sim-ilar design toWichmann et al. (2010)but replacing the manual
response by a saccadic choice task, they showed that amplitude
alone can bias fast saccadic responses toward faces (Honey et al.,
2008). Furthermore, numerous studies have already showed that
faces have specific characteristics in the frequency domain (Keil,
2008, 2009;Keil et al., 2008;Nestor et al., 2008;Dakin and Watt,
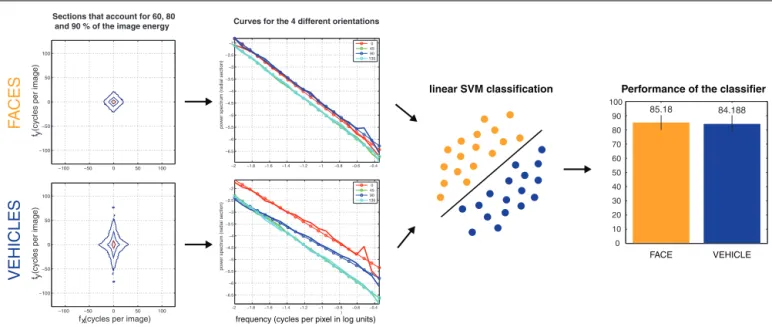
2009). As a demonstration, an amplitude-only based
classifica-tion performs surprisingly well when separating the set of images
used inCrouzet et al., 2010; 85% on faces; and 84% on vehicles,
see Figure 1). This particularity could thus be used by the visual saccadic system.
In the present study, using the same set of images than in an earlier study, we investigated the role of AS information in ultra-rapid detection of faces. In Experiment 1, we compared the
subject performance in a saccadic choice task where they had to discriminate between faces and vehicles, using either unmodified or amplitude normalized images. A performance drop in the nor-malized condition would mean that this type of information plays a significant role in the task. The observed decrease of performance when subjects had to saccade toward faces suggests that amplitude information is indeed important for fast face detection. However, this decrease might at least partially be caused by the edge noise added to images by the AS normalization rather than the absence
of specific amplitude information (Gaspar and Rousselet, 2009).
Experiment 2, designed to address this issue, showed that edge noise alone cannot explain the result, but rather suggested that amplitude information is effectively used to guide fast saccades, even if phase information is still the most important. Together, these results suggest that the visual system does indeed use incom-pletely processed information to help make the extremely rapid behavioral responses that are seen with face stimuli.
GENERAL METHODS
STIMULI
Two hundred photographs selected from the Corel Photo library database and downloaded from the Internet were used to set up two object categories of 100 natural scenes: human faces and vehi-cles. The same set has already been used in a recent study by our group (Crouzet et al., 2010). All the images were converted to
gray-scale and resized to 330× 330 pixels. The global luminance (0.5)
and contrast (RMS= 0.26) were set to be equal between images.
All the image modifications were done using MATLAB.
−2 −1.8 −1.6 −1.4 −1.2 −1 −0.8 −0.6 −0.4 −6.5 −6 −5.5 −5 −4.5 −4 −3.5 −3 −2.5 −2
power spectrum (radial section)
0 45 90 135
x
f (cycles per image)
f y (cycles per image)
−100 −50 0 50 100 −100 −50 0 50 100
Sections that account for 60, 80 and 90 % of the image energy
f y (cycles per image)
−100 −50 0 50 100 −100 −50 0 50 100 −2 −1.8 −1.6 −1.4 −1.2 −1 −0.8 −0.6 −0.4 −6.5 −6 −5.5 −5 −4.5 −4 −3.5 −3 −2.5 −2 )
power spectrum (radial section)
0 45 90 135
frequency (cycles per pixel in log units)
Performance of the classifier
Curves for the 4 different orientations
F A CES VEHICLES linear SVM classification 0 10 20 30 40 50 60 70 80 90 100 85.18 84.188 FACE VEHICLE
FIGURE 1 | Performance of a linear classifier feed with amplitude-only
information to classify face and vehicle images used inCrouzet et al.
(2010). After having resized images to 256× 256, they were passed trough a Hamming window function to remove boundary artifacts. The amplitude of the Fourier transform was then computed on each image. The resulting distribution of frequencies were divided into four bins of orientation (horizontal, vertical, and the two obliques), each one covering 45˚. The distribution of frequencies for each orientation was then encoded by 20 points, resulting in 80 values representing the global features of each image
to feed the classifier. A linear SVM was then trained on half of the images (50% faces, 50% vehicles) and tested on the other half. After 1000 cross-validations with random train and test subsets, we computed the mean performance of the classifier to correctly classify an image in its class. The error bars correspond to the SD. The computing of the global and unlocalized features was based on the MATLAB script
AverageAndPowerSpectrum.m (Torralba and Oliva, 2003), and the classification was done using the LIBSVM 2.9-1 for MATLAB (http://www.csie.ntu.edu.tw/∼cjlin/libsvm/).
APPARATUS
Participants viewed the stimuli in a dimly lit room with their heads on a chin rest to maintain the viewing distance at 60 cm. Stimuli were presented on a IIYAMA Vision Master PRO 454
monitor with the screen resolution set to 800× 600 pixels and
a refresh rate of 100 Hz. The centers of the two images were always 8.6˚ from the fixation cross, resulting in a retinal size for each image of 14˚ by 14˚. Stimuli presentation was done
using MATLAB and the Psychophysics Toolbox 3 (Brainard, 1997;
Pelli, 1997). The background color is the only apparatus
dif-ference between the two experiments. In Experiment 1, a black background was used. In Experiment 2, it has been changed to a mid gray background, which seems to slightly improve performance.
THE SACCADIC CHOICE TASK
A trial takes place as follows: observers had to keep their eyes on a fixation cross which disappeared after a pseudo-random time interval (800–1600 ms). After a 200 ms-time gap, two nat-ural scenes (one face and one vehicle) appeared on each side of the screen for 400 ms (see Figure 2). The task was to make a saccade as quickly and as accurately as possible to the side of the target.
EYE MOVEMENT RECORDING
Eye movements were monitored with an IView Hi-Speed eye-tracker (SensoMotoric Instruments, Berlin, Germany). This infrared tracking system samples eye position at 240 Hz. Saccade detection was performed off-line using the saccade based
algo-rithm of the SMI BeGaze Event Detection (Smeets and Hooge,
2003). Only the first saccade to enter one of the two images after
display onset was analyzed. Only saccades with onsets longer than 80 ms and shorter than 500 ms were kept for the analysis in order to reduce the influence of outliers. Before each run, a 13-point calibration was performed.
FIGURE 2 | Protocol: the saccadic choice task. A fixation cross is
displayed for a pseudo-random time (between 800 and 1600 ms), then, after a 200 ms gap, two images (a target and a distractor) are displayed on the left and right. After a 1000 ms period, a new trial can start.
EXPERIMENT 1
In order to test the influence of AS for the ultra-rapid detection of faces, we made this cue non-informative by averaging it between images. This corresponds to the normalized condition. In this case, the only information still available to discriminate between faces and vehicles is thus phase information. The performance of participants in this normalized condition was compared to their performance with original images.
METHODS
Participants
Eight participants (six males, mean age= 29.5, two left-handed) including the two authors gave written informed consent before participating in the experiment.
Amplitude spectrum normalization
In order to normalize it, we computed the mean AS over all images of the two categories. This mean AS was then re-combined with the original phase of each image, resulting in a second equiva-lent set of images which differed only by their phase information (Figure 3). This method averages the spatial-frequency contents
of all stimuli at each scale and orientation. Design
Using a within-subject design, two tasks (saccading toward faces or toward vehicles) and two types of images (original, normal-ized) were tested here. The whole experiment was divided for each subject in two blocks (one for each task). In each block, runs were alternating between the two types of images. For example, a subject would start with eight runs of 50 trials with faces as the target – these runs alternating between original images and normalized images – and then the same with vehicles as target, blocks, and runs orders being counterbalanced between subjects. Indeed, each image was displayed two times in each condition (once on the left and once on the right hemifield), resulting in 200 trials per condi-tion and per subject. Each block was preceded by a training session of 50 trials (25 with original images and then 25 with normalized images which were not used in the experiment).
RESULTS
The results with original images (168 ms and 88.8% correct in the face task; 197 ms and 72.8% in the vehicle task) are very
compa-rable to the values observed in a previous experiment byCrouzet
et al., 2010; Figure 4). In the normalized condition, when
partic-ipants can only rely on phase information, they were still able to do the task very quickly and accurately (180 ms and 75% correct in the face task; 201 ms and 63.8% in the vehicle task). Using a 2-way ANOVA with factors Task (face, vehicle) and Type (original, normalized), the results showed that even though participants are able to do the task above chance in the normalized condition, their
performance is globally lower (Type global effect: F(1,7)= 52.8,
p< 0.001 for mean RT; F(1,7)= 120.3, p < 0.001 for accuracy), a
result which is consistent with previous studies using this type of
normalization (Wichmann et al., 2006, 2010;Loschky et al., 2007;
Loschky and Larson, 2008;Gaspar and Rousselet, 2009;Joubert
et al., 2009). More specifically, and after correction for multiple
Crouzet and Thorpe Ultra-fast face detection
fx (cycles per image)
f y
(cycles per image)
Sections that account for 60, 80 and 90 % of the image energy
0 50 100 -50 -100 50 100 -50 -100 0
Face images Vehicle images
Mean Amplitude Spectrum of all images
... ...
... ...
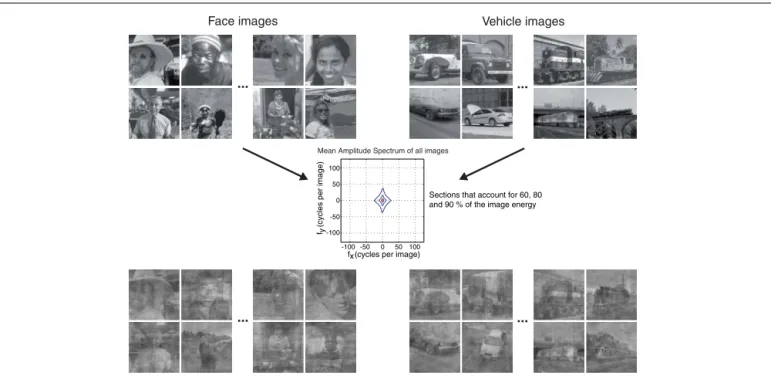
FIGURE 3 | Stimuli of Experiment 1. Examples of original images of faces
and vehicles at the top. In the middle, the mean amplitude spectrum of faces and vehicles images is plotted using a representation where each section
account for 60, 80, and 90% of the image energy. This mean amplitude spectrum was then applied to every image to create the normalized condition. Examples of images for this condition are at the bottom of the figure.
Orig Norm Mean R T (ms) 0 100 200 Orig Norm Accur acy (%) 0 20 40 60 80 100 ORIGINAL A B Reaction time (ms) Propor tion of saccades (%) 0 100 200 300 0 10 20 NORMALIZED Reaction time (ms) 0 100 200 300 01 0 2 0 Orig Norm Mean R T (ms) 0 100 200 Orig Norm Accur acy (%) 0 2 0 4 0 6 0 8 0 100 Reaction time (ms) Propor tion of saccades (%) 0 100 200 300 01 0 2 0 Reaction time (ms) 0 100 200 300 01 0 2 0 F A CE T ASK VEHICLE T ASK 168 180 88.8 75 197 201 72.8 63.8 110 ms 150 ms 170 ms 170 ms
*
FIGURE 4 | Results of Experiment 1. On the top, results when participants
had to saccade toward faces, on the bottom, results when participants had to saccade toward vehicles. (A) Mean RT and accuracy across subjects in the original (Orig) and normalized (Norm) conditions. Error bars represent bootstrapped 95% C. I. of the mean. (B) Distributions of RT in each condition
and each task. Thick lines are for correct responses, thin lines for errors. Orange lines for saccades toward faces, blue lines for saccades toward vehicles. The transparent gray bar is placed according to the minimum RT (the first 10 ms bin of time where correct responses significantly outnumber incorrect ones using aχ2test) when considering all subjects as one.
the decrease in accuracy following normalization is only significant
in the face task (Tukey HSD post hoc test: p< 0.01 in the face task,
p= 0.1 in the vehicle task). In other word, the AS information
seemed to be used particularly when subjects had to target faces.
Furthermore, despite the normalization, the advantage for faces is still present although reduced in size, with an advantage for faces over vehicles of 21 ms and 11% accuracy in the
one (accuracy: p< 0.01; Task global effect: F(1,7)= 18.4, p < 0.01
for mean RT; F(1,7)= 27.5, p < 0.01 for accuracy). A second
conclusion is thus that the AS can explain a part of the bias toward faces, but is not sufficient.
As a summary of Experiment 1, and as expected from previous studies, the AS normalization significantly decreased subjects per-formance. However, this effect was larger in the face task than in the vehicle one. Even if phase information is largely sufficient to induce a bias toward faces, amplitude information could then play a significant role in driving fast saccades.
EXPERIMENT 2
A recent study demonstrated that a performance decrease caused by AS normalization is not sufficient to claim that it is effectively used by the visual system to perform the task. Indeed,Gaspar and
Rousselet (2009)showed that the performance decrease in an
ani-mal detection task caused by AS norani-malization could be entirely explained by the edge noise added incidentally by the manipu-lation, rather than by the absence of amplitude information. To show that, they used an additional condition where every animal image phase spectrum was combined with the AS of another ani-mal image (they did the same for non-aniani-mal images), resulting in images with phase and amplitude from the same category but from different individual images. The performance of their participants in this “identity swapped” condition was similar to the one in the “normalized” condition. This means that in a manual response animal detection task, what matters is not phase or amplitude information by themselves, but the interaction between the two.
However, it has been shown that the AS of faces alone could
attract fast saccades in a saccadic choice task (Honey et al., 2008)
since even when the phase information was completely scrambled, there was still a bias with saccades toward faces. In Experiment 2, we thus used two new image manipulations: (i) a category swapped
condition (SWAcat), where the amplitude spectra of the face and
vehicle images were exchanged and (ii) an identity swapped
condi-tion (SWAid) where the amplitude spectra applied to each image
were taken from another image of the same category. Thus, in all conditions, amplitude differences were still informative, but in
the case of SWAcat, they were inverted between categories. The
only difference between SWAidand ORI being that amplitude and
phase of each image was not consistent. This results in three
dif-ferent conditions: original (ORI), category swapped (SWAcat), and
identity swapped (SWAid) that will be used to investigate further
the role of AS in guiding fast saccades toward faces.
The logic here is as follows. If the amplitude is not used by
subjects to perform the task, the performance in the SWAcatand
SWAidconditions should be equal, and certainly lower than in ORI
because of higher edge noise (Gaspar and Rousselet, 2009). On the
contrary, if the AS is used, performance in the identity swapped condition should be significantly higher than in the category swapped. Our results clearly support the second alternative, argu-ing for the use of amplitude information for fast saccade guidance.
METHODS
Participants
Twelve participants (seven males, mean age= 25.9, one
left-handed) including the first author gave written informed consent before participating in the experiment.
Design
The design was essentially the same as in Experiment 1. The difference was the use of three experimental conditions:
orig-inal (ORI), category swapped (SWAcat), and identity swapped
(SWAid). Every image was seen two times for each of the three
conditions by each participant, as a target and as distractor when
the task is reversed (resulting in 100 images× 2 repetitions × 3
conditions× 2 tasks = 1200 trials per participant).
Image manipulation
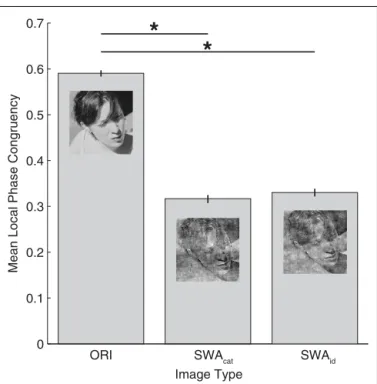
In the original condition, there was no manipulation of the images in the Fourier domain. In the category swapped condition, the amplitude spectra were switched between the two images pre-sented on every trial. Thus, face images had the amplitude from vehicles, and vehicles from faces. In the identity swapped condi-tion, on every trial, the amplitude of each image was replaced by an amplitude randomly selected among the 99 other exemplars of the category (each individual amplitude was used only once per run). For example, a face had the amplitude of another face, resulting in images with amplitude, and phase from the same category but not from the same image. Examples can be seen in Figure 5. A possible confound for this experiment would be different level of edge noise between the category and identity swapped conditions. To control this aspect, a measure of local phase congruency (LPC) based on the MATLAB function phasecong3.m written by Peter Kovesi was made on every image. The results of these measure-ments can be seen on Figure 6, and show that the level of edge noise between category and identity swapped conditions are effec-tively equal, and were both significantly higher than in the original condition.
RESULTS
A global look at the results reveals that the performance in Exper-iment 2 for the original condition was somewhat better than in
Phase information from Amplitude information from ORIGINAL CATEGORY SWAPPED ORIGINAL IDENTITY SWAPPED
CATEGORY SWAPPED IDENTITY SWAPPED
A
B
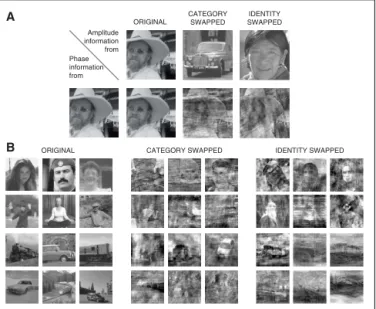
FIGURE 5 | Images used in Experiment 2. (A) Principles of the different
possible combinations between amplitude and phase spectrums with examples for an image. (B) Examples of images used in the three conditions, faces on top and vehicles on bottom.
Crouzet and Thorpe Ultra-fast face detection
Experiment 1 despite the fact that the images used were exactly the same (see Figure 7). A large part of this difference is cer-tainly caused by the change in background color (from black to gray), although inter-subject variability may also be involved. A first analysis of the global effects, using a two-way ANOVA with factors Task (face or vehicle) and Type (original, category, and identity swapped), showed an effect of both on mean RT (Type:
F(2,22)= 13.56, p < 0.001; Task F(1,11)= 44.80, p < 0.001) and
accuracy (Type: F(2,22)= 84.06, p < 0.001; Task: F(1,11)= 43.56,
p< 0.001).
However, the principal aim of this experiment was to test the difference between the original condition and the two conditions involving image manipulations: category and identity swapped. A
post hoc analysis using correction for multiple comparisons (Tukey
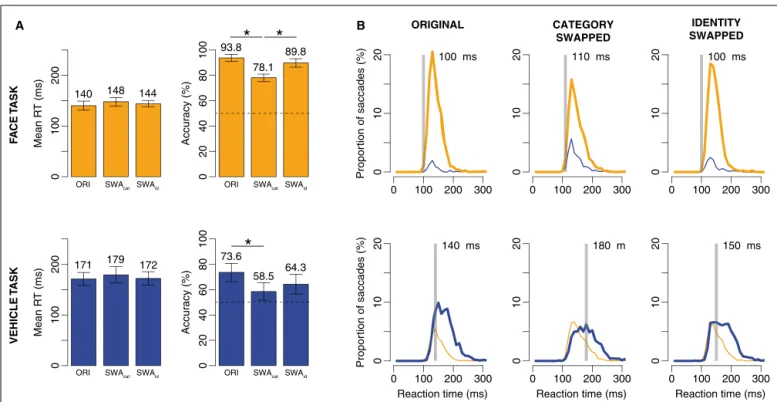
HSD) was used, and revealed no effect on mean RT, thus only analysis of accuracy will be developed. In the face task, the original
(accuracy= 93.8%) and identity swapped (89.8%) conditions led
to comparable levels of performance and were significantly better performed than the category swapped (78.1%). A closer look at RT distributions reveals that even though accuracy was lower in the category swapped condition, the first selective responses still occur very early. In the vehicle task, the effect is less clear, orig-inal (73.6%) and identity swapped (64.3%) conditions are again
ORI SWAid 0 0.1 0.2 0.3 0.4 0.5 0.6 0.7 Image Type
Mean Local Phase Congruency
*
*
SWAcat
FIGURE 6 | Averaged local phase congruency (LPC) over all images as a function of the three image modifications. The function phasecong3.m
(Kovesi, 2000) was applied on every image of each set (ORI, SWAcat, and SWAid) to obtain an LPC value for each image. On an individual image, this value corresponds to the averaged value of the 10 most salient locations (as defined by the output map of the LPC on the original image, seeGaspar and Rousselet, 2009). The results show that the edge strengths are different between the three conditions (F(2,597)= 1392.6, p < 0.001) and significantly higher in the original than in the category and identity swapped sets (test post hoc Tukey HSD). The important result here is that there is no significant difference between the category and identity swapped sets.
comparable, the only difference being between with the category swapped one (58.5%).
Each image category can be divided into two different object sizes: close-up and middle view. It could have been hypothesized that size would have an effect here, caused by the specific image manipulations. However, remarkably, a post hoc analysis showed absolutely no effect: there is no speed or accuracy differences between all the different conditions of size mixing. For example, we found no evidence that mixing the phase information from a close-up face with the amplitude information from a mid-distance view (or the inverse) specifically impaired performance in comparison to other conditions.
As a global conclusion of Experiment 2, the results argue in favor of a significant use of amplitude information by the visual system to guide saccades. Surprisingly, it seems that there is a tendency for amplitude information to also be used by subjects when the task was to target vehicles, even if it is less clear than for faces. Another surprise was that this effect is not limited to just the fastest saccades. So even if, again, phase information seems to be the most important information, AS definitely plays a role in saccade generation.
GENERAL DISCUSSION
Our first goal was to investigate the role of amplitude information in the Fourier spectrum in the generation of fast saccades toward faces. The question raised by this study follows from two recent results which showed that (i) saccades can be selectively oriented toward a target extremely fast (100–110 ms) in the specific case of this target being a face (Crouzet et al., 2010), (ii) in the absence of phase information, amplitude alone can attract fast saccades by its
own if it comes from a face image (Honey et al., 2008). Our first
aim was thus to test the influence of AS information in the effect
observed in Crouzet et al. (2010)study. Experiment 1 showed
that the absence of amplitude information tends to slow down saccadic responses and decrease accuracy. However, Gaspar and Rousselet recently demonstrated that this performance decrease could be explained, not by the lack of amplitude information, but rather by the edge noise incidentally added. This lead to Experi-ment 2 which, using two new image manipulations, showed that subjects had remarkably good performance even if images were composed with phase and amplitude from the same object cate-gory but different images (and thus had a very high-level of edge noise).
To sum up all the results. First, it seems that the bias toward faces over vehicles cannot be eliminated by the different manipulations made on AS. In other words, subjects were always better at saccad-ing toward faces than toward vehicles, even when the amplitude spectra were normalized or swapped. Thus, even though a face-like
AS alone can attract fast saccades (Honey et al., 2008), a large part
of the bias toward faces is caused by phase related information. Second, information from the AS is effectively used by the visual saccadic system to drive fast saccades. This result echoes a recent finding showing that the early face-selective component of the ERP (observed around 100 ms after image presentation) was closely linked to the amplitude content of images, while the later compo-nent (usually observed around 170 ms after image presentation)
SWAid Mean R T (ms) 0 100 200 Accur acy (%) 0 2 04 06 08 0 1 0 0 Propor tion of saccades (%) ORIGINAL 0 100 200 300 0 10 20 100 ms CATEGORY SWAPPED 0 100 200 300 01 0 2 0 110 ms IDENTITY SWAPPED 0 100 200 300 01 0 2 0 100 ms Mean R T (ms) 0 100 200 Accur acy (%) 0 2 0 4 0 6 0 8 0 100 Propor tion of saccades (%) Reaction time (ms) 0 100 200 300 0 10 20 140 ms Reaction time (ms) 0 100 200 300 01 0 20 180 m Reaction time (ms) 0 100 200 300 0 10 20 150 ms F A CE T ASK VEHICLE T ASK 140 148 144 93.8 78.1 89.8 171 179 172 73.6 58.5 64.3
*
*
*
SWAcatORI ORI SWAcat SWAid
SWAid
SWAcat
ORI ORI SWAcat SWAid
A B
FIGURE 7 | Results of Experiment 2. Top: when participants had to saccade
toward faces. Bottom: when participants had to saccade toward vehicles. (A) Mean RT and accuracy across subjects in the original (ORI), category swapped and identity swapped conditions. Error bars represent bootstrapped 95% C.I. of the mean (B) Distributions of RT in each condition and each task.
Thick lines are for correct responses, thin lines for errors. Orange lines for saccades toward faces, blue lines for saccades toward vehicles. The transparent gray bar is placed according to the minimum RT (the first 10 ms bin of time where correct responses become significantly higher than incorrect ones).
WHY AMPLITUDE SPECTRUM WAS USED HERE AND NOT IN MOST OF PREVIOUS STUDIES?
Several previous studies have argued that pure AS information is of limited use for natural scene recognition by human subjects. Nevertheless, most of these studies have used manual responses
(Wichmann et al., 2006;Loschky et al., 2007;Loschky and
Lar-son, 2008;Gaspar and Rousselet, 2009) that have relatively long
latencies. This raises the possibility that the effects observed here might be specific to very rapid saccadic responses. However, a recent study had the same conclusion for an animal detection
using a saccadic choice task similar to the one used here (
Wich-mann et al., 2010). In the experiment 2 of this study, the authors
first showed that animal detection was slightly impaired by AS normalization. Then, they used amplitude information alone to classify their images as animals or non-animals, and divided their set between images for which the classifier was the more confi-dent (easy images) and those for which the classifier was the less confident (difficult images). Finally, with a post hoc analysis, they showed that subjects accuracy differences between easy and diffi-cult images was not only clear in the original condition, but also in the normalized one. The straightforward interpretation was that amplitude information had no causal role on their results for ani-mal detection by human subjects. However, as can be seen in their table of results, SRT were very slow compare to ours (most of their mean RT were above 270 ms, whereas most of our mean RTs were below 200 ms). A contrasted analysis of their results between fast
and slow reaction time would thus be of great interest (Honey
et al., 2008), and we would predict that the interpretation could
be different according to this criterion. Thereby, the difference in reaction time could potentially explain the difference between the two studies, and suggest that amplitude information would play a role especially in an early time of processing.
ECCENTRICITY AND SUMMARY STATISTICS
Time is not the only factor that has to be considered to explain the difference between manual and saccadic studies. Presentation of
images is typically foveal in studies with manual responses (
Wich-mann et al., 2006;Gaspar and Rousselet, 2009), whereas by design
the presentation is peripheral in tasks that involve a saccadic choice
paradigm (Honey et al., 2008, as well as the present study). Could
this difference accounts for the use of AS information in saccadic studies? It is well-known that contour processing as well as
posi-tional accuracy (Levi, 2008;Greenwood et al., 2009) is less and
less precise with eccentricity. Indeed, peripheral vision is
char-acterized by a high degree of spatial uncertainty (Pelli, 1985). A
result of this could be that patterns in a constrained region of the periphery would be processed as textures, so that individual
patterns are not available for discrimination (Orbach and Wilson,
1999). This “jumbled” effect on contours would thus disrupt phase
more than unlocalized amplitude information. In this case, infor-mation contained in the “summary statistics” of the AS could be used to detect objects in the visual field taking account of the low capacity of the visual system in the periphery. According to this hypothesis, the more eccentric the presentation, the more subjects
Crouzet and Thorpe Ultra-fast face detection
would tend to rely on information in the AS. The relatively modest eccentricity used in the saccadic choice task (8˚ from fixation to
stimuli centers, images covering 14˚× 14˚ each of visual angle)
could explain why phase information still plays a significant role, but it could well be that at even more extreme eccentricities, only the information in the AS would be available. To conclude, the two factors (slow vs. fast response, central vs. peripheral presentations) had not been completely dissociated here, although the results of
Wichmann et al. (2010)would argue in favor of the timing
hypoth-esis. Further investigations will definitely be needed to disentangle the contribution of time and eccentricity in the observed effect.
Our conclusion is thus that, contrary to most studies that have used longer RT responses, AS is also used by the visual system to detect objects in the visual field and produce extremely fast behavioral responses. More than a global Fourier analysis of the
entire visual scene (Torralba and Oliva, 2003), a process which is
rather unlikely in the real world, because it would be absolutely non-informative about the localization of objects, a more plausi-ble mechanism would be the fast extraction of AS information in a localized fashion. This could take a patch-wise and multi-scale form, as in a wavelet analysis or in the Spatial Envelope model
(Oliva and Torralba, 2006). This amplitude-based but localized
information seems well-suited to be the basis for ultra-rapid visual processing such as the one observed with a saccadic choice task. Further investigations will be needed to determine how exactly this type of information, present in the early visual system, is used to guide eye movement.
QUICK AND DIRTY PROCESSING FOR FACES
A final point concerns the possibility that the very fast processing based on relatively crude low-level information in the AS may be a specific feature of face processing. Faces are clearly extremely important stimuli for humans, and it is probably vital for survival that we detect and localize any faces in the environment as quickly as possible. As a consequence, it would make good evolutionary sense to devote neural circuits early in visual processing to face
detection (Johnson, 2005). In a sense, the feasibility of devising
relatively simple algorithms for face detection is demonstrated by the availability of relatively efficient face-detection algorithms in many currently available cameras, often based on popular
com-puter vision algorithms (Viola and Jones, 2004). Could equivalent
strategies be implemented in neural circuits? Cortical areas such as V1 and V2 have direct connections to superficial areas of the superior colliculus from a relatively small number of specialized
cortico-tectal projection neurons in layer V (Lock et al., 2003;
Collins et al., 2005). These cells are known to be able to generate
very strong short latency responses in the colliculus (Bereshpolova
et al., 2006), and could provide a way to initiate very rapid eye
movements. Could these cells have the sort of selectivity that would be needed to allow very rapid responses to faces? They certainly have some of the features that would be needed for this: they have extensive dendritic arborizations that extend through many cortical layers including superficial layers and could therefore sam-ple much of the information that is available. If we suppose that some particular combination of orientations and spatial frequen-cies was in some way diagnostic for the presence of a face, it could be that this might be detected by a suitably configured cortico-tectal cell that could then directly trigger activity in the col-liculus. Modeling studies have shown that relatively simple neural architectures can allow both face detection and face identifica-tion to be implemented with little more than a set of orientaidentifica-tion tuned filters as an input, although it has generally been assumed that it be impractical to implement such strategies because of the excessively large number of neurons that would be required
(VanRullen et al., 1998;Delorme and Thorpe, 2001). However, by
using the unlocalized information that could be obtained from cortical complex cells, it may be possible to implement simi-lar architectures with far fewer neurons. Other modeling studies have demonstrated that face-selective responses can be produced simply as the result of a repeated experience with face-like
stim-uli (Masquelier and Thorpe, 2007), something that may occur
early during life because of the high probability of exposure to faces.
In conclusion, we would argue that the results presented here imply that the brain may well use some very specific strate-gies for detecting and localizing faces that could potentially be implemented remarkably early on in the visual processing sequence. Such strategies may not be sufficient for performing more demanding tasks such as determining facial expression or identity, but they could allow useful behavior to be generated at very short latencies.
ACKNOWLEDGMENTS
We would like to thank Guillaume Rousselet for his useful com-ments on the original idea and design of Experiment 2. This work was supported by the Délégation Générale pour l’Armement (DGA), the Fondation pour la Recherche Médicale (FRM), and the Agence Nationale pour la Recherche (ANR).
REFERENCES
Bereshpolova, Y., Stoelzel, C. R., Gusev, A. G., Bezdudnaya, T., and Swad-low, H. A. (2006). The impact of a corticotectal impulse on the awake superior colliculus. J. Neurosci. 26, 2250–2259.
Brainard, D. (1997). The psychophysics toolbox. Spat. Vis. 10, 433–436. Campbell, F. W., and Robson, J. G.
(1968). Application of Fourier
analysis to the visibility of
grat-ings. J. Physiol. (Lond.) 197,
551–566.
Collins, C. E., Lyon, D. C., and Kaas, J. H. (2005). Distribution across cortical areas of neurons project-ing to the superior colliculus in new world monkeys. Anat. Rec. A
Discov. Mol. Cell. Evol. Biol. 285,
619–627.
Crouzet, S. M., Kirchner, H., and Thorpe, S. J. (2010). Fast saccades toward faces: face detection in just 100 ms. J. Vis. 10, 1–17.
Dakin, S., and Watt, R. (2009). Biologi-cal “bar codes” in human faces. J. Vis. 9, 2.
Delorme, A., and Thorpe, S. J. (2001). Face identification using one spike per neuron: resistance to image degradations. Neural. Netw. 14, 795–803.
Field, D. J. (1999). Wavelets, vision and the statistics of natural scenes.
Philos. Trans. R. Soc. Lond. A 357,
2527–2542.
Gaspar, C. M., and Rousselet, G. A. (2009). How do amplitude
spectra influence rapid
ani-mal detection? Vision Res. 49, 3001–3012.
Greenwood, J. A., Bex, P. J., and Dakin, S. C. (2009). Positional averaging explains crowding with letter-like stimuli. Proc. Natl. Acad. Sci. U.S.A. 106, 13130–13135.
Guyader, N., Chauvin, A., Peyrin,
C., Herault, J., and
Maren-daz, C. (2004). Image phase
or amplitude? Rapid scene
categorization is an amplitude-based process. C. R. Biol. 327, 313–318.
Hershler, O., and Hochstein, S. (2006). With a careful look: still no low-level
confound to face pop-out. Vision
Res. 46, 3028–3035.
Honey, C., Kirchner, H., and VanRullen, R. (2008). Faces in the cloud: Fourier power spectrum biases ultrarapid face detection. J. Vis. 8, 1–13. Johnson, M. H. (2005). Subcortical face
processing. Nat. Rev. Neurosci. 6, 787–798.
Joubert, O. R., Rousselet, G. A., Fabre-Thorpe, M., and Fize, D. (2009). Rapid visual categorization of nat-ural scene contexts with equalized amplitude spectrum and increasing phase noise. J. Vis. 9, 1–16. Kaping, D., Tzvetanov, T., and Treue,
S. (2007). Adaptation to statistical properties of visual scenes biases rapid categorization. Vis. Cogn. 15, 12–19.
Keil, M. S. (2008). Does face image sta-tistics predict a preferred spatial fre-quency for human face processing?
Proc. R. Soc. Lond. B Biol. Sci. 275,
2095–2100.
Keil, M. S. (2009). “I look in your eyes, honey”: internal face fea-tures induce spatial frequency pref-erence for human face processing.
PLoS Comput. Biol. 5, e1000329.
doi:10.1371/journal.pcbi.1000329 Keil, M. S., Lapedriza, A., Masip, D., and
Vitria, J. (2008). Preferred spatial fre-quencies for human face processing are associated with optimal class dis-crimination in the machine. PLoS
ONE 3, e2590.
doi:10.1371/jour-nal.pone.0002590
Kirchner, H., and Thorpe, S. J. (2006). Ultra-rapid object detection with saccadic eye movements: visual pro-cessing speed revisited. Vision Res. 46, 1762–1776.
Kovesi, P. D. (2000).
MAT-LAB and Octave Functions for Computer Vision and Image Processing. Available at: http://www.csse.uwa.edu.au/( pk/res earch/matlabfns/
Lamme, V. A., and Roelfsema, P. R. (2000). The distinct modes of
vision offered by feedforward and recurrent processing. Trends
Neu-rosci. 23, 571–579.
Levi, D. M. (2008). Crowding – an essential bottleneck for object recog-nition: a mini-review. Vision Res. 48, 635–654.
Liu, H., Agam, Y., Madsen, J. R., and Kreiman, G. (2009). Timing, tim-ing, timing: fast decoding of object information from intracranial field potentials in human visual cortex.
Neuron 62, 281–290.
Lock, T. M., Baizer, J. S., and Bender, D. B. (2003). Distribution of corti-cotectal cells in macaque. Exp. Brain
Res. 151, 455–470.
Loschky, L. C., and Larson, A. M. (2008). Localized information is necessary for scene categorization, including the Natural/Man-made distinction.
J. Vis. 8, 1–9.
Loschky, L. C., Sethi, A., Simons, D. J., Pydimarri, T. N., Ochs, D., and Corbeille, J. L. (2007). The impor-tance of information localization in scene gist recognition. J. Exp.
Psychol. Hum. Percept. Perform. 33,
1431–1450.
Marr, D. (1982). Vision: A
Computa-tional Investigation into the Human Representation and Processing of Visual Information. New York, NY:
Henry Holt and Co., Inc. Masquelier, T., and Thorpe, S. J.
(2007). Unsupervised learning of visual features through spike tim-ing dependent plasticity. PLoS
Com-put. Biol. 3, e31.
doi:10.1371/jour-nal.pcbi.0030031
Nestor, A., Vettel, J. M., and Tarr, M. J. (2008). Task-specific codes for face recognition: how they shape the neural representation of features for detection and individuation. PLoS
ONE 3, e3978.
doi:10.1371/jour-nal.pone.0003978
Oliva, A., and Torralba, A. (2001). Mod-eling the shape of the scene: a holistic representation of the spatial enve-lope. Int. J. Comput. Vis. 42, 145–175.
Oliva, A., and Torralba, A. (2006). Build-ing the gist of a scene: the role of global image features in recognition.
Prog. Brain Res. 155, 23–36.
Oppenheim, A. V., and Lim, J. S. (1981). The Importance of Phase in Signals.
Proc. IEEE 69, 529–541.
Orbach, H. S., and Wilson, H. R. (1999). Factors limiting peripheral pattern discrimination. Spat. Vis. 12, 83–106.
Pelli, D. (1997). The VideoToolbox soft-ware for visual psychophysics: trans-forming numbers into movies. Spat.
Vis. 10, 437–442.
Pelli, D. G. (1985). Uncertainty explains many aspects of visual contrast detection and discrimination. J. Opt.
Soc. Am. A 2, 1508–1532.
Piotrowski, L. N., and Campbell, F. W. (1982). A demonstration of the visual importance and flexibility of spatial- frequency amplitude and phase. Perception 11, 337–346. Potter, M. C. (1975). Meaning in visual
search. Science 187, 965–966. Rossion, B., and Caharel, S. (2011).
ERP evidence for the speed of face categorization in the human brain: disentangling the contribu-tion of low-level visual cues from face perception. Vision Res. 51, 1297–1311.
Smeets, J. B., and Hooge, I. T. (2003). Nature of variability in saccades. J.
Neurophysiol. 90, 12–20.
Tanaka, K. (1996). Inferotemporal cor-tex and object vision. Annu. Rev.
Neurosci. 19, 109–139.
Thorpe, S., Fize, D., and Marlot, C. (1996). Speed of processing in the human visual system. Nature 381, 520–522.
Torralba, A., and Oliva, A. (2003). Sta-tistics of natural image categories.
Network 14, 391–412.
Tsao, D. Y., Freiwald, W. A., Tootell, R. B. H., and Livingstone, M. S. (2006). A cortical region consisting entirely of face-selective cells. Science 311, 670–674.
Vanrullen, R. (2006). On second
glance: still no high-level pop-out effect for faces. Vision Res. 46, 3017–3027.
VanRullen, R., Gautrais, J., Delorme, A., and Thorpe, S. (1998). Face pro-cessing using one spike per neurone.
Biosystems 48, 229–239.
Viola, P., and Jones, M. J. (2004). Robust real-time face detection. Int. J.
Com-put. Vis. 57, 137–154.
Westheimer, G. (2001). The Fourier theory of vision. Perception 30, 531–541.
Wichmann, F. A., Braun, D. I., and Gegenfurtner, K. R. (2006). Phase noise and the classification of natural images. Vision Res. 46, 1520–1529.
Wichmann, F. A., Drewes, J., Rosas, P., and Gegenfurtner, K. R. (2010). Animal detection in natural scenes: critical features revisited. J. Vis. 10, 1–27.
Conflict of Interest Statement: The
authors declare that the research was conducted in the absence of any commercial or financial relationships that could be construed as a potential conflict of interest.
Received: 15 June 2011; accepted: 01 November 2011; published online: 21 November 2011.
Citation: Crouzet SM and Thorpe SJ (2011) Low-level cues and ultra-fast face detection. Front. Psychology 2:342. doi: 10.3389/fpsyg.2011.00342
This article was submitted to Frontiers in Perception Science, a specialty of Frontiers in Psychology.
Copyright © 2011 Crouzet and Thorpe. This is an open-access article subject to a non-exclusive license between the authors and Frontiers Media SA, which permits use, distribution and reproduc-tion in other forums, provided the original authors and source are credited and other Frontiers conditions are complied with.