HAL Id: hal-01571471
https://hal.inria.fr/hal-01571471
Submitted on 2 Aug 2017
HAL is a multi-disciplinary open access
archive for the deposit and dissemination of
sci-entific research documents, whether they are
pub-lished or not. The documents may come from
teaching and research institutions in France or
abroad, or from public or private research centers.
L’archive ouverte pluridisciplinaire HAL, est
destinée au dépôt et à la diffusion de documents
scientifiques de niveau recherche, publiés ou non,
émanant des établissements d’enseignement et de
recherche français ou étrangers, des laboratoires
publics ou privés.
Distributed under a Creative Commons Attribution| 4.0 International License
Intelligent Selection of Human miRNAs and Mouse
mRNAs Related to Obstructive Nephropathy
Ioannis Valavanis, P. Moulos, Ilias Maglogiannis, Julie Klein, Joost Schanstra,
Aristotelis Chatziioannou
To cite this version:
Ioannis Valavanis, P. Moulos, Ilias Maglogiannis, Julie Klein, Joost Schanstra, et al.. Intelligent
Selec-tion of Human miRNAs and Mouse mRNAs Related to Obstructive Nephropathy. 12th Engineering
Applications of Neural Networks (EANN 2011) and 7th Artificial Intelligence Applications and
Inno-vations (AIAI), Sep 2011, Corfu, Greece. pp.464-471, �10.1007/978-3-642-23960-1_54�. �hal-01571471�
Intelligent Selection of human miRNAs and mouse
mRNAs related to Obstructive Nephropathy
Ioannis Valavanis1*, P. Moulos1, Ilias Maglogiannis2, Julie Klein3, JoostSchanstra3, and Aristotelis Chatziioannou1*
1Institute of Biological Research and Biotechnology, National Hellenic Research Foundation, Athens, Greece
2Department of Biomedical Informatics, University of Central Greece, Lamia, Greece 3Institut National de la Santé et de la Recherche Médicale (INSERM), U858, Toulouse,
France
*Corresponding authors {ivalavan, pmoulos, achatzist}@eie.gr
{joost-peter.schanstra, julie.klein}@inserm.fr
Abstract. Obstructive Nephropathy (ON) is a renal disease and its pathology is
believed to be magnified by various molecular processes. In the current study, we apply an intelligent workflow implemented in Rapidminer data mining platform to two different ON datasets. Our scope is to select the most important actors in two corresponding molecular information levels: human miRNA and mouse mRNA. A forward selection method with an embedded nearest neighbor classifier is initially applied to select the most important features in each level. The resulting features are next fed to classifiers appropriately tested utilizing a leave-one-out resampling technique in order to evaluate the relevance of the selected input features when used to classify subjects into output classes defined by ON severity. Preliminary results show that high classification accuracies are obtained, and are supported by the fact that the selected miRNAs or mRNAs have been found significant within differential expression analysis using the same datasets.
Keywords: obstructed nephropathy, miRNA, mRNA, feature selection,
forward selection, k-nn classifier, classification tree
1 Introduction
Obstructive nephropathy (ON) is a renal disease caused by impaired flow of urine or tubular fluid [1] and is the most frequent nephropathy observed in newborns and children. The improper flow of urine may be caused by the presence of an obstacle on the urinary tract, e.g. stenosis or abnormal implantation of the ureter in the kidney, and the resulting accumulation of urine within the kidney can lead to progressive alterations of the renal parenchyma, development of renal fibrosis and loss of renal function. However, ON is treatable and often reversible [2]. Common met in infants
due to congenital abnormalities of the urinary tract, it represents 16.1% of all pediatric transplantations in North America [3].
In addition to the classical mechanical view of ON, there is evidence that the pathophysiological process of nephron destruction is magnified by cellular processes which can be classified into three broad categories: tubulointerstitial inflammation, tubular cell death and fibrosis [4-5]. The cellular interactions that regulate development of interstitial inflammation, tubular apoptosis and interstitial fibrosis are complex. Renal gene expression and protein production result to several biomarkers that include signaling molecules and receptors involved in macrophage recruitment and proliferation, tubular death signals and survival factors [6]. Given the afore described molecular aspect of ON pathology, it is important to advance its in depth knowledge using well established –omics profiling techniques combined with intelligent data mining methods that could identify the most important molecular actors in various levels, e.g. transcriptomics, proteomics and metabolomics .
Microarray experiments are one of the well knows examples of -omics profiling techniques that allow the systemic analysis and characterization of alterations in genes, RNA, proteins and metabolites, and offer the possibility of discovering novel biomarkers and pathways activated in disease or associated with disease conditions. In particular, they have become a major tool in medical knowledge discovery in order to: i) identify and categorize diagnostic or prognostic biomarkers ii) classify diseases iii) monitor the response to therapy, and iv) understand the mechanisms involved in the genesis of disease processes [7]. Microarray data pose a great challenge for computational techniques, because of their large dimensionality (up to several tens of thousands of genes) and their small sample sizes [8]. Furthermore, additional experimental complications like noise and variability make the analysis of microarray data an exciting domain that employs bioinformatics-driven methods to deal with these particular characteristics. These methods range from statistics or heuristics that identify differentially expressed genes between two different disease status to sophisticated data mining techniques that employ biologically inspired machine learning methodologies. In particular, the obvious need for dimension reduction was realized as early as the field of microarray analysis emerged [9-10] and the application of feature selection methodologies became a standard in the field [11].
In the current study, we employ a data mining framework towards the analysis of expression data related to ON that were derived through microarray techniques in two data levels: human miRNA and mice mRNA. Both available data sets are divided into subject groups based on ON severity. Data is analyzed within Rapidminer, a freely available open-source data mining platform that integrates fully the machine learning WEKA library, and permits easy data mining algorithms integration, process and usage of data and metadata [12-13]. Our final scope is to identify the most critical players in the two levels of molecular information. Towards this end, we apply a forward selection module with an embedded k-nearest neighbor (k-nn) classifier in order to select feature subsets of the greatest relevance, which are then tested for their generalization ability using other classifiers and the resampling technique of leave-one-out. Preliminary results here reported are further commented in relation to the ones obtained by applying statistical selection within the analysis of differential expression values in pairwise comparisons of disease status.
2 Dataset
The two –omics datasets analyzed within the current ON study correspond to i) human miRNA data and ii) mice mRNA data. Human miRNA dataset included children aged between two weeks and six months. Based on a set of clinical parameters, available samples belonged to three subsets 1) Control including children without any renal damage (8 subjects), 2) NoOp comprising children with mild obstruction who do not need to undergo surgery to repair the ureteropelvic junction (8 subjects), and 3) Op: children with severe obstruction who need surgery to repair and reconstruct the junction (10 subjects). The Agilent Human miRNA Microarray platform was used to measure expression values for a total number of 790 miRNAs. Three mice mRNA data groups were extracted after partial unilateral ureteral obstruction on neonatal mice in order to mimic the obstructive nephropathy syndrome as it occurs in children. These groups comprised non-operated Control mice (9 subjects), operated mice with Mild obstruction (5 subjects) and operated mice with Severe obstruction (4 subjects). Agilent's mice oligonucleotide microarrays were used to analyze the expression of about 41000 mouse transcripts, corresponding to 20873 genes. Prior to the analysis of both datasets within Rapidminer, expression values were normalized to (divided by) the average expression value in control subjects.
3 Methods
For both datasets, human miRNA and mouse mRNA, the same select and test protocol was followed in order to select the most important features (miRNAs and genes) and test their relevance to the classification of all subjects into corresponding ON related classes: Control, NoOp and Op for human miRNA, and Control, Mild and Severe for mouse genes. The protocol was implemented within the stand-alone Rapidminer platform [12-13] which includes in a single workflow all data mining steps (feature selection, classifier construction and evaluation) in appropriate operators (Fig. 1).
Forward Selection: This operator starts with an empty selection of features and, in
each round, adds each unused feature of the given set of examples. For each added feature, the performance is estimated using an embedded operator (Fig. 2), which measures on a 10-fold cross-validation basis the average accuracy that the feature yields using a 6-nn classifier. The k-nn classifier1 was used here due to the rather low
computational cost it raises, compared to other alternatives e.g. artificial neural network or support vector machine, and the need for executing and evaluating the classifier for a large number of rounds within forward selection. An additional speculative number of rounds equal to three was used to ensure that the stopping
1 A predifined number of nearest neighbors k=6 was set within forward selection. Other values for k, a classification tree module and a different validation technique (leave-one-out) were later used to evaluate the selected subsets of features.
criterion is fulfilled and that the algorithm does not get stuck in local optima. For both datasets, the maximum number of features was set to 30.
Classification: Following the forward selection, classification is performed to
construct classifiers fed by the selected features and measure their performance, thus validating the relevance of the selected features. Here, three nearest neighbor based classifiers (k=1,6,12) and a classification tree (the gini index was used a split criterion) were used, while their average performance was measured using the leave-
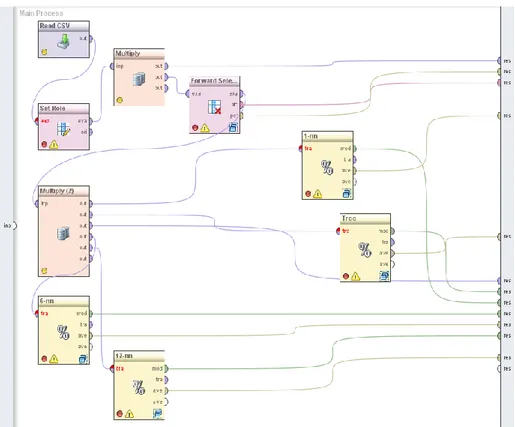
Fig. 1. The Rapidminer workflow: Read CSV operator reads the comma seperated value dataset
file that contains all subject examples: features – genes or miRNAs – and the class they belong to. Set Role operator defines the corresponding entry as the target class. Forward Selection operator contains a recursive validation operator that uses an embedded 6-nn classifier (Fig. 2) and 10-fold cross validation. This operator outputs an examples set containing the selected features and the target class, as well as the average accuracy achieved by the selected features subset and the 6-nn classifier. The modified examples set is forwarded to 1-nn, 6-nn, 12-nn and tree classifiers all evaluated using leave-one-resampling. The Multiply operator provides copies of an examples set to be used by other operators. Numerical results (e.g. accuracies, confusion matrices) and classification models themselves can be forwarded to results section, where can be studied/used asynchronously.
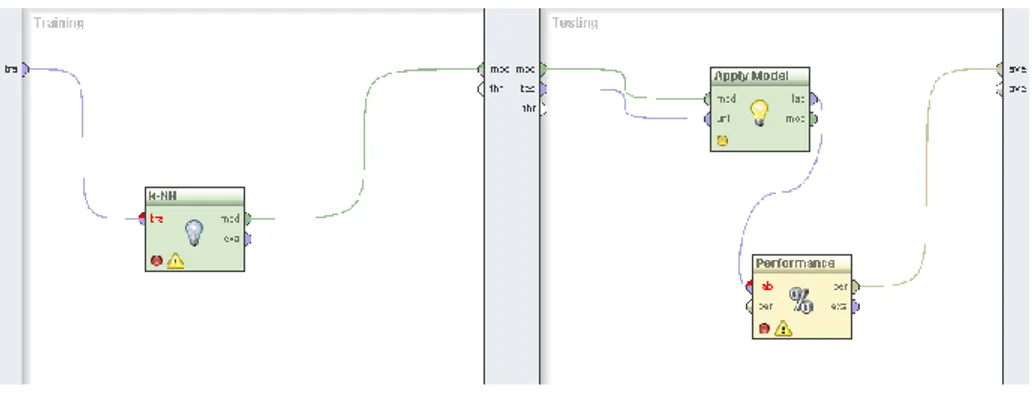
Fig. 2. The embedded training and testing process for a k-nn classification model in
Rapidminer workflow.
one-out resampling technique. It is important to note that applying and evaluating a classifier within Rapidminer is a rather simple procedure, given that the user has set the implementation details of the classifier (e.g. number of neighbor for a k-nn classifier), the validation procedure to apply, and the attribute of the examples set fed to the classifier that will be used as a target class.
4 Results and Discussion
Human miRNA dataset: Forward Selection provided 7 miRNAs that achieved high
accuracies both within selection process and, most importantly, when evaluated by the constructed classifiers using the leave-one-out strategy. These achieved average accuracies in the range 82%-93% (Table 1). Selected miRNA ids are presented along with p-values (t-test was applied), false discovery rates (FDR, Benjamini-Hochberg method was applied) and fold change natural values. All these values were obtained within a complementary analysis of miRNA dataset within ARMADA [14] towards the analysis of differential expression for two pairwise comparisons: Control vs. NoOp (Table 2) and Control vs. Op (Table 3). Tables 2 and 3 show that most of the miRNAs are found statistically significant (p<0.1) when differential expression is measured within one at least of the pairwise comparison. This supports their selection by the feature selection method applied here and imply that all may affect the disease outcome.
Mouse mRNA dataset: Forward Selection provided here three important features
corresponding to mouse genes that provided well performing classifiers either within the feature selection process or following this process (Table 4). Pairwise comparisons, Control vs. Mild and Control vs. Severe, support the selection of the
resulted genes which are presented with differential expression measurements (Tables 5,6) extracted similarly to miRNA data.
Given the small size of both datasets, a more detailed analysis on both levels of information comprises our future work aiming finally at providing molecular actors that could act as ON biomarkers. Such an analysis should be undertaken towards feature selection by sophisticated and computationally costly data mining methods, e.g. artificial neural networks and evolutionary methods, along with a thorough exploration of the differential expression of miRNAs and mRNAs. Furthermore, relating resulted molecular players between the two levels of information, e.g. identify important mRNAs regulated by homologous mice miRNAs to the ones
Table 1. Forward selection of human miRNAs: Mean accuracy obtained by the embedded 6-nn
classifier within forward selection (10-fold cross validation) and mean accuracies obtained when the selected subset is fed to 1-nn, 6-nn, 12-nn classifiers and classification tree (leave-one-out resampling).
Forward Selection
(embedded 6-nn) 1-nn 6-nn 12-nn tree
96.67% 82.14% 92.86% 78.57% 82.14%
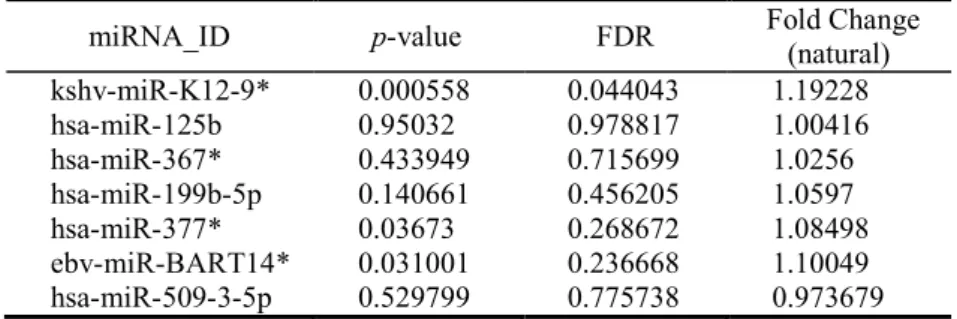
Table 2. miRNAs selected by forward feature selection: p-values, false discovery rates (FDR)
and fold changes (NoOp/Control) in natural values for the pairwise comparison Control versus NoOp are presented.
miRNA_ID p-value FDR Fold Change (natural)
kshv-miR-K12-9* 0.000558 0.044043 1.19228 hsa-miR-125b 0.95032 0.978817 1.00416 hsa-miR-367* 0.433949 0.715699 1.0256 hsa-miR-199b-5p 0.140661 0.456205 1.0597 hsa-miR-377* 0.03673 0.268672 1.08498 ebv-miR-BART14* 0.031001 0.236668 1.10049 hsa-miR-509-3-5p 0.529799 0.775738 0.973679
Table 3. miRNAs selected by forward feature selection: p-values, false discovery rates (FDR)
and fold changes (Op/Control) in natural values for the pairwise comparison Control versus Op are presented.
miRNA_ID p-value FDR Fold Change (natural)
kshv-miR-K12-9* 9.98E-05 0.024237 1.259912 hsa-miR-125b 0.030252 0.169496 0.847489 hsa-miR-367* 0.115856 0.347684 0.930161 hsa-miR-199b-5p 0.730141 0.868795 0.991497 hsa-miR-377* 0.550648 0.784874 1.023243 ebv-miR-BART14* 0.081845 0.297936 1.075465 hsa-miR-509-3-5p 0.007946 0.090974 1.123825
selected in humans, and exploiting established functional information on their role by controlled biological vocabularies (Gene Ontology Terms, KEGG Pathways) could further enlighten the molecular mechanisms beneath ON.
Table 4. Forward selection of mouse mRNAs: Mean accuracy obtained by the embedded 6-nn
classifier within forward selection (10-fold cross validation) and mean accuracies obtained when the selected subset is fed to 1-nn, 6-nn, 12-nn classifiers and classification tree (leave-one-out resampling).
Forward Selection
(embedded 6-nn) 1-nn 6-nn 12-nn tree
100% 100% 100% 55.56% 94.44%
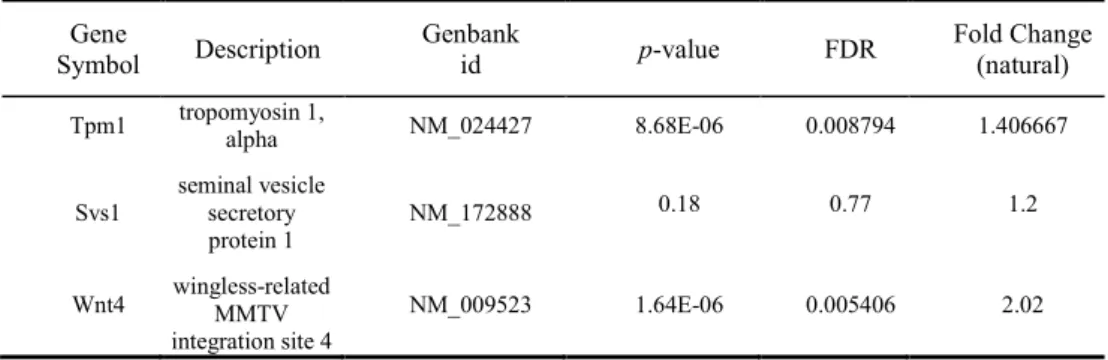
Table 5. mRNAs selected by forward feature selection (gene symbol, description and Genbank
id is presented for each mRNA): p-values, false discovery rates (FDR) and fold changes (Mild/Control) in natural values for the pairwise comparison Control versus Mild are presented. Gene Symbol Description Genbank id p-value FDR Fold Change (natural) Tpm1 tropomyosin 1, alpha NM_024427 0.002114 0.15 1.593333 Svs1 seminal vesicle secretory protein 1 NM_172888 0.06 0.53 0.77 Wnt4 wingless-related MMTV integration site 4 NM_009523 0.000338 0.09 1.42
Table 6. mRNAs selected by forward feature selection (gene symbol, description and Genbank
id is presented for each mRNA): p-values, false discovery rates (FDR) and fold changes (Severe/Control) in natural values for the pairwise comparison Control versus Severe are presented.
Gene
Symbol Description Genbank id p-value FDR Fold Change (natural)
Tpm1 tropomyosin 1, alpha NM_024427 8.68E-06 0.008794 1.406667
Svs1 seminal vesicle secretory protein 1 NM_172888 0.18 0.77 1.2 Wnt4 wingless-related MMTV integration site 4 NM_009523 1.64E-06 0.005406 2.02
4 Conclusions
In the current study, an intelligent workflow aiming to the analysis of two –omics datasets, i.e. human miRNA and mouse mRNA of samples classified by ON severity derived using clinical parameters, was presented. The forward feature selection, first step within the workflow, selected 7 miRNAs and 3 mRNAs found as the most relevant molecular players towards the classification of samples into the corresponding classes in the two levels of molecular information. Preliminary results showed that the selected features yielded high accuracy measurements when fed to k-nn and tree based classifiers within the next step of the workflow, thus comprising candidate ON biomarkers to be studied within future work.
References
1. Klahr, S.: The geriatric patient with obstructive uropathy. Geriatr. Nephrol. Urol. 9, 101--107 (1999).
2. Klahr, S.: Obstructed Nephropathy. Internal Medicine, 39(5), 355--361 (2000).
3. Bascands, J.L., Schanstra, J.P.: Obstructive nephropathy: Insights from genetically engineered animals. Kidney Int. 68, 925--937(2005).
4. Ucero, A.C., Concalvesm, S., Benito-Martin, A. et al.: Obstructive renal injury: from fluid mechanics to molecular cell biology. Open Access Journal of Urology. 2, 41--55 (2010). 5. Wen, J., Frøkiaer, J., Jørgensen, T., Djurhuus, J.: Obstructive nephropathy: an update of the
experimental research. Urol Res. 27(1), 29--39 (1999).
6. Chevalier, R.L.: Obstructive nephropathy: towards biomarker discovery and gene therapy. Nat. Clin. Pract. Nephrol. 2(3), 157--168 (2006).
7. Tarca, A.L., Romero, R., Draghici, S.: Analysis of microarray experiments of gene expression profiling. Am. J. Obstet. Gynecol. 195(2), 373--388 (2006).
8. Somorjai, R., et al.: Class prediction and discovery using gene microarray and proteomics mass spectroscopy data: curses, caveats, cautions. Bioinformatics. 19, 1484—1491(2003) 9. Alon, U. et al. :Broad patterns of gene expression revealed by clustering analysis of tumor
and normal colon tissues probed by oligonucleotide arrays. Proc. Nat. Acad. Sci. USA. 96, 6745--6750 (1999).
10.Ben-Dor, A. et al. :Tissue classification with gene expression profiles. J. Comput. Biol. 7, 559--584 (2000).
11.Saeys, Y., Inza, I., Larrañaga, P.: A review of feature selection techniques in bioinformatics. Bioinformatics. 23(19), 2507--2517 (2007).
12.Mierswa, I., Wurst, M., Klinkenberg, R., Scholz, M., Euler, T. :YALE: Rapid Prototyping for Complex Data Mining Tasks, in Proceedings of the 12th ACM SIGKDD International Conference on Knowledge Discovery and Data Mining (KDD-06) (2006).
13.http://rapid-i.com/
14.Chatziioannou, A., Moulos, P., Kolisis, F.N. :Gene ARMADA: an integrated multi-analysis platform for microarray data implemented in MATLAB. BMC Bioinformatics, 10:354 doi:10.1186/1471-2105-10-354 (2009).