HAL Id: hal-02947245
https://hal.inria.fr/hal-02947245
Submitted on 23 Sep 2020
HAL is a multi-disciplinary open access
archive for the deposit and dissemination of
sci-entific research documents, whether they are
pub-lished or not. The documents may come from
teaching and research institutions in France or
abroad, or from public or private research centers.
L’archive ouverte pluridisciplinaire HAL, est
destinée au dépôt et à la diffusion de documents
scientifiques de niveau recherche, publiés ou non,
émanant des établissements d’enseignement et de
recherche français ou étrangers, des laboratoires
publics ou privés.
Investigating Collaborative Exploration of Design
Alternatives on a Wall-Sized Display
Yujiro Okuya, Olivier Gladin, Nicolas Ladevèze, Cédric Fleury, Patrick
Bourdot
To cite this version:
Yujiro Okuya, Olivier Gladin, Nicolas Ladevèze, Cédric Fleury, Patrick Bourdot. Investigating
Col-laborative Exploration of Design Alternatives on a Wall-Sized Display.
CHI 2020 - ACM
Con-ference on Human Factors in Computing Systems, Apr 2020, Honolulu, United States. pp.1-12,
�10.1145/3313831.3376736�. �hal-02947245�
Investigating Collaborative Exploration of
Design Alternatives on a Wall-Sized Display
Yujiro Okuya
1,2Olivier Gladin
2Nicolas Ladevèze
1Cédric Fleury
2Patrick Bourdot
1 1Université Paris-Saclay, CNRS, LIMSI
VENISE team, F-91405 Orsay, France
2
Université Paris-Saclay, CNRS, Inria, LRI
F-91405 Orsay, France
[email protected], [email protected], [email protected], [email protected], [email protected]
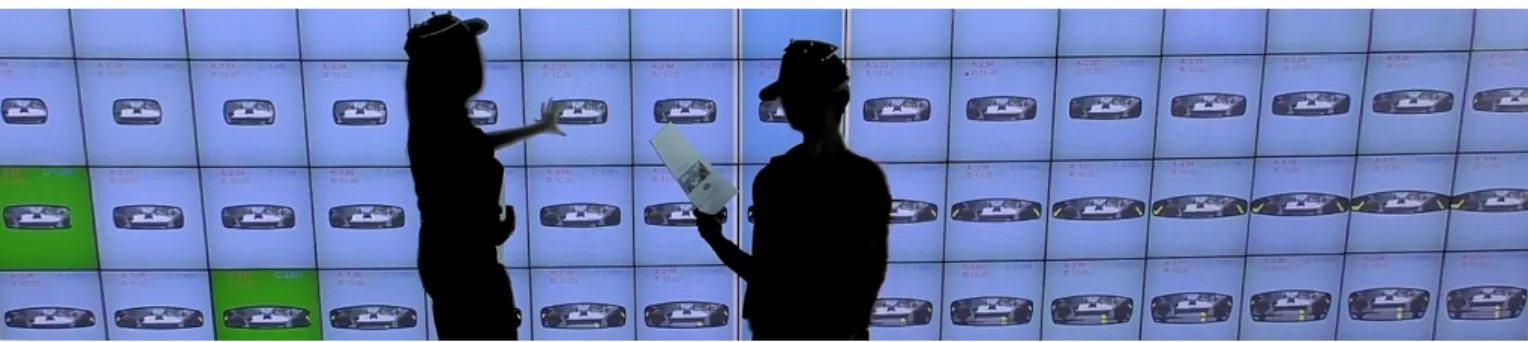
Figure 1. ShapeCompare enables non-CAD experts to generate and explore multiple design alternatives on a wall-sized display.
ABSTRACT
Industrial design review is an iterative process which mainly relies on two steps involving many stakeholders: design dis-cussion and CAD data adjustment. We investigate how a wall-sized display could be used to merge these two steps by allowing multidisciplinary collaborators to simultaneously generate and explore design alternatives. We designed Shape-Compare based on the feedback from a usability study. It enables multiple users to compute and distribute CAD data with touch interaction. To assess the benefit of the wall-sized display in such context, we ran a controlled experiment which aims to compare ShapeCompare with a visualization technique suitable for standard screens. The results show that pairs of par-ticipants performed a constraint solving task faster and used more deictic instructions with ShapeCompare. From these findings, we draw generic recommendations for collaborative exploration of alternatives.
Author Keywords
Computer-aided design; collaboration; wall-sized display.
CCS Concepts
•Human-centered computing → Graphical user inter-faces; Collaborative interaction;
Yujiro Okuya, Olivier Gladin, Nicolas Ladevèze, Cédric Fleury and Patrick Bourdot. Investigating Collaborative Exploration of Design Alternatives on a Wall-Sized Display. In Proceedings of the 2020 CHI Conference on Human Factors in Computing Systems (CHI 2020), ACM, April 2020. Paper 607.
©2020 Association for Computing Machinery. This is the author’s version of the work. It is posted here by permission of ACM for your personal use. Not for redistribution. The definitive version is published in CHI ’20, April 25–30, 2020, Honolulu, HI, USA.
ISBN 9781450367080
http://dx.doi.org/10.1145/3313831.3376736
INTRODUCTION
The industrial design increasingly relies on digital tools to review aesthetic properties, user satisfaction, and technical feasibility of products before building physical prototypes. Computer-aided design (CAD) is now an essential part of the design process. At specific stages of the process, multidisci-plinary teams (e.g. designers, engineers, ergonomists) evaluate and adjust product design using digital mock-ups [37]. These experts need a shared workspace to review design alternatives. With advances in technology, large displays and virtual reality systems are becoming useful in such context [10, 43, 7]. They offer opportunities to visualize digital mock-ups and foster collaboration. For example, automotive industries are now using CAVE systems or large screens to review virtual cars at full scale or in a realistic environment.
However, allowing all experts to modify CAD data in such interactive systems is challenging, as mastering CAD skills is complex, time-consuming and costly [9]. Consequently, the review process is often iterative. For example, we identified the following design practices by interviewing engineers at PSA Group1: engineers prepare design alternatives from CAD data based on expert recommendations; project members re-view prepared digital mock-ups within an interactive system; then, engineers apply post-modifications on the CAD data and prepare new alternatives based on annotations. As experts can-not directly reflect their ideas, miscommunication could occur resulting in unnecessary iterations and increased development time. A side-by-side setup of an interactive system and a CAD workstation [46] could reduce iterations, but still, only the engineers can apply the modifications.
1
French multinational automotive company gathering Peugeot, Cit-roën, DS, Opel and Vauxhall brands (https://www.groupe-psa.com).
The challenge addressed in the paper is to merge the design discussion and CAD data adjustment steps by providing a shared interactive workspace in which experts can explore sev-eral design alternatives. Wall-sized displays [6] are promising in such context because they offer new ways to collaborate and interact with large data sets. Previous work demonstrated their benefits over traditional desktop displays for a co-located collaboration, as several people can simultaneously interact with information [4, 24, 31].
In this paper, we investigate how wall-sized displays can im-prove the review process in industrial design. In particular, we design ShapeCompare which allows users to generate and distribute multiple alternatives of CAD data on a wall-sized display using touch interaction (Fig. 1). ShapeCompare is linked to a commercial CAD engine (Catia V5) and enables non-CAD experts to modify native CAD data by directly re-trieving multiple design alternatives from the CAD engine. Users are thus able to explicitly express their design ideas and compare the proposed alternatives. To assess the bene-fit of wall-sized displays for collaborative design tasks, we ran a controlled experiment which compared ShapeCompare with a visualization technique suitable for standard screens. It evaluates whether comparing many design alternatives on a wall-sized display is more beneficial than exploring them one by one, as it can be done on a standard screen.
The main contributions of this paper include: i) a system that enables non-CAD experts to modify native CAD data by generating multiple design alternatives and distributing them on a wall-sized display; ii) a controlled experiment which shows that wall-sized displays can improve collaboration for design alternative exploration; iii) design recommendations which generalize the use of a wall-sized display to other types of alternative exploration in various contexts.
Section 2 examines related work. Section 3 describes the de-sign of ShapeCompare based on the feedback from a usability study. Section 4 details the system implementation. Section 5 reports the controlled experiment. Section 6 discusses the results and section 7 presents the design recommendations. Section 8 concludes by highlighting future work.
RELATED WORK
The challenge addressed in this paper is to create a shared interactive workspace where non-CAD experts could gener-ate multiple design alternatives and collaboratively explore them. We first review techniques to modify CAD data for non-experts. We then present the use of large interactive plat-forms in industrial design. Finally, we examine how wall-sized displays foster collaboration on complex data sets.
Design for Non-CAD Experts
Many interaction techniques were proposed to facilitate draw-ing and sketchdraw-ing at early stages of the design, such as im-mersive drawing [23, 45], surface modeling [17], digital tape-drawing [2, 20, 18, 25] and rapid prototyping with bimanual interaction [1]. However, much fewer studies target detailed design stages where modification of parametric CAD mod-els is mandatory. A CAD model is a solid model defined by a set of mathematical operations (e.g. extrusion, boolean
operations) applied on 2D sketches. Unlike drawing or sur-face modeling, users need to interact with parameters which requires extensive training. Consequently, modifications of native CAD data is cumbersome for non-CAD experts. Martin et al. [36] presented a data pipeline which allows CAD data modification from a virtual reality platform. Based on this work, Okuya et al. [39] proposed a shape-based interaction, which enables non-CAD experts to modify parameter values of CAD models by simply pushing and pulling their 3D shape. Coffey et al. [13] proposed to browse pre-computed design of a medical device by dragging its surface on a tablet.
Although some solutions enable non-experts to modify CAD data, they are limited to a single CAD model and none of them supports the generation of multiple design alternatives.
Design Reviews in Interactive Platforms
Collaborative reviews is a critical part of the industrial design process. Such meetings are often conducted on interactive platforms, such as large screens or virtual reality systems. They offer a full-scale design visualization, a large interactive space, and a collaborative environment. For example, “the ability to display and interact with large-scale representations of vehicles has always been a fundamental requirement” [10] in the automotive industry. Portfolio Wall [10] displayed multiple different designs as tiled thumbnails on the screen. It was designed to compare various concepts, like a traditional wall-mounted corkboard. Khan et al. [26] also studied a tool that highlights the area of the user attention on a projected display to facilitate group meetings.
Previous works explored 3D visualization to reduce time and costs for manufacturing physical mock-ups in product develop-ment process [29, 49]. While many virtual reality systems can display CAD data [7, 42, 43, 27, 46], only a few can modify native data from commercial CAD systems [36, 39]. Other works addressed remote collaboration: vehicle design reviews between remote CAVE [30], collaborative material/texture editions [11], or object manipulations [35].
While these systems provide a 3D visualization and multi-user context to facilitate discussions, only a few static design alternatives can be compared during each review meetings. Generating and modifying new design alternatives of CAD data is currently not possible.
Wall-sized Displays
The benefits of wall-sized displays have been demonstrated on various tasks. Ball et al. [4] showed that users’ physical navigation induced by a large display improves performance on navigation, search and pattern finding. Ball and North found that peripheral vision offered by wall-sized displays contributed to task performance [3]. The large amount of data displayed improves task efficiency and accuracy [48]. Larger screens provide better performance on complex and cognitively loaded tasks [15, 33], and enhance peripheral ap-plication awareness [8] compared to workstations.
Wall-sized displays also enhance collaboration among co-located users. Previous studies investigated how user interac-tion affected collaborainterac-tion [28, 16] for data analysis tasks. Liu
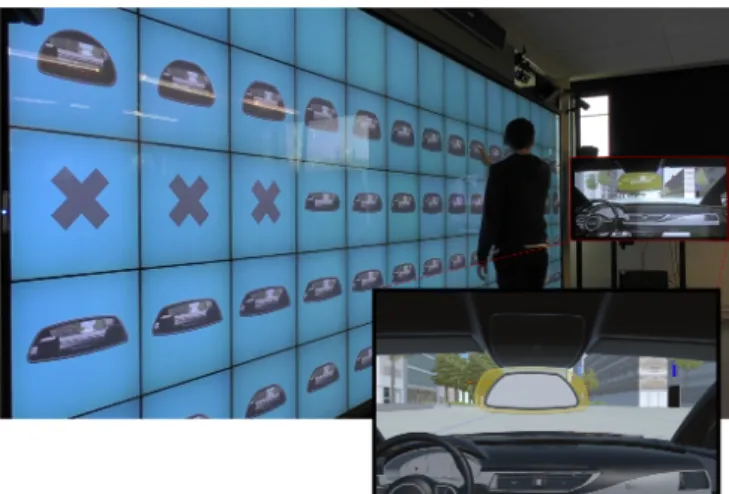
Figure 2. Interaction with ShapeCompare: when a part is selected (Selection), the system generates a set of design alternatives on a row of the wall-sized display (Display). All alternatives can be scrolled up and down with a three-finger drag (Slide shapes), rotated in 3D with a widget (Rotation), and displayed on the external screen with a two finger long press (Update 2nd screen).
et al. [31] compared various collaboration strategies on a wall-sized display. They also showed that cooperative interaction improves close and loose collaboration[32].
Since wall-sized displays are powerful tools for displaying and interacting with large data sets, they can allow to visualize mul-tiple alternatives by creating “small mulmul-tiple” representations of an object. For example, Beaudouin-Lafon [5] proposed to distribute a large number of brain scans on the screen. This enables neuroscientists to compare and classify this brain scan according to specific brain fold patterns. For industrial design reviews, the “small multiple” approach can be valuable for exploring and comparing design alternatives.
Summary and Approach
While some previous work explored CAD data modification for non-experts, they focused on the deformation of one par-ticular CAD model and did not consider the generation of multiple design alternatives. Other works investigated reviews of static design alternatives, but they did not allow users to modify these alternatives or to generate new ones. As Wall-sized displays are efficient to show multiple variations of a same object and to foster collaboration, they could be an ideal tool for design discussions where a multidisciplinary team can review, compare, and also generate design alternatives without using a conventional CAD system.
DESIGN OF SHAPECOMPARE
To assess the benefit of a wall-sized display for collaborative exploration of design alternatives, we first need to design a system allowing non-CAD experts to modify native CAD data and distribute alternatives on the screen. We created ShapeCompareby using an iterative design process involving potential users. The prototypes and the usability study used during this process are described in this section.
First Prototype
The first prototype was designed to meet three criteria: i) in-teraction in a large space, ii) native CAD data modification and iii) multiple-design comparison. Based on previous work on CAD data modification [39, 40], we implemented a ser-vice which generates multiple alternative shapes by varying parameter values of a native CAD model.
User Interaction
Various interaction techniques have been studied on a Wall-sized display [19, 47, 38]. However, as the interaction tech-nique in itself is not the main focus of the paper, we decided to simply use direct touch to interact with the CAD data dis-played on the wall-sized display.
Shape Generation
To generate new design alternatives, users touch the part to modify on one of the displayed shapes (Fig. 2). If the part can be modified, it turns green. Each part is tied to an internal parameter defined in the native CAD data. The system then prepares a set of parameter values for the selected part and asks for the corresponding shapes. In this first prototype, we defined a minimum and maximum parameter value for each part, and chose a pre-defined number of values equally dis-tributed in the range. As CAD models are defined by multiple geometric constraints, the CAD engine cannot always perform the modification for the full range of values. If a shape is not successfully generated, a “cross” is displayed to inform users of the failure.
Shape Visualization
The set of newly generated shapes is displayed on a full row of the screen, above previous versions of the CAD model. In this manner, each row represents a set of design alternatives for a specific part of the CAD model.
Design History
Users thus accumulate design history below the current design alternatives, and can navigate with a three-finger interaction to scroll up or down the design alternatives (Fig. 2). Users can select a part of any shape in the design history and start over modification from this shape.
3D Rotation
To interact with 3D objects, we implemented the In(SITE) technique [34]. It allows to perform 3D rotation on a wall-sized display with bimanual touch interaction (Fig. 2). The rotation of displayed alternatives is synchronized to maintain a similar view angle for all of them.
Usability Study
To assess the usability of the interaction technique proposed in the first prototype, we invited potential users to test it and observed their behaviors while achieving an individual CAD
Figure 3. Sketch of the rear-view mirror designed using CATIA V5. Green line is a guide curve of a sweep operation generating the 3D shape. Constraints and parameter values are highlighted in blue: for example, the red parameter defines the width of the rear-view mirror (110 mm).
modification task. After the task, we had short individual debriefings and a brainstorming session with all of them.
Participants
The 5 participants (1 female), aged 21 to 24 (mean 22.8), are students at the civil engineering department. 4 rated their expertise level of CAD system as 2 out of 5, and 1 rated as 1 (1: Never used before - 5: Use almost every day). All students have experience in AutoCAD to read construction plans and design. Although they are not CAD experts, they provided us relevant feedback as they are knowledgeable about parametric modeling and design process.
Task
We asked each participant to modify a CAD object with Shape-Compareto reach a given target shape within a time limit of 5 minutes. The CAD object is a rear-view mirror (Fig. 3) designed by an industrial designer at PSA Group. An external screen next to the wall-sized display was used to display a design alternative of the mirror within an automotive cock-pit. Participants could display a particular alternative on this external screen by selecting it on the wall-sized display with a two finger long press. The target shape was shown with a transparent yellow color overlaying the design alternative on the external screen (Fig. 4). This simulated the fact that partic-ipants have design skills to evaluate the design alternatives in a realistic environment.
To investigate if the interaction technique used for CAD mod-ification was straightforward, we did not provide any CAD parameter-related information to the participants. We just ex-plained to them that the mirror is a parametric CAD model designed with a commercial CAD system, and what are the actions to modify it.
Results
Based on the interviews and observations of participant behav-iors, we extracted the main issues they encountered. First, all participants mentioned that it was difficult and frustrating to figure out how the part selection affects the shape deformation.
Figure 4. Usability study setup: the target shape is displayed with a transparent yellow color in a realistic environment on an external screen next to the wall-sized display.
P2 explained, “I didn’t know the link between the parameter map and shapes. Without this information, I was afraid to modify the shape wrongly”. Most participants expected that each “length” of the selected part would change. For example, P3 said, “I was surprised when I selected the right side. I expected that it would get higher but it got wider instead. I had to adjust my mind after each system response”. The links between parts and parameters are defined by the CAD data, and each parameter is mapped to the part that constraints the parameter. For example, when the right-side part is selected, it changes the parameter that constraints the width (Fig. 3). Second, all participants often needed time to find out how the generated shapes on the new row are different from the one they selected. P3 detailed, “I expected that the same shape will appear just above the selected shape, but it didn’t. I was surprised of this behavior. I had to make a step behind to look for the exact same shape” in the new row. In fact, as the param-eter values used for generating shapes are always distributed between a static minimum and maximum, the initial shape in the range of variations is not displayed above the previously selected shape, but at a random position.
Aside from these critical issues, participants often had diffi-culties to find the difference also between neighbor shapes, especially on radii of corners, top and bottom parts. Some of them claimed that the difference of 4 shapes on a row was not noticeable. They needed to step back from the screen and check the smallest and the largest shapes (leftmost and rightmost ones) to grasp the global difference of the shapes on the row. P2 commented, “I was looking at the first and the last shapes of the list to understand the modification. Then looked in the middle to find the one I want”.
Despite the above issues, we had positive reactions of all par-ticipants. They liked the simple interaction which does not require to understand and manipulate parameter values. In particular, they found it useful for novices: “I found that it is very difficult in AutoCAD to find parameter values, remem-ber the parameter information and how it affects the shape
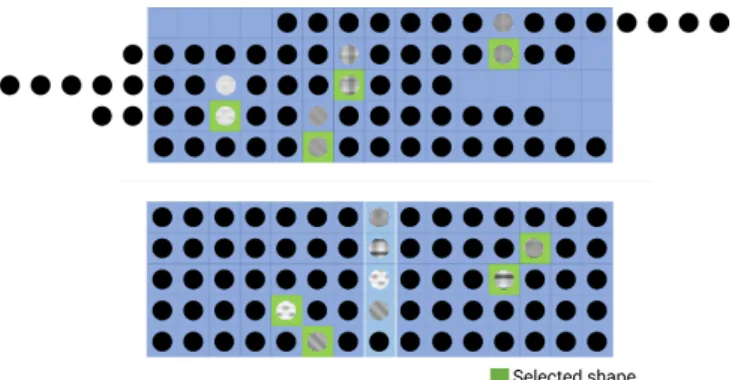
Figure 5. Two solutions for visualizing the design history.
modification, but this app made it much easier” (P5). They also appreciated the proposed shape visualization: “Seeing many different designs on the wall-sized display, comparing them, and visualizing them within the realistic context was nice to generate new ideas” (P1). As common ground, all of them agreed that ShapeCompare cannot be a substitute for traditional CAD software due to the limited functionalities, but it is valuable for a design adjustment task which does not require to change the whole design intent.
Updated Prototype
Based on the usability study results, we identified two main issues in the first prototype with respect to: (i) Understanding of shape modificationand (ii) Visualization of design history. We addressed these issues as described in the following.
Understanding of Shape Modification
To solve this issue, we drew inspiration from the Suggestive Interfaceproposed by Igarashi [22]. This interface offers small thumbnails presenting results of geometric operations and encourages novice users to explore a new system and find unknown operations. We decided to compute and displayed a preview of the minimum and maximum shape modification for each part. As participants often checked the smallest and the largest shapes to understand the current modification during the usability study, these extreme shapes would have a similar effect and give a hint to the users before selecting the modifi-cation. In the updated prototype, when users select a shape, a selection widgetappears and displays thumbnails of the two extreme shape modifications for all parameters of each part. (Fig. 6, (2)). Users can then select a thumbnail to generate the corresponding design alternatives. They no longer have to touch the parts directly, which prevents touch problems.
Visualization of Design History
To improve the shape visualization, we changed how the sys-tem generates design alternatives to ensure that we have the same number of design alternatives with lower and higher parameter values compared to the selected one. Instead of defining a static minimum and maximum for the parameter values, we defined a specific offset for each part. The system thus generates half of shapes with lower parameter values by incrementally decreasing by the offset the parameter of the selected shape, and conversely for the other half with higher parameter values. Consequently, the selected shape always
appears in the middle of the alternative range, and not at a random position as in the first prototype. We then explored solutions to display each row of new design alternatives. We first showed the similar shape just above the selected one (Fig. 5, top) in order to meet the expectation of the participant of the usability study. However, it creates unused screen space and requires an additional interaction for horizontal panning. For these reasons, we shifted the new alternatives to the center of the screen to always fit them in. This solution displays all the selected shapes always in the central column (Fig. 5, bot-tom), which is beneficial for keeping track of the modification history. We highlighted the selected shapes with a green color and the central column with a different saturation.
SYSTEM IMPLEMENTATION
The front-end application of ShapeCompare communicates with a back-end server (CAD Server) linked to a CAD en-gine which computes tessellated meshes of design alternatives. Both components are located in remote locations on our cam-pus and are connected by a distributed architecture [40].
Wall-Sized Display
The wall-sized display consists of a 15×5 grid of 21.6” LCD screens. It measures 5.9×2m for a resolution of 14.400×4.800 pixels. It is controlled by a cluster of 10 PCs running Linux, each managing a row of 7 or 8 screens. Touch interaction is detected by a PQLABs2infrared frame surrounding the wall-sized display. A VICON3infrared tracking system tracks users’ head positions and orientations.
CAD Server
To load and modify native CAD source files, we implement a CAD Server based on the work of Okuya et al. [39]. The CAD Serveris a custom C++ application using the CAA API of CATIA V54. It can load original CAD files, update the Constructive History Graph (CHG) and the Boundary Repre-sentation (B-Rep) when receiving modification requests, and send back the tessellated meshes. The main concept of the CAD Serveris labeling [14], a direct linkage from 3D meshes to B-Rep elements and CHG nodes of the CAD object. With this linkage, users can access to the parameter values of the CHG node by selecting a relevant mesh displayed on a user interface. Once selected, the front-end application transmits the B-Rep ID, constraint ID and the new parameter value to the CAD Server to request a modified shape.
Software
The user interface on the wall-sized display is implemented with Unity5. Unity manages the clustered rendering. The master node of the cluster handles communication, receives and stores 3D meshes in a local cache.
2 https://www.pqlabs.com/ 3 http://www.vicon.com/ 4 https://www.3ds.com/products-services/catia/ 5 http://unity3d.com/
Figure 6. Interaction in experimental conditions: after the shape selection (1), a widget helps users to select a part by displaying the two extreme shape modifications (2). Then users can explore design alternatives using ShapeCompare or ShapeSlide.
EXPERIMENT
We conducted a controlled experiment to assess the benefit of a wall-sized display in the context of collaborative design re-views. In particular, we investigated how simultaneous visual-ization of multiple design alternatives affects the collaboration between participants. We compared ShapeCompare to another technique called ShapeSlide, which displays only one shape at a time (Fig. 6). With ShapeSlide, users can change the shape displayed at the center of the wall-sized display with a sliding gesture on the screen.
Although ShapeSlide is suitable for a standard screen, we im-plemented it on the wall-sized display to avoid bias which could be introduced by the devices, user positions, or inter-action techniques. Consequently, we used the same device (i.e. the wall-sized display) for both conditions. Only a small portion of the wall-sized display was used for ShapeSlide, simulating the use of a smaller screen. This reduces bias that could be introduced by different devices or standing-sitting po-sitions. It also simplifies the experiment since participants did not have to change devices. In addition, we decided to use the exact same widget and interaction technique for selecting the part to modify on the CAD model for both conditions. (Fig. 6). Only the way to browse the generated design alternatives dif-fers in the two conditions: users had to walk in front of the wall-sized display with ShapeCompare, while they had to use a sliding gesture with ShapeSlide. Finally, to fairly compare the conditions, we provided the same functionalities in both cases. In particular, we imitated the design history of Shape-Compareby implementing an “Undo” button in ShapeSlide, which allows users to go back to the set of design alternatives that were previously generated.
Task
We designed the experimental task based on actual industrial practices collected through interviews with engineers at PSA Group. The task was to modify a car rear-view mirror and simulate expert negotiation on several design criteria. Since it was difficult to find and invite real experts involved in an actual industrial design process, we controlled users’ expertise by giving individual design criteria to pairs of participants. We simulated two distinct expert: Specialist 1 who focuses on general shape properties of the mirror, and Specialist 2 who focuses on reflections from the mirror face.
Specialist 1had to consider two criteria (Fig. 7):
● Aspect ratio (A) is the balance between the height H and the width W of the mirror such as A= H/W.
● Asymmetric balance (B) is the balance between either left-and-right (BLR) or top-and-bottom (BT B). One of the two asymmetric balances was chosen for the tasks. In both cases, the asymmetric balance was defined from the four corner radii: left-top (LTR), left-bottom (LBR), right-top (RTR) and right-bottom (RBR).
BLR= ∣LTR−RTR∣+∣LBR−RBR∣ (1) BT B= ∣LTR−LBR∣+∣RTR−RBR∣ (2) Specialist 2had to consider two criteria (Fig. 7):
● Rear visibility: participants had to follow a given guideline that specifies which objects should or should not be visible in the reflective part of the mirror.
● Surface size (C) is the geometric area of the reflective sur-face of the mirror (computed in cm2).
These criteria are good representatives of design challenges for each role. The Aspect ratio and the Asymmetric balance represent criteria used by designers to influence the overall appearance, whereas the Rear visibility and the Surface size are important factors for ergonomists to assess user experience. For A, B and C, participants had to reach a value within a given
Figure 7. (Left) design criteria of Specialist 1 and Specialist 2. (Right) design criteria values displayed next the mirror.
range. To help them, the current value of each criterion was displayed with different colors next to each design alternative: red for A, yellow for B and blue for C (Fig. 7).
To ensure a proper counterbalancing and avoid bias, we de-signed two tasks which resulted in different mirror shapes (Small and Large). We verified through pilot tests that they had similar difficulty and contradictory criteria which require pairs to find a trade-off. The criterion values are A: 2.0−2.3, B: > 50 (top-and-bottom), C: 110 − 140 for Small, and A: 3.1−3.5, B: > 55 (left-and-right), C: 200−230 for Large. Once Participants agreed on a design, they saved it with a double tap gesture. They were instructed to finish the task as quickly as possible. We encouraged pairs to communicate together, but strongly forbade them to tell their own design criteria. For example, Specialist 1 was not allowed to say “As-pect ratio” or “Asymmetric balance” to express requirements. Instead, they could use shape-related vocabularies, e.g. “I want to make the mirror higher/wider/smaller/curvier/etc.”.
Hypotheses
We formulate hypotheses based on the usability study and previous work about collaboration on wall-sized displays: ● H1: participants find the right design faster with
Shape-Comparethan with ShapeSlide;
● H2: participants find the right design with fewer iterations with ShapeCompare than ShapeSlide;
● H3: participants prefer ShapeCompare for communicating with their partner;
● H4: overall, participants prefer ShapeCompare to achieve the task.
Method
The experiment is a [2×2] within-participant design with the following factors:
● VISUALIZATIONwith the two techniques: ShapeCompare and ShapeSlide;
● TASKwith two set of design criteria resulting in different target shapes: Small and Large.
We first counterbalanced the order of the two VISUALIZA -TION conditions among pairs, then for each condition, we switched the TASK. To allow all participants to do the two TASKs with both VISUALIZATIONconditions, but to avoid them remembering the task, we ran the experiment in two sessions separated from two to three weeks. For example, if participants did Small with ShapeCompare and Large with ShapeSlidein the 1st session, they did Small with ShapeSlide and Large with ShapeCompare in the 2nd session. Participant roles remained constant across the two sessions.
Participants
We recruited 24 participants, aged 20 to 32 (mean 25.4), with normal or corrected-to-normal vision. Pairs were formed at the time of recruitment leading to 6 male-male, 4 female-male and 2 female-female. 6 participants had previous experience
with AutoCAD, 4 with SolidWorks, 2 with CATIA, 3 with other CAD systems, and 9 had with no experience.
Procedure
For each session, participants received written instructions. They filled out demographic questionnaires. They sat in dis-tant places in a room and received design criteria for Specialist 1or Specialist 2. They could ask questions to the instructor without being heard by the partner. At the beginning of the experiment, each participant had a dedicated training to un-derstand the given design criteria. For example, the instructor asked Specialist 1 to modify the mirror and reach a specific Aspect ratiowith two different sizes. During this training, the partner waited in a different room. For each VISUALIZATION condition, pairs also performed a common training to learn the interaction, followed by a measured trial. They filled out a questionnaire after each trial.
Data Collection
We registered 48 trials: 2 VISUALIZATION×2 TASK×12 pairs. We logged the task completion time (TCT) and the number of selections (Selections). For TCT, the instructor gave the starting signal and measurement stopped when pairs agreed on a design or after 30 minutes. Selections correspond to the num-ber of iterations performed by the participants during the task. We recorded video. The questionnaire was based on the NASA TLX [21] with additional questions about communication with partner and overall preferences.
Data Analysis
We analyzed the video recording to investigate communica-tion and the use of speech and gestures. We first transcribed participants’ discussions. Based on the transcripts, we ignored the utterances which were not relevant to the task and grouped their design-related conversation into 5 categories:
● Deictic instructions: participants used deictic gestures to show something on the screen to the partner. This category has two subgroups:
– Deictic-specific: participants indicated a specific shape (e.g. "I want to modify the mirror like this"). Most of the time, they used a pointing gesture.
– Deictic-range: participants indicated a range of shapes (e.g. "...from this shape to this one, it is OK"). ● Design expression: participants expressed ideas either
ver-bally or with gestures (excluding deictic gestures). This category has two subgroups:
– Expression-verbal: participants used shape-related vo-cabularies (e.g. "...wider, more curved, etc.").
– Expression-gesture: participants described the desired shape with hand or finger motions.
● Magnitude: participants quantified the size of the modifica-tion they wanted (e.g. "much more..." or "a bit less...").
* 0 2 4 6 8 10 ShapeCompare ShapeSlide Mean TCT (min) * 0 2 4 6 8 10 Large Small Mean TCT (min)
Figure 8. Mean TCT by VISUALIZATION(left) and by TASK(right). Error bars show 95% confidence intervals (CI).
0 2 4 6 8 10 ShapeCompare ShapeSlide M ea n se le ct io n co un ts p er t ri al * 0 2 4 6 8 10 Large Small M ea n se le ct io n co un ts p er t ri al
Figure 9. Mean Selections by VISUALIZATION(left) and by TASK(right). Error bars show 95% CI.
RESULTS
Task Completion Time (TCT)
We tested TCT for normality on the whole data set using a Shapiro-Wilk W test and found that it was not normally dis-tributed6. We tested for goodness-of-fit with a log-normal distribution using Kolmogorov’s D-test, which showed a non-significant result. Therefore, we ran the analysis using the log-transform of TCT, as recommended by Robertson & Kaptein [44](p. 316). We did not find any significant learning effects due to technique presentation order.
A repeated measures ANOVA on TCT with the model VI -SUALIZATION×TASKrevealed significant effects on VISU -ALIZATION(F1,47= 4.83, p = 0.033) and TASK(F1,47= 4.66, p= 0.036) but no significant interaction effect. Pairs achieved the task faster with ShapeCompare (6.04±1.76 min) than with ShapeSlide(7.83±1.59 min) (Fig. 8, left). Large (5.95±1.49 min) was faster than Small (7.91±1.91 min) (Fig. 8, right).
Number of Selections
In conformity with count data, Selections did not follow nor-mal or log-nornor-mal distribution. Consequently, we computed the mean Selections of each participant by levels for each fac-tor and we used non-parametric tests. For VISUALIZATION, a Wilcoxon Signed Rank test did not reveal any significant dif-ferences (p =0.78)(Fig. 9, left). For TASK, a Wilcoxon Signed Rank test showed (p =0.009) that Large (6.13±1.66) led to fewer Selections than Small (8.19±1.66) (Fig. 9, right).
6
All analyses were performed with R and we used a significance level of α = 0.05 for all statistical tests.
0 25 50 75 100 ShapeCompare ShapeSlide Pr
oportion of each conversion type
Magnitude Expression−Gesture Expression−Verbal Deictic−Range Deictic−Specific
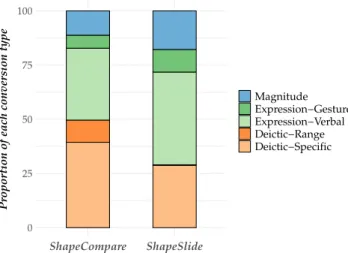
Figure 10. Tagged expression proportions by VISUALIZATION
Conversation Analysis
We analyze the communications between participants during the design exploration tasks. 2591 sentences were tagged for all trials (Fig. 10). We did not find difference in the to-tal number of sentences between ShapeCompare (1343) and ShapeSlide(1248). The participants used more Deictic in-structionswith ShapeCompare (39.4% for Deictic-Specific, 10.22% for Deictic-Range) than with ShapeSlide (28.77% for Deictic-Specific, 0.27% for Deictic-Range). On the con-trary, they used less Shape-related expression and Magni-tude with ShapeCompare (33.17% for Expression-Verbal, 5.99% for Expression-Gesture and 11.22% for Magnitude) than with ShapeSlide (42.74% for Expression-Verbal, 10.42% for Expression-Gesture and 17.8% for Magnitude).
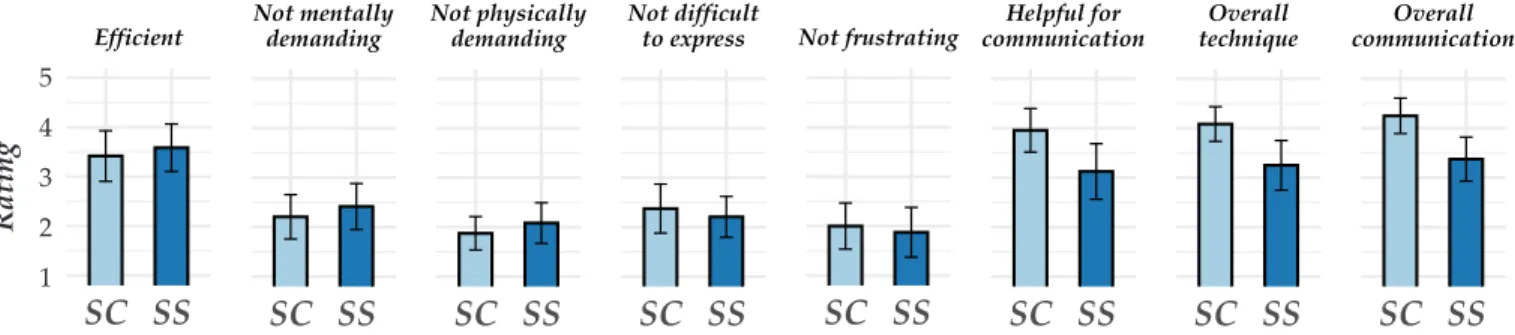
Qualitative Feedback
In questionnaires, participants graded each VISUALIZATION on a 5-point Likert scale. To avoid confusion, we phrased the questions so that they always had to give a high grade if they appreciated the condition. We asked them if they found the condition efficient, not mentally demanding, not physically demanding, not difficult to use, not frustrating and helpful for communication(1: strongly disagree, 5: strongly agree). They also gave an overall evaluation (1: bad, 5: good) for the technique itself and the communication with their partner. We computed the mean grades of each participant and used a non-parametric Wilcoxon Signed Rank test (Fig. 11). ShapeComparewas perceived more helpful for communica-tion (avg. 3.96 vs. 3.13,p =0.00014) and preferred in general (avg. 4.08 vs. 3.25,p =0.014) and for the communication (avg. 4.25 vs. 3.375,p =0.004) in comparison to ShapeSlide. We did not find significant differences for the other criteria.
DISCUSSION
ShapeCompareis linked to a CAD Server which enables non-CAD experts to easily generate multiple design alternatives of native CAD data. Unlike the conventional design process, all project members can participate in design adjustment tasks. This new capability is complex to evaluate since no compa-rable systems exist. However, we can draw inspiration from
SC SS
EfficientSC SS
Not mentally demandingSC SS
Not physically demandingSC SS
Not difficult to expressSC SS
Not frustratingSC SS
Helpful for communicationSC SS
Overall techniqueSC SS
Overall communication R a tin g 1 2 3 4 5Figure 11. Ratings in questionnaires (5 is best, 1 is worst). SC=ShapeCompare and SS=ShapeSlide. Error bars show 95% CI.
some evaluation criteria proposed by Olsen [41] to verify the contribution of our system: "Expressive Match"—users can interact with the final shapes of the CAD object instead of a 2D sketch and a parameter tree as in a CAD software, and "Empowers new design participants"—non-CAD experts can achieve design adjustments which are currently done by CAD engineers in the industrial design process.
ShapeComparealso takes advantage of a wall-sized display to distribute design alternatives across the screen space. To assess the benefit of this visualization technique for collabora-tive design tasks, we examine the results from the controlled experiment with respect to initial hypotheses. While the num-ber of Selections (i.e. iterations) was not significantly different with the two VISUALIZATIONconditions, participants found the right design significantly faster with ShapeCompare than with ShapeSlide. This supports H1, but not H2. The results from the questionnaires show that ShapeCompare was per-ceived more helpful for communicating with the partner than ShapeSlide, and ShapeCompare was generally preferred. This supports H3 and H4.
The smaller TCT and better communication with Shape-Comparecould be explained by the large number of Deictic instructions used by participants. During the task, the multiple alternatives of ShapeCompare were often used as references for communication: participants used the displayed shapes to convey their design idea (e.g. “I want a mirror like this”), to show limitations (e.g. “only shapes between this and this one”) or to ask for partner opinion (e.g. “what do you think about this one?”). Whereas with ShapeSlide, they needed to describe their requirements verbally or with their hand gestures. The words related to Magnitude were also more used with ShapeS-lidewhen they instructed their partner acting on a modification (e.g. "Can you increase it more?"). According to Clark [12], the multiple alternatives of ShapeCompare create a common ground between pairs and minimize the communication costs, which can explain the smaller TCT.
The same iteration numbers in both VISUALIZATIONcould be due to the task design and the fact that these iterations may be necessary to reach the right design. In addition, we made two different sets of design criteria (Small and Large). Even if we tried to make these criteria as equivalent as possible, it seems that LARGEwas easier than SMALL.
We were concerned that displaying lots of alternatives with ShapeComparecould increase the cognitive load. However,
we did not find significant difference in the NASA TLX, which suggests ShapeCompare do not overload participants. Although most participants preferred ShapeCompare for the ease of communication, some others prefer ShapeSlide in terms of interaction: e.g. “ShapeSlide is interesting because it allows to have instant feedback and to cycle through all possible design while swiping”. It seems that these users prefer to have more initiatives on the design activity, instead of dealing with solutions given by the system. ShapeCompare is a first prototype, but additional functionalities would be required to allow the user to feel more in control of the alternative generation. In particular, it would be important that users can define the minimum, maximum and step size of the generated alternatives. This would allow them to achieve fine or coarse modifications. Moreover, with the current implementation, the generation of new alternatives can take up to 5 seconds. A solution to improve this could be to use several CAD servers to parallelize the computation of 3D meshes.
Finally, we believe that our system can be extended to any CAD objects as long as they require collaboration among multidisciplinary experts. For large objects, the number of displayed alternatives or the scaling could be adjusted.
DESIGN RECOMMENDATIONS
While we studied alternative exploration in a specific context, the approach of visualizing “small multiples” on a wall-sized display could be extended to other contexts as soon as parame-ter variations are involved. For example, it can be suitable for generative designin which users can specify preferred designs to the AI, or physical simulations such as weather predictions in which users can run several simulations with different pa-rameter variations. Based on the observations of the usability study and the results of the controlled experiment, we draw some generic recommendations which can be applied to other contexts:
● A large number of alternatives can be displayed on the wall-sized display without overloading the users.
● Allowing users to generate/compare alternatives can help them to solve constraints and reach a trade-off.
● Users need to understand the effect of all possible mod-ifications before generating new alternatives to facilitate exploration. One option could be to display previews of the most extreme modifications.
● Users need to keep track of the design history and the link between each alternative selection to understand the design evolution.
● The difference between side-by-side alternatives should be big enough to be perceived by users. An automatic solution to tune parameter steps can be valuable.
CONCLUSION AND FUTURE WORK
This paper investigates collaborative design exploration on a wall-sized display by proposing ShapeCompare, a system which enables users to generate and distribute design alterna-tives of a CAD model on large screens. ShapeCompare relies on “small multiple” representations of a CAD object to allow multidisciplinary teams to collaboratively explore, compare alternatives and reflect their ideas on a wall-sized display. It aims to reduce the iterations of industrial design review pro-cesses by avoiding miscommunication between experts and engineers in charge of the CAD data modification.
We ran a controlled experiment to assess how simultaneous visualization of multiple design alternatives affects the col-laboration among experts during a constraint-solving task. We compared ShapeCompare with another technique named ShapeSlidewhich shows only one design alternative at a time, but enable users to quickly switch the displayed alternative. ShapeSlidecould be used on any standard screens since it does not require a large screen space. The results showed that par-ticipants reach a consensus respecting the design constraints significantly faster with ShapeCompare than with ShapeSlide. We also found that participants used more deictic instruc-tions and less verbal or gesture-based design expressions with ShapeCompare than with ShapeSlide. It suggests that the multiple alternative visualization helps collaborators during design exploration and negotiation by increasing the common grounds among them. To our knowledge, it is the first study to demonstrate the benefit of the “small multiple” concept on a wall-sized display.
The current system is still a research prototype. There is a lot of space to explore and improve the way to visualized alternatives and interact with them. For example, ways to classify or to merge relevant design alternatives should be investigated. In addition, the proposed approach could also be applied in many other contexts, such as generative design or physical simulation, for which many alternatives can be generated by intuitively varying parameters.
ACKNOWLEDGMENTS
This work was partially supported by European Research Council (ERC) grant n° 695464 “ONE: Unified Principles of Interaction”; and by Agence Nationale de la Recherche (ANR) grants ANR-10-EQPX-26-01 “EquipEx DIGISCOPE” and ANR-11-LABEX-0045-DIGICOSME “Labex Digicosme” as part of the program “Investissement d’Avenir” ANR-11-IDEX-0003-02 “Idex Paris-Saclay”.
REFERENCES
[1] Bruno R. De Araújo, Géry Casiez, Joaquim A. Jorge, and Martin Hachet. 2013. Mockup Builder: 3D
modeling on and above the surface. Computers & Graphics37, 3 (2013), 165 – 178. DOI:
http://dx.doi.org/10.1016/j.cag.2012.12.005 [2] Ravin Balakrishnan, George Fitzmaurice, Gordon
Kurtenbach, and William Buxton. 1999. Digital Tape Drawing. In Proceedings of the 12th Annual ACM Symposium on User Interface Software and Technology (UIST ’99). ACM, New York, NY, USA, 161–169. DOI: http://dx.doi.org/10.1145/320719.322598
[3] Robert Ball and Chris North. 2008. The Effects of Peripheral Vision and Physical Navigation on Large Scale Visualization. In Proceedings of Graphics Interface 2008 (GI ’08). Canadian Information Processing Society, Toronto, Ont., Canada, 9–16. http://dl.acm.org/citation.cfm?id=1375714.1375717 [4] Robert Ball, Chris North, Chris North, and Doug A.
Bowman. 2007. Move to Improve: Promoting Physical Navigation to Increase User Performance with Large Displays. In Proceedings of the SIGCHI Conference on Human Factors in Computing Systems (CHI ’07). ACM, New York, NY, USA, 191–200. DOI:
http://dx.doi.org/10.1145/1240624.1240656
[5] Michel Beaudouin-Lafon. 2011. Lessons Learned from the WILD Room, a Multisurface Interactive
Environment. In Proceedings of the 23rd Conference on L’Interaction Homme-Machine (IHM ’11). ACM, New York, NY, USA, Article 18, 8 pages. DOI:
http://dx.doi.org/10.1145/2044354.2044376
[6] M. Beaudouin-Lafon, S. Huot, M. Nancel, W. Mackay, E. Pietriga, R. Primet, J. Wagner, O. Chapuis, C. Pillias, J. Eagan, T. Gjerlufsen, and C. Klokmose. 2012. Multisurface Interaction in the WILD Room. Computer 45, 4 (April 2012), 48–56. DOI:
http://dx.doi.org/10.1109/MC.2012.110
[7] Julien Berta. 1999. Integrating VR and CAD. IEEE Computer Graphics and Applications19, 5 (Sep. 1999), 14–19. DOI:http://dx.doi.org/10.1109/38.788793 [8] Xiaojun Bi and Ravin Balakrishnan. 2009. Comparing
Usage of a Large High-resolution Display to Single or Dual Desktop Displays for Daily Work. In Proceedings of the SIGCHI Conference on Human Factors in Computing Systems (CHI ’09). ACM, New York, NY, USA, 1005–1014. DOI:
http://dx.doi.org/10.1145/1518701.1518855 [9] Yannick Bodein, Bertrand Rose, and Emmanuel
Caillaud. 2013. A roadmap for parametric CAD efficiency in the automotive industry. Computer-Aided Design45, 10 (2013), 1198 – 1214. DOI:
http://dx.doi.org/10.1016/j.cad.2013.05.006 [10] William Buxton, George Fitzmaurice, Ravin
Balakrishnan, and Gordon Kurtenbach. 2000. Large displays in automotive design. IEEE Computer Graphics and Applications20, 4 (July 2000), 68–75. DOI: http://dx.doi.org/10.1109/38.851753
[11] SangSu Choi, HyunJei Jo, Stefan Boehm, and Sang Do Noh. 2010. ONESVIEW: An Integrated System for One-Stop Virtual Design Review. Concurrent Engineering18, 1 (2010), 75–91. DOI: http://dx.doi.org/10.1177/1063293X10361624
[12] Herbert H Clark, Susan E Brennan, and others. 1991. Grounding in communication. Perspectives on socially shared cognition13, 1991 (1991), 127–149.
[13] Dane Coffey, Chi-Lun Lin, Arthur G Erdman, and Daniel F Keefe. 2013. Design by Dragging: An Interface for Creative Forward and Inverse Design with Simulation Ensembles. IEEE Trans. on Visualization and Computer Graphics19, 12 (Dec 2013), 2783–2791. DOI:http://dx.doi.org/10.1109/TVCG.2013.147
[14] Thomas Convard and Patrick Bourdot. 2004. History Based Reactive Objects for Immersive CAD. In Proceedings of the Ninth ACM Symposium on Solid Modeling and Applications (SM ’04). Eurographics Association, Aire-la-Ville, Switzerland, 291–296. http://dl.acm.org/citation.cfm?id=1217875.1217921 [15] Mary Czerwinski, Greg Smith, Tim Regan, Brian
Meyers, George Robertson, and Gary Starkweather. 2003. Toward Characterizing the Productivity Benefits of Very Large Displays. In Interact 2003. IOS Press. [16] Jakub Dostal, Uta Hinrichs, Per Ola Kristensson, and
Aaron Quigley. 2014. SpiderEyes: Designing Attention-and Proximity-aware Collaborative Interfaces for Wall-sized Displays. In Proceedings of the 19th International Conference on Intelligent User Interfaces (IUI ’14). ACM, New York, NY, USA, 143–152. DOI: http://dx.doi.org/10.1145/2557500.2557541
[17] Michele Fiorentino, Raffaele de Amicis, Giuseppe Monno, and Andre Stork. 2002. Spacedesign: a mixed reality workspace for aesthetic industrial design. In Proceedings. International Symposium on Mixed and Augmented Reality. 86–318. DOI:
http://dx.doi.org/10.1109/ISMAR.2002.1115077 [18] T. Fleisch, G. Brunetti, P. Santos, and A. Stork. 2004.
Stroke-input methods for immersive styling environments. In Proceedings Shape Modeling Applications, 2004.275–283. DOI:
http://dx.doi.org/10.1109/SMI.2004.1314514
[19] Clifton Forlines, Daniel Vogel, and Ravin Balakrishnan. 2006. HybridPointing: Fluid Switching Between Absolute and Relative Pointing with a Direct Input Device. In Proceedings of the 19th Annual ACM Symposium on User Interface Software and Technology (UIST ’06). ACM, New York, NY, USA, 211–220. DOI: http://dx.doi.org/10.1145/1166253.1166286
[20] Tovi Grossman, Ravin Balakrishnan, Gordon
Kurtenbach, George Fitzmaurice, Azam Khan, and Bill Buxton. 2001. Interaction Techniques for 3D Modeling on Large Displays. In Proceedings of the 2001
Symposium on Interactive 3D Graphics (I3D ’01). ACM, New York, NY, USA, 17–23. DOI:
http://dx.doi.org/10.1145/364338.364341
[21] Sandra G. Hart and Lowell E. Staveland. 1988. Development of NASA-TLX (Task Load Index): Results of Empirical and Theoretical Research. In Human Mental Workload. Advances in Psychology, Vol. 52. North-Holland, 139 – 183. DOI:
http://dx.doi.org/10.1016/S0166-4115(08)62386-9 [22] Takeo Igarashi, Takeo Igarashi, and John F. Hughes.
2007. A Suggestive Interface for 3D Drawing. In ACM SIGGRAPH 2007 Courses (SIGGRAPH ’07). ACM, New York, NY, USA, Article 20. DOI:
http://dx.doi.org/10.1145/1281500.1281531
[23] J.H. Israel, E. Wiese, M. Mateescu, C. Zöllner, and R. Stark. 2009. Investigating three-dimensional sketching for early conceptual design—Results from expert discussions and user studies. Computers & Graphics 33, 4 (2009), 462 – 473. DOI:
http://dx.doi.org/10.1016/j.cag.2009.05.005 [24] Mikkel R. Jakobsen and Kasper Hornbæk. 2014. Up
Close and Personal: Collaborative Work on a
High-resolution Multitouch Wall Display. ACM Trans. Comput.-Hum. Interact.21, 2, Article 11 (Feb. 2014), 34 pages. DOI:http://dx.doi.org/10.1145/2576099
[25] Daniel F Keefe, Robert C Zeleznik, and David H Laidlaw. 2007. Drawing on Air: Input Techniques for Controlled 3D Line Illustration. IEEE Transactions on Visualization and Computer Graphics13, 5 (Sep. 2007), 1067–1081. DOI:
http://dx.doi.org/10.1109/TVCG.2007.1060
[26] Azam Khan, Justin Matejka, George Fitzmaurice, and Gordon Kurtenbach. 2005. Spotlight: Directing Users’ Attention on Large Displays. In Proc. of the SIGCHI Conference on Human Factors in Computing Systems (CHI ’05). ACM, New York, NY, USA, 791–798. DOI: http://dx.doi.org/10.1145/1054972.1055082
[27] Sebastien Kuntz. 2017. improov3, The VR collaborative meeting room, MiddleVR company, Paris, FRANCE, http://www.improovr.com/home/. (2017).
http://www.improovr.com/home/
[28] R. Langner, U. Kister, and R. Dachselt. 2019. Multiple Coordinated Views at Large Displays for Multiple Users: Empirical Findings on User Behavior, Movements, and Distances. IEEE Transactions on Visualization and Computer Graphics25, 1 (Jan 2019), 608–618. DOI: http://dx.doi.org/10.1109/TVCG.2018.2865235
[29] Glyn Lawson, Davide Salanitri, and Brian Waterfield. 2015. VR Processes in the Automotive Industry. In Human-Computer Interaction: Users and Contexts, Masaaki Kurosu (Ed.). Springer International Publishing, 208–217. DOI:
http://dx.doi.org/10.1007/978-3-319-21006-3_21 [30] Valerie D Lehner and Thomas A DeFanti. 1997.
Distributed virtual reality: supporting remote collaboration in vehicle design. IEEE Computer Graphics and Applications17, 2 (March 1997), 13–17. DOI:http://dx.doi.org/10.1109/38.574654
[31] Can Liu, Olivier Chapuis, Michel Beaudouin-Lafon, and Eric Lecolinet. 2016. Shared Interaction on a Wall-Sized Display in a Data Manipulation Task. In Proceedings of the 2016 CHI Conference on Human Factors in Computing Systems (CHI ’16). ACM, New York, NY, USA, 2075–2086. DOI:
http://dx.doi.org/10.1145/2858036.2858039
[32] Can Liu, Olivier Chapuis, Michel Beaudouin-Lafon, and Eric Lecolinet. 2017. CoReach: Cooperative Gestures for Data Manipulation on Wall-sized Displays. In Proceedings of the 2017 CHI Conference on Human Factors in Computing Systems (CHI ’17). ACM, New York, NY, USA, 6730–6741. DOI:
http://dx.doi.org/10.1145/3025453.3025594
[33] Can Liu, Olivier Chapuis, Michel Beaudouin-Lafon, Eric Lecolinet, and Wendy E. Mackay. 2014. Effects of Display Size and Navigation Type on a Classification Task. In Proceedings of the 32Nd Annual ACM Conference on Human Factors in Computing Systems (CHI ’14). ACM, New York, NY, USA, 4147–4156. DOI:http://dx.doi.org/10.1145/2556288.2557020 [34] Jean-Baptiste Louvet and Cédric Fleury. 2016.
Combining Bimanual Interaction and Teleportation for 3D Manipulation on Multi-touch Wall-sized Displays. In Proceedings of the 22Nd ACM Conference on Virtual Reality Software and Technology (VRST ’16). ACM, New York, NY, USA, 283–292. DOI:
http://dx.doi.org/10.1145/2993369.2993390
[35] Morad Mahdjoub, Davy Monticolo, Samuel Gomes, and Jean-Claude Sagot. 2010. A collaborative Design for Usability approach supported by Virtual Reality and a Multi-Agent System embedded in a PLM environment. Computer-Aided Design42, 5 (2010), 402 – 413. DOI: http://dx.doi.org/10.1016/j.cad.2009.02.009
[36] Pierre Martin, Stéphane Masfrand, Yujiro Okuya, and Patrick Bourdot. 2017. A VR-CAD Data Model for Immersive Design. In Augmented Reality, Virtual Reality, and Computer Graphics. Springer International Publishing, Cham, 222–241. DOI:
http://dx.doi.org/10.1007/978-3-319-60922-5_17 [37] T.S. Mujber, T. Szecsi, and M.S.J. Hashmi. 2004.
Virtual reality applications in manufacturing process simulation. Journal of Materials Processing Technology 155-156 (2004), 1834 – 1838. DOI:
http://dx.doi.org/10.1016/j.jmatprotec.2004.04.401 [38] Mathieu Nancel, Olivier Chapuis, Emmanuel Pietriga,
Xing-Dong Yang, Pourang P. Irani, and Michel Beaudouin-Lafon. 2013. High-precision Pointing on Large Wall Displays Using Small Handheld Devices. In Proceedings of the SIGCHI Conference on Human Factors in Computing Systems (CHI ’13). ACM, New York, NY, USA, 831–840. DOI:
http://dx.doi.org/10.1145/2470654.2470773
[39] Yujiro Okuya, Nicolas Ladeveze, Cédric Fleury, and Patrick Bourdot. 2018a. ShapeGuide: Shape-Based 3D
Interaction for Parameter Modification of Native CAD Data. Frontiers in Robotics and AI 5 (2018), 118. DOI: http://dx.doi.org/10.3389/frobt.2018.00118
[40] Yujiro Okuya, Nicolas Ladeveze, Olivier Gladin, Cédric Fleury, and Patrick Bourdot. 2018b. Distributed Architecture for Remote Collaborative Modification of Parametric CAD Data. In 2018 IEEE Fourth VR International Workshop on Collaborative Virtual Environments (3DCVE). 1–4. DOI:
http://dx.doi.org/10.1109/3DCVE.2018.8637112
[41] Dan R. Olsen. 2007. Evaluating User Interface Systems Research. In Proceedings of the 20th Annual ACM Symposium on User Interface Software and Technology (UIST ’07). Association for Computing Machinery, New York, NY, USA, 251–258. DOI:
http://dx.doi.org/10.1145/1294211.1294256
[42] D. Rantzau, F. Maurer, C. Mayer, R. Löffler, O. Riedel, H. Scharm, and D. Banek. 2001. The integration of immersive Virtual Reality applications into Catia V5. In Immersive Projection Technology and Virtual
Environments 2001. Springer Vienna, Vienna, 93–102. DOI:http://dx.doi.org/10.1007/978-3-7091-6221-7_10 [43] Alberto Raposo, Ismael Santos, Luciano Soares,
Gustavo Wagner, Eduardo Corseuil, and Marcelo Gattass. 2009. Environ: Integrating VR and CAD in Engineering Projects. IEEE Computer Graphics and Applications29, 6 (Nov 2009), 91–95. DOI: http://dx.doi.org/10.1109/MCG.2009.118
[44] Judy Robertson and Maurits Kaptein. 2016. Modern Statistical Methods for HCI. Springer. DOI: http://dx.doi.org/10.1007/978-3-319-26633-6 [45] Drew Skillman and Patrick Hackett. 2016. Tilt Brush
application, Google Inc., https://www.tiltbrush.com/. https://www.tiltbrush.com/
[46] TechViz. 2004. TechViz XL. (2004). https://www.techviz.net/techviz-xl
[47] Daniel Vogel and Ravin Balakrishnan. 2005. Distant Freehand Pointing and Clicking on Very Large, High Resolution Displays. In Proc. of the 18th Annual ACM Symposium on User Interface Software and Technology (UIST ’05). ACM, New York, NY, USA, 33–42. DOI: http://dx.doi.org/10.1145/1095034.1095041
[48] Beth Yost, Yonca Haciahmetoglu, Chris North, and Chris North. 2007. Beyond Visual Acuity: The
Perceptual Scalability of Information Visualizations for Large Displays. In Proceedings of the SIGCHI
Conference on Human Factors in Computing Systems (CHI ’07). ACM, New York, NY, USA, 101–110. DOI: http://dx.doi.org/10.1145/1240624.1240639
[49] Peter Zimmermann. 2008. Virtual Reality Aided Design. A survey of the use of VR in automotive industry. Springer Netherlands, Dordrecht, 277–296. DOI: http://dx.doi.org/10.1007/978-1-4020-8200-9_13