HAL Id: hal-01602794
https://hal.archives-ouvertes.fr/hal-01602794
Submitted on 26 May 2020
HAL is a multi-disciplinary open access
archive for the deposit and dissemination of
sci-entific research documents, whether they are
pub-lished or not. The documents may come from
teaching and research institutions in France or
abroad, or from public or private research centers.
L’archive ouverte pluridisciplinaire HAL, est
destinée au dépôt et à la diffusion de documents
scientifiques de niveau recherche, publiés ou non,
émanant des établissements d’enseignement et de
recherche français ou étrangers, des laboratoires
publics ou privés.
ecological focus areas for biodiversity and farmers
Guy Pe’Er, Yves Zinngrebe, Jennifer Hauck, Stefan Schindler, Andreas
Dittrich, Silvia Zingg, Teja Tscharntke, Rainer Oppermann, Laura Sutcliffe,
Clélia Sirami, et al.
To cite this version:
Guy Pe’Er, Yves Zinngrebe, Jennifer Hauck, Stefan Schindler, Andreas Dittrich, et al.. Adding some
green to the greening: improving the EU’s ecological focus areas for biodiversity and farmers.
Con-servation Letters, Wiley, 2016, Novembre (Online), �10.1111/conl.12333�. �hal-01602794�
Adding Some Green to the Greening: Improving the EU’s
Ecological Focus Areas for Biodiversity and Farmers
Guy Pe’er1,2, Yves Zinngrebe1,3, Jennifer Hauck4,5, Stefan Schindler6,7, Andreas Dittrich8, Silvia Zingg9,10, Teja Tscharntke11, Rainer Oppermann12, Laura M.E. Sutcliffe12,13, Cl ´elia Sirami14, Jenny Schmidt15, Christian Hoyer8, Christian Schleyer16, & Sebastian Lakner3
1Department of Conservation Biology, UFZ – Helmholtz Centre for Environmental Research, Permoserstr. 15, 04318 Leipzig, Germany 2German Centre for Integrative Biodiversity Research (iDiv) Halle-Jena-Leipzig, Deutscher Platz 5e, 04103 Leipzig, Germany
3Georg-August-University G ¨ottingen,Department for Agricultural Economics and Rural Development, Platz der G ¨ottinger Sieben 5, 37073 G ¨ottingen, Germany
4CoKnow Consulting – Coproducing Knowledge for Sustainability, M ¨uhlweg 3, 04838 Jesewitz, Germany
5Department of Environmental Politics, UFZ – Helmholtz Centre for Environmental Research, Permoserstr. 15, 04318 Leipzig, Germany 6Environment Agency Austria, Spittelauer L ¨ande 5 (A-1090) Vienna, Austria
7Department of Conservation Biology, Vegetation & Landscape Ecology, University of Vienna, Rennweg 14 (A-1030) Vienna, Austria
8Department of Computational Landscape Ecology, UFZ – Helmholtz Centre for Environmental Research, Permoserstr. 15, 04318 Leipzig, Germany 9Division of Conservation Biology, Institute of Ecology and Evolution, University of Bern, 3013 Bern, Switzerland
10Bern University of Applied Sciences,School of Agricultural, Forest and Food Sciences, 3052 Zollikofen, Switzerland 11Agroecology, Department of Crop Sciences, University of G ¨ottingen, Grisebachstraße 6, 37077 G ¨ottingen, Germany 12Institute for Agro-ecology and Biodiversity (IFAB), B ¨ocklinstr. 27, 68163 Mannheim, Germany
13Plant Ecology and Ecosystems Research, University of G ¨ottingen, Untere Karsp ¨ule 2, 37073 G ¨ottingen, Germany 14Dynafor, Universit ´e de Toulouse, INRA, INPT, INP-EI Purpan, Castanet Tolosan, France
15Department of Environmental Politics, UFZ – Helmholtz Centre for Environmental Research, Permoserstr. 15, 04318 Leipzig, Germany 16Institute of Social Ecology, Alpen-Adria University Klagenfurt, Schottenfeldgasse 29, 1070 Vienna, Austria
Keywords
Agriculture; biodiversity; Common Agricultural Policy; Ecological Focus Areas; farmers’ choices; greening measures; policy implementation; policy simplification.
Correspondence
Guy Pe’er, Department of Conservation Biology, UFZ – Helmholtz Centre for Environmental Research, Permoserstr. 15 04318 Leipzig, Germany. E-mail: Guy.peer@ufz.de
Received 27 July 2016 Accepted 14 November 2016 doi: 10.1111/conl.12333 Abstract
Ecological Focus Areas (EFAs) are one of the three new greening measures of the European Common Agricultural Policy (CAP). We used an interdisci-plinary and European-scale approach to evaluate ecological effectiveness and farmers’ perception of the different EFA options. We assessed potential bene-fits of EFA options for biodiversity using a survey among 88 ecologists from 17 European countries. We further analyzed data on EFA uptake at the EU level and in eight EU Member States, and reviewed socio-economic factors influ-encing farmers’ decisions. We then identified possible ways to improve EFAs. Ecologists scored field margins, buffer strips, fallow land, and landscape fea-tures as most beneficial whereas farmers mostly implemented “catch crops and green cover,” nitrogen-fixing crops, and fallow land. Based on the expert in-puts and a review of the factors influencing farmers’ decisions, we suggest that EFA implementation could be improved by (a) prioritizing EFA options that promote biodiversity (e.g., reducing the weight or even excluding ineffective options); (b) reducing administrative constraints; (c) setting stricter manage-ment requiremanage-ments (e.g., limiting agrochemical use); and (d) offering further incentives for expanding options like landscape features and buffer strips. We finally propose further improvements at the next CAP reform, to improve eco-logical effectiveness and cost-effectiveness.
Introduction
Agricultural intensification and land abandonment ex-ert major pressures on farmland biodiversity and
dimin-ish ecosystem functions and services. The ongoing de-cline in biodiversity in and around farmland is a source of major concern both in Europe (EEA 2015) and glob-ally (Maxwell et al. 2016). In the European Union (EU),
a key instrument that could help mitigate these trends is the Common Agricultural Policy (CAP). The CAP pro-vides payments under two “Pillars”: “direct payments and market-related expenditures” (Pillar 1, circa€37 Bil-lion/yr) and “Rural Development” (Pillar 2, circa€14 Bil-lion/yr).
Since its first implementation in 1962, the CAP has been repeatedly reformed to reflect changes in societal demands. In response to the increasing demand for bio-diversity conservation (Hodge et al. 2015), the latest re-form of 2015 introduced a “greening” of Pillar 1. Conse-quently, 30% of the payment are now linked to one or more of three new greening measures (EC 2013a, Ar-ticle 43): (a) crop diversification, requiring farms with arable land exceeding 20 or 30 hectares to grow at least two or three crops, respectively; (b) maintenance of per-manent pastures, allowing only for a maximum loss of 5% by 2020; and (c) promotion of Ecological Focus Ar-eas (EFAs), requiring farms with arable arAr-eas exceeding 15 hectares to dedicate 5% of such areas to ecologically beneficial elements as defined by the European Com-mission (EC). Such elements include landscape features such as terraces, hedges, or ponds, but also fallow land, nitrogen-fixing crops, and “catch crops and green cover” (EC 2013a, 2014; see Table 1). As the ecological value and implementation costs of different EFA options vary, the EC introduced weighting factors (see Table 2): for ex-ample, one hectare of landscape features is counted as 1.5 ha, whereas the same area of nitrogen-fixing crops is counted as 0.3 hectare. Each Member State (MS) had the opportunity to select which of the ten EFA options defined by the EC are eligible for their national direct payments. In addition, MSs may support other “equiv-alent measures” that offer a similar or greater benefit for the environment, as long as they are approved by the EC prior to implementation. Each farmer may then choose which EFA options and/or national equivalent measures to implement (Oppermann 2015).
Challenges for biodiversity and farmers
The new greening measures have been criticized by ecologists and environmental organizations for setting requirements that are too low to halt the loss of farmland biodiversity (Pe’er et al. 2014a), and for not selecting the most effective measures for conserving biodiversity under current financial constraints (Dicks et al. 2014; Sutherland et al. 2015). In addition, the introduction of new greening measures resulted in increased ad-ministrative burdens for farmers and authorities, and therefore simplification of CAP’s implementation will play an important role in its upcoming mid-term review, scheduled for March 2017 (European Council 2015).
Consequently, while the general public largely supports the CAP greening (EC 2016c), it is essential to assess whether its current design and implementation can yield significant positive impacts on biodiversity while being practicable for farmers. The recent release of reports by each MS on the implementation of CAP greening measures in 2015 provides a unique opportunity to do so.
Objectives of this article
This article examines how greening measures are cur-rently designed and implemented, and how they could be improved to the benefit of both biodiversity and farm-ers. We focus here on Ecological Focus Areas (EFAs) be-cause they represent a new element of the CAP whose effects on biodiversity are poorly documented. Further-more, EFAs are likely to be subjected to reforms during the 2017 mid-term review, including the expansion of EFAs from 5% to 7% of arable land, and will likely re-main part of the policy mix for the CAP beyond 2020. It is therefore critical and timely to assess the current design and implementation of EFAs and propose recommenda-tions to improve their effectiveness for biodiversity while overcoming possible implementation barriers for farmers. This article presents an interdisciplinary evaluation of the various EFA options, combining ecological experts’ assessments on their potential effects on biodiversity with social scientists’ review and evaluations of the factors in-fluencing farmers’ implementation decisions. To this end, we (1) conducted a European-scale survey among ecolo-gists to assess potential biodiversity effects of EFA options; (2) collected data on farmers’ uptake to examine on-the-ground EFA implementation; (3) synthesized expert opinions and a review of the factors influencing farm-ers’ decisions; and (4) compared EFA options according to their impacts on biodiversity and their relevance for farmers to identify possible improvements of EFA design and implementation. Through this interdisciplinary and European-scale approach, we develop recommendations aiming to increase the uptake and best management of biodiversity-friendly options by farmers; reduce admin-istrative burdens; and promote coherence between CAP and EU’s nature conservation goals.
Methods
The conceptual framework of this study was developed over three interdisciplinary workshops between June and September 2015 (see Supporting Information [SI] 1). The spectrum of methods chosen included:
(1) Ecologists’ evaluation of EFA impacts on
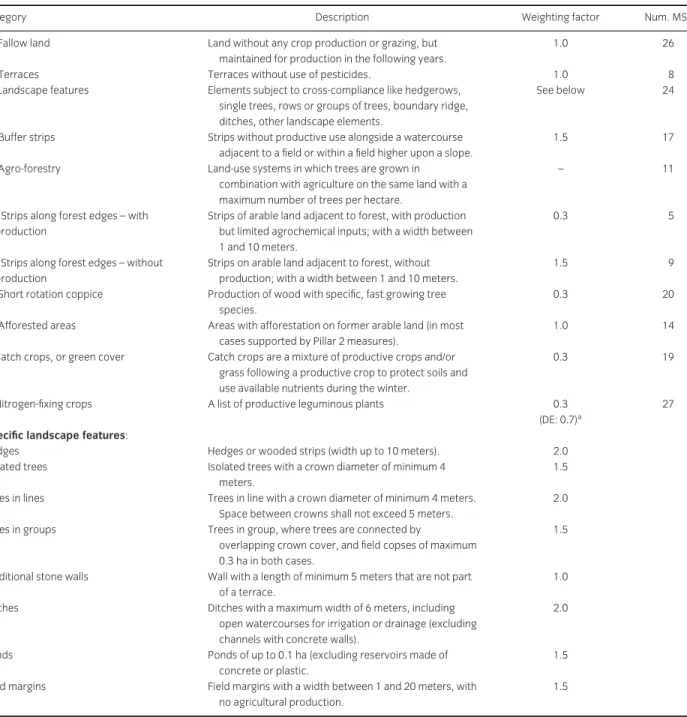
Table 1 Overview of the options defined by the EU as eligible for EFAs, alongside the weighting factor defined by the EC for a given area taken up for
each option, and the number of MSs implementing each EFA option (= “Num. MSs”)
Category Description Weighting factor Num. MSs
(a) Fallow land Land without any crop production or grazing, but maintained for production in the following years.
1.0 26
(b) Terraces Terraces without use of pesticides. 1.0 8
(c) Landscape features Elements subject to cross-compliance like hedgerows, single trees, rows or groups of trees, boundary ridge, ditches, other landscape elements.
See below 24
(d) Buffer strips Strips without productive use alongside a watercourse adjacent to a field or within a field higher upon a slope.
1.5 17
(e) Agro-forestry Land-use systems in which trees are grown in combination with agriculture on the same land with a maximum number of trees per hectare.
– 11
(f1) Strips along forest edges – with production
Strips of arable land adjacent to forest, with production but limited agrochemical inputs; with a width between 1 and 10 meters.
0.3 5
(f2) Strips along forest edges – without production
Strips on arable land adjacent to forest, without production; with a width between 1 and 10 meters.
1.5 9
(g) Short rotation coppice Production of wood with specific, fast growing tree species.
0.3 20
(h) Afforested areas Areas with afforestation on former arable land (in most cases supported by Pillar 2 measures).
1.0 14
(i) Catch crops, or green cover Catch crops are a mixture of productive crops and/or grass following a productive crop to protect soils and use available nutrients during the winter.
0.3 19
(j) Nitrogen-fixing crops A list of productive leguminous plants 0.3 27 (DE: 0.7)a
Specific landscape features:
Hedges Hedges or wooded strips (width up to 10 meters). 2.0
Isolated trees Isolated trees with a crown diameter of minimum 4 meters.
1.5 Trees in lines Trees in line with a crown diameter of minimum 4 meters.
Space between crowns shall not exceed 5 meters.
2.0 Trees in groups Trees in group, where trees are connected by
overlapping crown cover, and field copses of maximum 0.3 ha in both cases.
1.5
Traditional stone walls Wall with a length of minimum 5 meters that are not part of a terrace.
1.0 Ditches Ditches with a maximum width of 6 meters, including
open watercourses for irrigation or drainage (excluding channels with concrete walls).
2.0
Ponds Ponds of up to 0.1 ha (excluding reservoirs made of concrete or plastic.
1.5 Field margins Field margins with a width between 1 and 20 meters, with
no agricultural production.
1.5
aIn Germany, the weighting factor for nitrogen-fixing crops is 0.7, using the flexibility allowed by EC delegated regulation (EU) No 639/2014. Source: EC 2014.
ecologists in the EU and Switzerland working on biodiversity in agro-ecosystems. As potential experts we considered persons who perform ecological re-search, monitoring or conservation management in agricultural landscapes or farmland areas. Familiar-ity with at least some of the features eligible for EFAs was required, while policy knowledge was not. Ex-perts were identified as such by workshop
partici-pants or suggested by other respondents to our sur-vey (i.e., a snowball approach). In total, invitations to complete the survey were sent to circa 310 experts, asking them to only fill out the survey if they felt they had sufficient expertise in the subject area. Re-spondents were asked to state their area of expertise (geographic, methodological, and taxonomic) and assess the impacts of EFA options for up to three
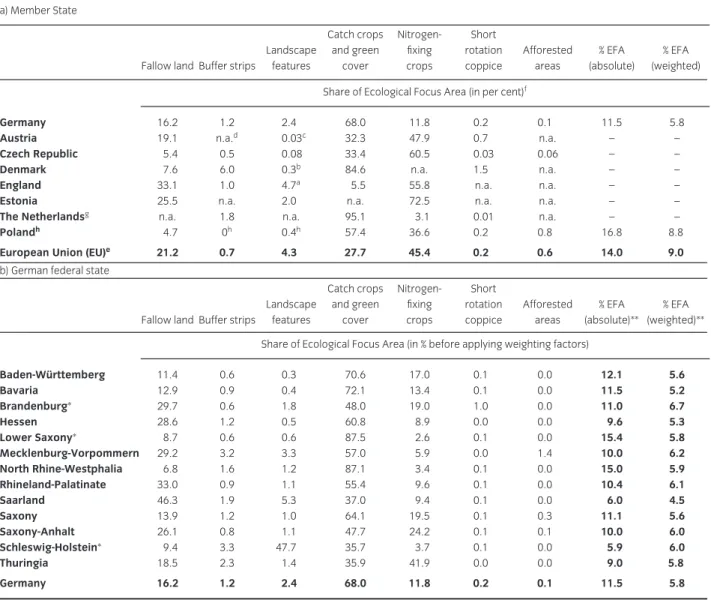
Table 2 Share of the different Ecological Focus Area (EFA) options taken up (a) at 8 MSs and the EU level, and, (b) in the different federal states of Germany
(shares of area are in % and before applying weighting factors) a) Member State
Fallow land Buffer strips
Landscape features Catch crops and green cover Nitrogen-fixing crops Short rotation coppice Afforested areas % EFA (absolute) % EFA (weighted) Share of Ecological Focus Area (in per cent)f
Germany 16.2 1.2 2.4 68.0 11.8 0.2 0.1 11.5 5.8
Austria 19.1 n.a.d 0.03c 32.3 47.9 0.7 n.a. – –
Czech Republic 5.4 0.5 0.08 33.4 60.5 0.03 0.06 – –
Denmark 7.6 6.0 0.3b 84.6 n.a. 1.5 n.a. – –
England 33.1 1.0 4.7a 5.5 55.8 n.a. n.a. – –
Estonia 25.5 n.a. 2.0 n.a. 72.5 n.a. n.a. – –
The Netherlandsg n.a. 1.8 n.a. 95.1 3.1 0.01 n.a. – –
Polandh 4.7 0h 0.4h 57.4 36.6 0.2 0.8 16.8 8.8
European Union (EU)e 21.2 0.7 4.3 27.7 45.4 0.2 0.6 14.0 9.0
b) German federal state
Fallow land Buffer strips
Landscape features Catch crops and green cover Nitrogen-fixing crops Short rotation coppice Afforested areas % EFA (absolute)∗∗ % EFA (weighted)∗∗ Share of Ecological Focus Area (in % before applying weighting factors)
Baden-W ¨urttemberg 11.4 0.6 0.3 70.6 17.0 0.1 0.0 12.1 5.6 Bavaria 12.9 0.9 0.4 72.1 13.4 0.1 0.0 11.5 5.2 Brandenburg∗ 29.7 0.6 1.8 48.0 19.0 1.0 0.0 11.0 6.7 Hessen 28.6 1.2 0.5 60.8 8.9 0.0 0.0 9.6 5.3 Lower Saxony∗ 8.7 0.6 0.6 87.5 2.6 0.1 0.0 15.4 5.8 Mecklenburg-Vorpommern 29.2 3.2 3.3 57.0 5.9 0.0 1.4 10.0 6.2 North Rhine-Westphalia 6.8 1.6 1.2 87.1 3.4 0.1 0.0 15.0 5.9 Rhineland-Palatinate 33.0 0.9 1.1 55.4 9.6 0.1 0.0 10.4 6.1 Saarland 46.3 1.9 5.3 37.0 9.4 0.1 0.0 6.0 4.5 Saxony 13.9 1.2 1.0 64.1 19.5 0.1 0.3 11.1 5.6 Saxony-Anhalt 26.1 0.8 1.1 47.7 24.2 0.1 0.1 10.0 6.0 Schleswig-Holstein∗ 9.4 3.3 47.7 35.7 3.7 0.1 0.0 5.9 6.0 Thuringia 18.5 2.3 1.4 35.9 41.9 0.0 0.0 9.0 5.8 Germany 16.2 1.2 2.4 68.0 11.8 0.2 0.1 11.5 5.8
Source: Results for MSs were reported by national Ministries for Agriculture from October 2015 until February 2016. EU-wide results were reported by the EU Commission in June 2016.
aEngland: Hedges.
bDenmark: Ponds and archaeological sites between 0.01 and 0.2 ha. cAustria: Ponds and ditches are offered as landscape features. d“n.a.”: measure not approved in that MS.
ePreliminary Data for all MSs except France. fShare of area before applying weighting factors.
gThe “collective approaches” to EFA and the “Skylark-Program” are not included in the figures.
hIn Poland, the figures for some of the landscape features and buffer strips were only available in “linear meters,” not in hectares. So for these two options, the presented EFA share is probably slightly underestimated.
Source: German Ministry for Food and Agriculture (BMEL) 2015b.
∗The city-states Berlin (BE), Bremen (HB), and Hamburg (HH) were added to Brandenburg, Lower Saxony, and Schleswig-Holstein, respectively. ∗∗Note that because of the weighting factors employed, the total area of EFAs cannot be interpreted based on the presented shares (in percentage). For raw numbers (in area) see Table S5 in SI 4.
“groups” defined by taxon and habitat affiliation (e.g., forest birds, grassland butterflies). Experts then scored the effects of each EFA option on each “group,” in their view, from+5 (very positive) to -5 (very negative) or “mixed effects.” Experts were also asked to identify conditions under which each EFA option could most benefit biodiversity (e.g., agricul-tural management, spatial design, vegetation compo-sition, implementation duration, structural mainte-nance, and other). For further details on the meth-ods and profile of the respondents, see SI 1. For an overview of the recommendations, see SI 2.
The answers of the experts were analyzed using de-scriptive statistics (mean, median, quantiles, and 95% CIs). We used the average score to define an ecological “win” (average > 1), “lose” (< -1), or “mixed” (-1 < average < 1). This assignment was verified against the three quartiles of score values, identifying the number of cases above, at, or under 0, as well as by inspecting the frequency distribution of scores. We refrained from con-ducting significance tests due to the high variance in score values (see Figure 1), related to regional and taxonomic differences which are beyond the scope of this study.
2 Statistics on the implementation of EFAs in
2015: We asked agricultural ministries across MSs
for data on the number of farmers and total area registered under each EFA option in 2015. We considered that these uptake levels represent good indicators of farmers’ preferences. We re-ceived data from eight MSs: Germany, Estonia, The Netherlands, Denmark, Austria, Czech Repub-lic, England, and Poland as well as a preliminary data at the EU level based on all MSs except France (EC 2016b). We defined EFAs as “win” (+) and “lose” (-) based on high or low uptakes at the EU level, assuming that these indicate attractiveness from the farmers’ perspectives. This assignment was confirmed through interviews with farmer represen-tatives in a complementary study (Zinngrebe et al. submitted).
We obtained additional data on variations in farmers’ uptake levels across German federal states, including (a) the total cover of each EFA option declared in 2015 com-pared to the total Utilized Agricultural Area (UAA), and (b) the total cover of nitrogen-fixing crops and fallow land over time since 2004.
3 Expert knowledge on factors influencing
farm-ers’ uptake: We collected inputs during the three
workshops on the determinants that may influence farmer’s EFA decisions. At the third workshop, we structured these inputs, and divided these
determi-nants into three categories: economic determidetermi-nants, administrative conditions, and farm-level manage-ment. These categories were used to guide a litera-ture review of>30 publications in English and Ger-man (both peer reviewed and gray literature), to aid interpreting the implementation statistics, and thereby, gaining a better understanding of farmer’s preferences and constraints.
4 Synthesis and collation of recommendations: We compared EFA options according to both their impacts on biodiversity and their uptake by farm-ers, to identify different categories of EFA options (“win-win,” “win-lose,” etc.). Based on this simple categorization, combined with the expert opinions provided during the workshops and survey, we then developed recommendations on the ways to mitigate potential trade-offs and conflicts.
We note that ecologists participating in our surveys focused on above-ground biodiversity, and particularly farmland biodiversity. Less attention was also given to biodiversity in forested areas. We did not analyze geo-graphical differentiation in scoring values, nor impacts of EFAs on ecosystem services, as these aspects were beyond the scope of this study.
Results
EFA impacts on biodiversity
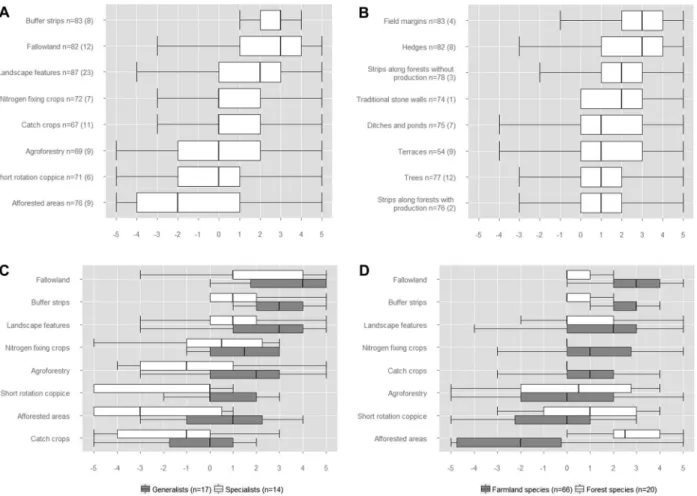
We received 88 expert responses to our survey, from 16 MSs and Switzerland. The number of responses varied among EFA options, ranging from 67 for catch crops to 87 for landscape features. Taxonomic expertise included birds, plants, arthropods, mammals, amphibians, and rep-tiles. Scores were associated with high variance for some EFA options (e.g., afforested areas, agroforestry, or ter-races), probably as a result of taxonomic and geographic differences, as well as differences on how envisioned practices were implemented in detail (Figure 1). Overall, buffer strips, fallow land, and landscape features received mostly positive scores, while agroforestry, afforestation, and short-rotation coppice received generally negative scores in terms of their perceived impact on biodiversity (Figure 1). Among landscape features, hedges, field margins, and traditional stone walls received the highest scores (Figure 1). All options apart from catch crops and short-rotation coppice were considered to have an overall positive effect on generalist species, whereas specialist species were considered to benefit primarily from fallow land, buffer strips, and landscape features (Figure 1C). Fallow land and buffer strips were considered to benefit farmland species, while landscape features and nitrogen-fixing crops had more variable scores (Figure 1D).
Figure 1 Outcome of EFA scoring by ecologists (A) for all EFAs, (B) for every type of landscape feature, (C) categorized based on specialization of assessed
groups into generalists versus specialists, and (D) categorized based on habitat affiliation (forest versus farmland species). Box plots depict the medians, quantiles, and standard deviation.N is the number of experts assessing a given EFA or species’ group. The number of experts reporting “mixed” effects is given in brackets for (A) and (B).
Despite an overall negative score, afforested areas were scored as benefitting forest species (Figure 1D).
EFA implementation in 2015
The number of EFA options eligible for implementation varied between MSs: 14 MSs approved >10 EFA op-tions, 9 MSs approved between 5 and 9 opop-tions, and 5 MSs approved ࣘ 4 options. Nitrogen-fixing crops, fal-low land, and landscape features were taken up by the largest number of MSs (Table 1). Overall in the EU, farm-ers registered 16% of the arable land as EFAs, equiva-lent to 10% after applying weighting factors (Table 2). Three EFA options accounted for the vast majority of EFA cover: nitrogen-fixing crops, “catch crops and green cover,” and fallow land. In most MSs assessed, landscape features had a very low uptake, as did buffer strips. Im-plementation levels varied both among and within MSs.
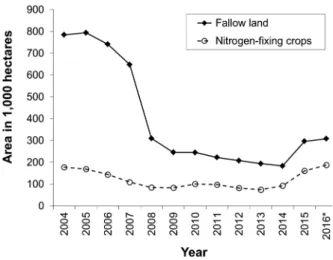
Nitrogen-fixing crops had a share of 46% across the EU but ranged in the assessed MSs from 3% (The Nether-lands) to 73% (Estonia). Catch crops (27% at EU level) ranged from 6% to 95%, while fallow land (21%) ranged from 5% to 33% (Table 2). In Germany, “catch crops and green cover” represented the main EFA option (68% of total EFA), but uptake levels were particularly high in the federal states of Lower Saxony, North Rhine-Westphalia, Bavaria, and Baden-W ¨urttemberg (Table 2). Landscape features made up only 2.4% of the EFA area on aver-age in Germany, but 48% in Schleswig-Holstein. The area of nitrogen-fixing crops and fallow land in Germany in-creased by 74% and 62%, respectively, between 2014 and 2015 (Figure 2), indicating a direct impact of EFA im-plementation. Nevertheless, the area of fallow land and nitrogen-fixing crops remains considerably smaller than during the obligatory set-aside policy of the CAP prior to 2008 and the support of leguminous plants in the 2000s
Figure 2 Cover of fallow land and nitrogen-fixing crops in Germany
through the years 2004–2016. Source: Destatis 2005–2016.∗Note that the data for 2016 are preliminary.
(Figure 2). Also, it is estimated that only 15.1–41.5% of the existing landscape features and buffer strips in Ger-many were registered as EFAs in 2015 (Isermeyer et al. 2014, p. 15).
Determinants of uptake among farmers
Our literature review identified multiple theories and ap-proaches which can be used to explain farmers’ decision-making (Ajzen 1991; Van der Ploeg 1994; de Snoo et al. 2013; Home et al. 2014). Following Lange et al. (2015), we clustered determinants into three key categories: economic determinants, administrative restrictions, and farmers’ perceptions and knowledge (see also Table 3). (a) Economic determinants
Economic considerations, including minimizing the production, opportunity, and/or transaction costs, are central for farmers when evaluating policies. Farmers perceive greening restrictions as costly (Schulz et al. 2014) and therefore tend to choose the most productive and cheapest options (Lakner & Holst 2015). Consequently, 73.1% of the total EFA-area in the EU is covered by “productive options” (EC 2016b; see also Table 2). Eco-nomic considerations also tend to favor existing features (e.g., the high registration of landscape features in the federal state of Schleswig-Holstein, Table 2), as well as practices that are easy to implement. This is reflected by the large proportion of “catch crops and green cover” in some MSs (Table 2). Land productivity, expressed in costs of land rent, affects EFA choices too. For instance, higher uptake of fallow land in Germany occurred in
federal states with lower land-rental prices and usually lower productivity, indicating low opportunity costs (see
Figure S1 in SI 3). Production costs and opportunity
costs for land use, but also transaction costs and property rights, limit the establishment of new landscape elements such as hedges (Schleyer & Plieninger 2011). Finally, for economic reasons the expectation is that most farmers will not abandon the system of direct payments, since the implementation costs are clearly below the received greening payments (Heinrich 2012; de Witte & Latacz-Lohmann 2014; Schmidt et al. 2014; Lakner & Bosse 2016; Lakner et al. 2016).
b) Administrative restrictions
The implementation of EFAs by farmers is controlled by authorities, and might lead to sanctions if rules are broken. For example, there are strict minimum and max-imum widths allowed for buffer strips in Germany (BMEL 2015a). This creates a relatively high risk of repayment or fines due to inaccuracies in the measurement of strip size or width by either farmer or authorities. Thus, although this option is generally economically viable (de Witte & Latacz-Lohmann 2014; Schmidt et al. 2014; Lakner & Bosse 2016; Lakner et al. 2016), the legal restrictions translate into risk-related costs or transaction costs, which partly explain the low uptake of buffer strips and land-scape features.
The low uptake of landscape features can also be ex-plained by property rights. Often, ownership and hence the right to register a feature is unclear, or there can be multiple owners (e.g., Schleyer & Plieninger 2011; Hauck et al. 2016). The exceptionally high uptake of land-scape elements in Schleswig-Holstein may be explained not only by their unusual prevalence, but also by clearly defined land-property rights compared to other German regions. Landscape features in Germany and other coun-tries are also subject to overlapping regulation, such that in many cases landscape features require safeguarding under the cross compliance (CC) rules of Pillar 1 (EC 2009, article 6; 2016a) or the EU’s Habitats Directive. This increases the control risks for farmers, making them reluctant to register, restore, or establish new landscape features.
c) Farmers’ perceptions and knowledge
Traditional land-use and established farming
prac-tices influence EFA decisions. For example, hedges in Schleswig-Holstein (“Knicks”) are part of the traditional farming system and landscape going back into the 18th century (Beyer & Schleuß 1991). Their protection is consequently both pragmatic (as boundary structures) and culturally beneficial (Piorr & Reutter 2002).
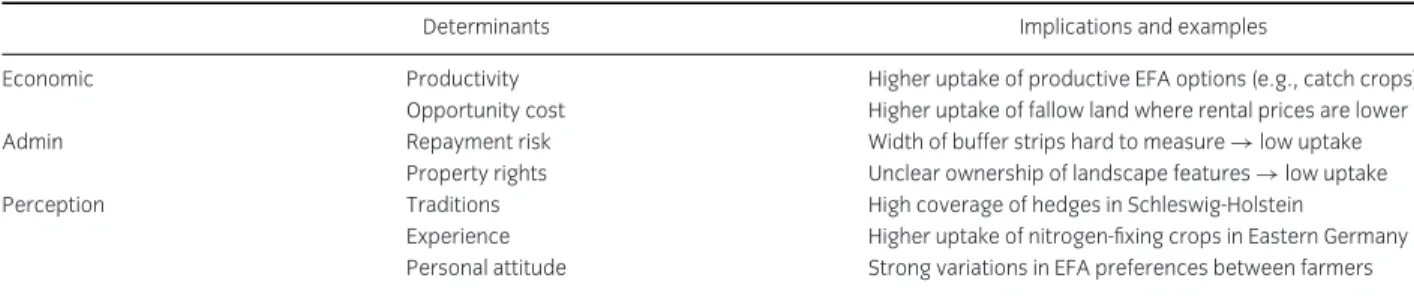
Table 3 Synthesis of expert knowledge on factors influencing farmers’ uptake, with examples for implications and outcomes of these factors
Determinants Implications and examples
Economic Productivity Higher uptake of productive EFA options (e.g., catch crops) Opportunity cost Higher uptake of fallow land where rental prices are lower Admin Repayment risk Width of buffer strips hard to measure→ low uptake
Property rights Unclear ownership of landscape features→ low uptake Perception Traditions High coverage of hedges in Schleswig-Holstein
Experience Higher uptake of nitrogen-fixing crops in Eastern Germany Personal attitude Strong variations in EFA preferences between farmers
and established management experiences can influence farmers’ EFA choices too (Schulz et al. 2014). For in-stance, growing nitrogen-fixing crops such as beans and peas requires specific knowledge and particular harvest-ing equipment. This translates into a higher uptake of these EFA options in Eastern Germany where the climate is suitable for these crops and farmers have more experi-ence and better equipment for implementation.
The perception of “productivity” in land management is another important criterion for EFA decisions, going beyond pure economic reasoning, since many farmers maintain a self-perception as “producers” (Burton et al. 2008; de Snoo et al. 2013; Home et al. 2014), whose pri-mary role is to ensure the provision of food for soci-ety rather than protecting biodiversity. Accordingly, EFA decisions show a clear preference for “productive” EFA options.
Literature concerning the uptake of Agri-Environmental Measures (AEM) and other programs aiming to enhance farmland biodiversity suggests that their uptake, as well as the sense of ownership, are influenced by personal attitudes, subjective norms, and social interaction and control (Burton & Wilson 2006; Defrancesco et al. 2006; Burton et al. 2008; Ahnstr ¨om
et al. 2009; Ahnstr ¨om et al. 2013; Home et al. 2014;
Sulemana & James 2014). For example, Lokhorst et al. (2014) found that a stronger ownership of conservation activities among farmers related to personal connected-ness to nature and a self-perception as conservationists. Additionally, social pressure can influence on decision-making since farmers have an interest in maintaining their fields in a productive and “tidy” status as perceived by their peers and neighbors (Hauck et al. 2016).
Comparison of EFA options and
recommendations for future improvements
We identified one EFA option that is a “win-win” for farmland biodiversity and farmers (fallow land), two “win-lose” options, beneficial for farmland biodiversity but unattractive for farmers (buffer-strips and landscape
features), two “mixed-win” options with limited or unclear benefits for biodiversity but favored by farm-ers (nitrogen-fixing crops and “catch crops and green cover”), two “mixed-lose” options (agroforestry and short-rotation coppice), and one “lose-lose” option (afforested areas) from a perspective of farmland bio-diversity (Table 4). We did not find “lose-win” options (receiving strongly negative scores by ecologists but favored by farmers).
We obtained a total of 895 recommendations to improve the effectiveness of EFA (for a full overview see SI 2). Options with more positive scores received also a greater number of recommendations (n = 70–82 for buffer strips, fallow land, and field margins), while EFA options with lower scores received fewer recommenda-tions (n = 31–42 for short-rotation coppice, afforested areas, and agroforestry). Most recommendations were related to the category “agricultural management” (n = 286), with a general call for setting management specifications (n= 107), limiting the use of agrochem-icals (n = 72), and defining specific harvesting and mowing regimes (n= 52). Within the category “spatial design” (n= 264), the most frequent recommendations were a general call for design and location properties (n = 88), the importance of defining a size or area (n= 63), and the potential benefits of combining buffer strips or landscape elements with other EFA options (n = 42). For the category “vegetation structure and composition” (n = 262), the majority of recommenda-tions called for plant composition (n= 219), specifically mentioning the importance of plant diversity (n = 69), native plants (n = 47), and the support of flowering species (n= 38).
The need to consider the duration of EFA implemen-tation was also mentioned, in particular for fallow land (n= 11).
Discussion
Our study indicates a mismatch between EFA design and implementation, where most EFA options that were
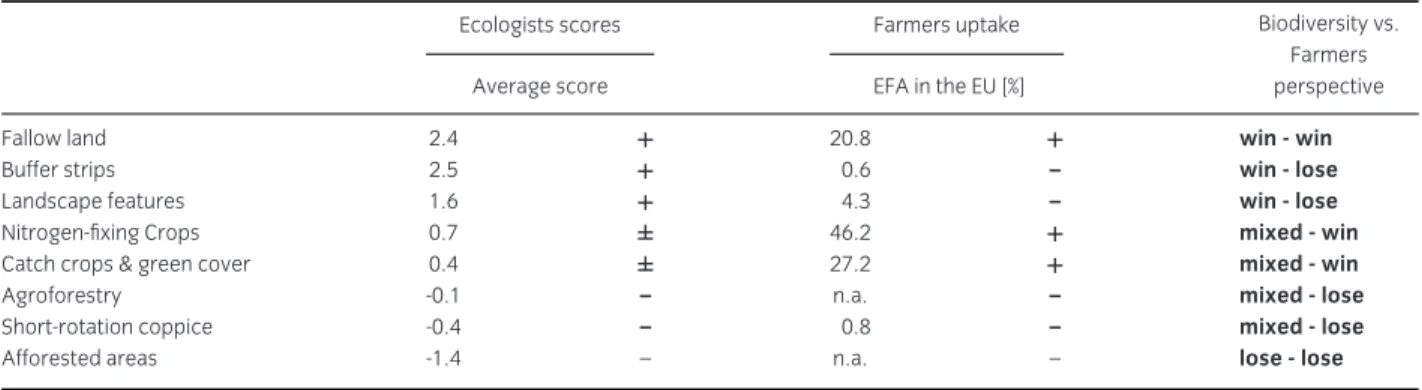
Table 4 Comparison of EFA options according to their score by ecologists (Figure 1) compared to their uptake by farmers (Table 2) as a measure
of attractiveness. We defined an ecological win (+), lose (-) or mixed effects (±) based on the average and 3 quartiles (25, 50, 75%) of their score; while defining win or lose for farmers’ implementation based on the share of the different EFA in the EU
Ecologists scores Farmers uptake Average score EFA in the EU [%]
Biodiversity vs. Farmers perspective
Fallow land 2.4 + 20.8 + win - win
Buffer strips 2.5 + 0.6 – win - lose
Landscape features 1.6 + 4.3 – win - lose
Nitrogen-fixing Crops 0.7 ± 46.2 + mixed - win
Catch crops & green cover 0.4 ± 27.2 + mixed - win
Agroforestry -0.1 – n.a. – mixed - lose
Short-rotation coppice -0.4 – 0.8 – mixed - lose
Afforested areas -1.4 – n.a. – lose - lose
considered beneficial to biodiversity had low uptake among farmers. Moreover, we observed that the pro-portion of EFA surfaces registered were higher than the 5% currently required, with an EU-average of > 10%. Consequently, our study suggests that increasing the required EFA surface from 5% to 7%, as currently discussed in the context of the mid-term review, is unlikely to yield significant improvements in terms of EFAs’ contribution to biodiversity conservation. Instead, efforts should rather focus on improving EFA option design and implementation, considering biodiversity, the determinants of farmers’ decisions, and current obstacles to EFA implementation.
Improving EFA implementation in the current framework: recommendations for the 2017 mid-term review
The upcoming mid-term review of the CAP, scheduled for 2017, can be used to address implementation issues within the current legal framework. Accordingly, we first provide five major recommendations for improving EFA effectiveness for biodiversity within the current regula-tory framework.
(1) Prioritize EFA options with clear benefits for biodi-versity and reduce incentives for less effective ones. This could be achieved by
r
Ensuring that MSs approve effective EFAs:Some EFA options that were scored highly by ecologists were not approved by all MSs (EC 2015a, p. 13). The MSs that did not include fallow land (the only “win-win” option), buffer strips, and especially the four MSs that did not approve landscape features, should be encouraged to revise their decisions.
r
Reconsidering ineffective EFA options: FiveEFA options were found to have mixed or even negative effects on farmland biodiversity. While they may support other environmental objec-tives beyond biodiversity (such as soil retention or carbon sequestration), they need to be em-ployed under careful management criteria, lim-ited to a maximum area at the regional or na-tional level (see, e.g., The Netherlands with 95% catch crops), or even considered for removal to reduce competition with more effective EFA op-tions. This may also help simplifying implemen-tation. We also note that short-rotation coppice, agro-forestry, and afforestation are already pro-moted through other policies including AEMs.
r
Expanding the use of equivalent measures:Equivalent practices have been developed by only five MSs to adapt greening to specific farming systems and environmental priorities, and none has taken a regional approach (Hart 2015). Im-plementation barriers could be reduced through local governance fora, integrating regional knowl-edge, stakeholder interests, and scientific expertise (Dosch & Schleyer 2005).
r
Adapting weighting factors to the ecologicalvalue and implementation costs and benefits of each EFA option: Particularly, the weighting fac-tors for catch crops and green cover and for nitrogen-fixing crops should be reduced as these options are easy to implement with little or no costs, while having unclear or small benefits for biodiversity.
(2) Reduce farmers’ administrative burdens
Reducing administrative burdens could enhance the uptake of EFA options that are otherwise avoided,
such as buffer strips and landscape features (“win-lose”). This could be achieved by:
r
Simplifying technical requirements and re-laxing sanctions: Reducing and simplifying sometechnical requirements of biodiversity supporting EFAs, such as buffer strip widths and landscape feature area calculations, could significantly in-centivize their uptake. Furthermore, sanctions can be relaxed if they emerge from innocent errors, such as mapping mistakes or area miscalculations that may not impede EFA aims.
r
Increasing capacities for administrative sup-port and ecological advice: Stronger supsup-portprovided by authorities would contribute to in-creasing farmers’ confidence in effective EFA op-tions. Particularly, funds are now available for Farm Advisory Systems (FAS) in Pillar 1, but they should be further developed in terms of their capacity to provide ecological knowledge and to communicate the benefits of some EFAs in terms of ecosystem services like erosion control, water quality, pollination, and pest control.
r
Extending the eligible implementation dura-tion of selected EFA opdura-tions: Under thecur-rent legislation, the status of buffer strips and fallow land (if continuously covered by grass-dominated vegetation) may change if imple-mented for more than 5 years, turning from arable to “permanent grassland.” This change of status lowers land prices substantially and is legally dif-ficult to reverse. To avoid these negative conse-quences, farmers usually convert buffer strips and fallow land back to arable land after 5 years, with potential loss of various benefits for biodiversity. Excluding EFA areas from this rule could enhance implementation duration, promote habitat stabil-ity over time, and improve the potential of these EFAs to contribute to landscape connectivity (SI 2; see also Henderson et al. 2000).
(3) Set targeted and clear management requirements Ecological experts provided a wide range of spe-cific recommendations to improve the effectiveness of EFA options (for an overview, see SI 2). No-table recommendations are to restrict the use of
agro-chemicals, and ensure a high diversity of (eligible) plant species while particularly
support-ing flowersupport-ing plants. (4) Combine policy instruments
The protection, restoration, or creation of landscape features and buffer strips can be promoted by
offer-ing top-up payments, for example, through AEMs.
Some German federal states already use additional
EFA-top-up payments with AEMs (see Lakner et al. 2016), albeit still with differing impacts.
(5) Improve transparency of the implementation process The European Commission so far has not published any full or comprehensible dataset on EFA-uptake at the MS level (for example, we used data primarily from coop-erating ministries). Greater transparency, by publishing the implementation data yearly, can promote learning and improvements, as well as cooperation among stake-holders.
A vision beyond 2020
Our workshop discussions brought up five major points which should be considered in the next CAP reform in order to improve both ecological effectiveness and cost-effectiveness (see also Table S4).
(1) Revise exemptions
Currently, farms with less than 15 ha arable land or farms with permanent crops are exempt from EFAs. This exemption should be revisited to improve the ecological effectiveness of EFAs (see Table S4). (2) Reduce windfall-gains to improve cost-effectiveness
Currently, 54% of EU farmers face minimal or no additional costs by these measures (EC 2011, pp. 9, 17), thus functioning as so-called “windfall-gains,” i.e., payments for which no additional effort is taken toward the provision of a related service (in this case, biodiversity conservation). In some cases the pre-mium level is well above the real production costs (or costs incurred), especially for catch crops (de Witte & Latacz-Lohmann 2014; Lakner & Holst 2015; Lakner & Bosse 2016). Consequently, there is much room for better differentiating payments based on actual costs and benefits.
(3) Regionalize EFA design and implementation Our expert survey highlighted an important need to adapt to local EFA settings from both ecological and socio-economic perspectives, by accounting for geo-graphical, societal, and socio-economic specificities, as well as administrative scales (Lehmann et al. 2009; Prager 2015b). Recommendations included the fol-lowing points:
r
Adopt EFA requirements to socio-economic and ecological conditions: Cost-effectiveness isreduced by ignoring the very marginal produc-tion and opportunity costs not only among EFA options but also, for each option, in terms of the immense heterogeneity among farms and farmers across the EU alongside their diversity of interests, motivations, and attitudes toward biodiversity
protection (see, e.g., Schmitzberger et al. 2005; W ¨atzold & Drechsler 2014).
r
Support landscape-targeted and collabora-tive implementation: Experiences from AEMsdemonstrated that landscape-targeted AEMs are more effective (Tscharntke et al. 2005; W ¨atzold & Schwerdtner 2005; Wrbka et al. 2008; Merckx et al. 2009; Bat ´ary et al. 2011; Prager 2015a; Tscharntke
et al. 2015). Similar spatial targeting should be
ap-plied to EFAs. This could be facilitated by local and regional authorities, and supported through Farm Advisory Systems and local governance fora.
r
Reconsider EFA requirement levels at the gional level: The current option for MSs tore-duce the requirement for EFA from 5% to 2.5% in regions with high proportion of forests or pro-tected areas entails that less strict requirements are set for areas where (semi-)natural elements are more abundant and hence, at least from a landscape-ecology perspective, EFAs could be par-ticularly beneficial for biodiversity, for instance, by improving landscape permeability and connec-tivity.
(4) Enhance cooperation between administration, ex-tension services, and farmers
Cooperation between stakeholders can act to in-crease uptake of biodiversity-friendly EFA options and improve their practical implementation. It could be achieved by
r
Adapting administrative structures to enable collective implementation: Collectiveimplementation might provide a range of ad-vantages as farmers can jointly achieve more ambitious targets across spatial and temporal scales and reach critical ecological thresholds such as habitat size (Pe’er et al. 2014b) and connectivity. Yet only two MSs (The Netherlands and Poland) allowed farmers to implement EFAs collectively, providing incentives for contiguous EFAs (Hart 2015); and in 2015, only 45 farmers used this option (EC 2016b, Part 3/6, Annex II, p. 43). These examples demonstrate an underused potential to improve the environmental benefits of EFAs, as well as a need to assess whether collective implementation can indeed achieve its desired impacts.
r
Promoting integrative and participatory approaches: By supporting integrative andpar-ticipatory conservation planning, platforms for knowledge exchange and local governance fora, the EU and MSs can promote synergies between sectoral interests, cooperation among
stakehold-ers, and more (cost-)effective use of knowledge (Dosch & Schleyer 2005). Furthermore, bottom-up initiatives can help achieve desired ecolog-ical and socio-economic goals that may oth-erwise seem administratively unfeasible (Prager 2015a,b).
(5) Enhance policy integration
Policy integration (sensu Runhaar et al. 2014) of all three greening measures will need to be carefully in-spected in the next negotiations of the CAP regarding the EC’s commitment to Policy Coherence for De-velopment (PCD, EC 2015b), as well as CBD Aichi target 3 which requires signatory bodies to eliminate incentives harmful to biodiversity. Particularly, we recommend to:
r
Integrate the CAP with existing policies for farmland biodiversity conservation:Re-cent assessments demonstrate limited coherence of the CAP with the Habitats and Birds Directives (Milieu et al. 2015). We further recommend in-specting its coherence with the EU’s Green Infras-tructure Strategy (European Parliament 2013).
r
Ensure that none of the greening measures supports biodiversity deterioration: The permanent-grassland greening measure focuses on quantity while lacking quality requirements. The crop-diversification measure allows reducing the number of crops without meeting the thresh-old requirement of two or three crops (Pe’er et al. 2014a). Moreover, closer monitoring should be employed to ensure that (semi-)natural habitats do not deteriorate under the greening measures.r
Use experiences from AEM implementation:Overall, there is much room to use the experi-ences acquired in the application of AEMs within Pillar 2. Voluntary financial incentives, such as those provided by AEMs, often work better than regulatory mechanisms (Henle et al. 2008) and can be linked to result-based mechanisms that have been tested with some success (de Snoo et al. 2013). Overall, given the experiences and tools already existing in Pillar 2 AEMs, and consider-ing the budget decline for Pillar 2 in the last CAP reform, the next reform should focus on restor-ing and even expandrestor-ing Pillar 2, and within it the share of budgets earmarked for protecting biodiversity.
Acknowledgments
We are grateful to the more than 100 ecologists, agronomists, and other experts who participated in our
workshops and responded to our survey. This project de-veloped through the support of “Synthesis projects” at the UFZ. Guy Pe’er also acknowledges financial support from the FP7 project EU BON. Cl ´elia Sirami acknowledges funding by the FarmLand project, funded by the ERA-Net BiodivERsA under the French National Research Agency (ANR-11-EBID-0004), the German BMBF & DFG, and the Spanish Ministry of Economy and Competitiveness. Stefan Schindler was partly supported by the grant FPA EEA/NSV/14/001 ETC/ULS. We thank Tibor Hartel and Amanda Sahrbacher for constructive comments on this manuscript.
Supporting Information
Additional Supporting Information may be found in the online version of this article at the publisher’s web site:
Table S1: Respondents’ profile according to (a)
country, taxonomic group of expertise, years of experi-ence and (b) source of expertise.
Table S2: Type of recommendations and the number
of experts making them, accompanied by an explanation of the content and/or the recommendation itself.
Table S3: Type of recommendations, and number of
experts making them, (a) for each EFA option and (b) for each type of landscape feature.
Table S4: Synthesis of recommendations provided, by
participants at the Round Table Discussion at the ICCB-ECCB conference in Montpellier.
Table S5: Area and share of registered ecological focus
area across federal states in Germany, weighted according the legal weighting factors (in hectares).
References
Ahnstr ¨om, J., Bengtsson, J., Berg, ˚A., Hallgren, L., Boonstra, W.J. & Bj ¨orklund, J. (2013). Farmers’ interest in nature and its relation to biodiversity in arable fields. Int. J. Ecol. 2013, Article ID 617352.
Ahnstr ¨om, J., H ¨ockert, J., Berge ˚a, H.L., Francis, C.A., Skelton, P. & Hallgren, L. (2009). Farmers and nature conservation: what is known about attitudes, context factors and actions affecting conservation? Renew. Agric. Food Syst., 24, 38. Ajzen, I. (1991). The theory of planned behavior. Organ.
Behav. Hum. Decis. Process., 50, 179-211.
Bat ´ary, P., Andras, B., Kleijn, D. & Tscharntke, T. (2011). Landscape-moderated biodiversity effects of
agri-environmental management: a meta-analysis. Proc.
Biol. Sci., 278, 1894-1902.
Beyer, L. & Schleuß, U. (1991). The soils of wall-hedges in Schleswig-Holstein – classification and genesis (in German). Z. Pflanzenern ¨ahrung Bodenkunden, 154, 431-436.
BMEL. (2015a). Implementation of the agricultural reform in
Germany 2015 (Government Brochure, in German). German
Ministry for Food and Agriculture (BMEL), Berlin, Germany.
BMEL (2015b). Reply of the German Ministry for Food and Agriculture to the German Parliament to a formal request of Parliament Member Dr. K. Tackmann, October 2015, Bundestags-Document No. 18/6529. German Ministry for Food and Agriculture (BMEL), Berlin, Germany.
Burton, R.J.F., Kuczera, C. & Schwarz, G. (2008). Exploring farmers’ cultural resistance to voluntary
agri-environmental schemes. Sociologia Ruralis, 48, 16-37. Burton, R.J.F. & Wilson, G.A. (2006). Injecting social
psychology theory into conceptualisations of agricultural agency: towards a post-productivist farmer self-identity?
Journal of Rural Studies, 22, 95-115.
de Snoo, G.R., Herzon, I., Staats, H., et al. (2013). Toward effective nature conservation on farmland: making farmers matter. Conservation Letters, 6, 66-72.
de Witte, T. & Latacz-Lohmann, U. (2014). Was kostet das Greening? Top Agrar, 4, 36-41.
Defrancesco, E., Gatto, P., Runge, F. & Trestini, S. (2006). Factors affecting farmers’ participation in
agri-environmental measures: evidence from a case study.
10th Joint Conference on Food, Agriculture and the Environment.
Duluth, Minnesota.
Destatis (div. years): Arable production in Germany (in German), Series 3.1.2, Federal Statistical Office (Destatis), Wiesbaden, Germany, Volumes 2005, 2007-2016. Dicks, L.V., Hodge, I., Randall, N., et al. (2014). A transparent
process for ‘evidence-informed’ policy making. Conserv.
Lett., 7, 119-125.
Dosch, A. & Schleyer, C. (2005). Transdisciplinary approaches in natural resource management: the case of an
agri-environmental forum in Brandenburg (Germany).
Zeitschrift f ¨ur angewandte Umweltforschung (ZAU), 17, 65-79.
EEA. (2015). State of nature in the EU. Results from reporting
under the nature directives 2007–2012, Technical report No
02/2015. p. 178 pp. European Environment Agency, Copenhagen.
EC (European Commission). (2009). Council regulation (EC) No.
73/2009 of 19 January 2009 establishing common rules for direct support schemes for farmers under the common agricultural policy and establishing certain support schemes for farmers. European
Union, Brussels.
EC (European Commission). (2011). Impact assessment:
Common Agricultural Policy towards 2020 ANNEX 2D,
Commission Staff Working Paper, 20.10.2011 SEC (2011) 1153 final/2. European Union, Brussels, Belgium.
EC (European Commission). (2013a). CAP reform - an
explanation of the main elements. European Commission,
Brussels, Belgium.
EC (European Commission). (2013b). Regulation (EU) No
December 2013 establishing rules for direct payments to farmers under support schemes within the framework of the common agricultural policy and repealing Council Regulation (EC) No 637/2008 and Council Regulation (EC) No 73/2009. European
Commission, Brussels, Belgium.
EC (European Commission). (2014). Commission Delegated
Regulation (EU) No 639/2014 of 11 March 2014, supplementing Regulation (EU) No 1307/2013 of the European Parliament and of the Council establishing rules for direct payments to farmers under support schemes within the framework of the common agricultural policy and amending Annex X to that Regulation.
European Union, Brussels, Belgium.
EC (European Commission). (2015a). Direct payments post 2014
Decisions taken by Member States by 1 August 2014 - State of play on 07.05.2015 - Information note. European Commission,
Brussels, Belgium.
EC (European Commission). (2015b). Commision staff working
document: Policy Coherence for Development. 2015 EU Report,
SWD(2015) 159 final. European Commission, Brussels, Belgium.
EC (European Commission). (2016a). Glossary of terms related
to the Common Agricultural Policy. European Union, Brussels,
Belgium.
EC (European Commission). (2016b). Review of Greening after
one year, Commission staff working document from June 22, 2016, SWD (2016) 218 final. European Commission, Brussels,
Belgium.
EC (European Commission). (2016c). Special Eurobarometer 440: Europeans, Agriculture and the CAP. Survey requested
by the European Commission, Directorate-General for
Agriculture and Rural Development and co-ordinated by the Directorate-General for Communication, Brussels, Belgium.
European Council. (2015). Draft Council conclusions on the
Simplification of the Common Agriculture Policy, Document 7524/2/15 REV 2. European Council, Brussels, Belgium.
Hart, K. (2015). Green direct payments: implementation choices of
nine Member States and their environmental implications. IEEP,
London, UK.
Hauck, J., Schmidt, J. & Werner, A. (2016). Using social network analysis to identify key stakeholders in
agricultural biodiversity governance and related land-use decisions at regional and local level. Ecology and Society, 21(2):49, http://dx.doi.org/10.5751/ES-08596-210249. Accessed November 1, 2016.
Heinrich, B. (2012). Calculating the ‘Greening’-effect – a case study approach to predict the gross margin losses in different farm types in Germany due to the reform of the CAP. Discussion paper 1205 of the Department of Agricultural
Economics and Rural Development. Georg-August-University
G ¨ottingen, G ¨ottingen, Germany.
Henderson, I.G., Cooper, J., Fuller, R.J. & Vickery, J. (2000). The relative abundance of birds on set-aside and
neighbouring fields in summer. J. Appl. Ecol., 37, 335-347.
Henle, K., Alard, D., Clitherow, J. et al. (2008). Identifying and managing the conflicts between agriculture and biodiversity conservation in Europe - A review. Agric.
Ecosyst. Environ., 124, 60-71.
Hodge, I., Hauck, J. & Bonn, A. (2015). The alignment of agricultural and nature conservation policies in the European Union. Conserv. Biol., 29, 996-1005.
Home, R., Balmer, O., Jahrl, I., Stolze, M. & Pfiffner, L. (2014) Motivations for implementation of ecological compensation areas on Swiss lowland farms. J. Rural Stud., 34, 26-36. Isermeyer, F., Forstner, B., Nieberg, H. et al. (2014).
Stellungnahme im Rahmen einer ¨offentlichen Anh ¨orung des Ausschusses f ¨ur Ern ¨ahrung und Landwirtschaft des Deutschen Bundestages am 7. April 2014.
Lakner, S. & Bosse, A. (2016). M ¨uhsames Abw ¨agen (Zur ¨okologische Vorrangfl ¨ache in Sachsen-Anhalt in German).
Bauernzeitung, 10, 50-51.
Lakner, S. & Holst, C. (2015). Farm implementation of greening requirement: economic determinants (in German). Natur und Landschaft, 90, 271-277.
Lakner, S., Schmitt, J., Schüler, S. & Zinngrebe, Y. (2016). Naturschutzpolitik in der Landwirtschaft: Erfahrungen aus er Umsetzung von Greening und der ¨okologischen Vorrangfl ¨ache 2015. Conference of the German Association of
Agricultural Economists (Gewisola), Bonn.
Lange, A., Siebert, R. & Barkmann, T. (2015). Sustainability in land management: an analysis of stakeholder
perceptions in rural northern Germany. Sustainability, 7, 683-704.
Lehmann, P., Schleyer, C., W ¨atzold, F. & W ¨ustemann, H. (2009). Promoting multifunctionality of agriculture: an economic analysis of new approaches in Germany. Journal
of Environmental Policy & Planning, 11, 315-332.
Lokhorst, A.M., Hoon, C., le Rutte, R. & de Snoo, G. (2014). There is an I in nature: the crucial role of the self in nature conservation. Land Use Policy, 39, 121-126.
Maxwell, S., Fuller, R., Brooks, T. & Watson, J. (2016). Biodiversity: the ravages of guns, nets and bulldozers.
Nature, 536, 143.
Merckx, T., Feber, R.E., Riordan, P., et al. (2009). Optimizing the biodiversity gain from agri-environment schemes.
Agriculture Ecosystems & Environment, 130, 177-182.
Milieu, L., IEEP, ICF˙International & Ecosystems, L. (2015).
Evaluation Study to support the Fitness Check of the Birds and Habitats Directives. Draft - Emerging Findings. p. 68. Milieu
Ltd., Brussels, Belgium.
Oppermann, R. (2015). ¨Okologische Vorrangfl ¨achen – Optionen der praktischen Umsetzung aus Sicht von Biodiversit ¨at und Landwirtschaft. Natur und Landschaft, 90, 263-270.
Pe’er, G., Dicks, L.V., Visconti, P., et al. (2014a). EU agricultural reform fails on biodiversity. Science, 344, 1090-1092.
Pe’er, G., Tsianou, M.A., Franz, K.W. et al. (2014b). Toward better application of minimum area requirements in conservation planning. Biological Conservation, 170, 92-102. Piorr, H.-P. & Reutter, M. (2002). Linear Landscape Elements as
Agricultural Environmental Indicators (in German).
Fachhochschule Eberswalde, Eberswalde, Germany. Prager, K. (2015a). Agri-environmental collaboratives as
bridging organisations in landscape management. J.
Environ. Manage., 161, 375-384.
Prager, K. (2015b). Agri-environmental collaboratives for landscape management in Europe. Curr. Opin. Environ.
Sustainability, 12, 59-66.
Runhaar, H., P. Driessen, and C. Uittenbroek. 2014. Towards a systematic framework for the analysis of environmental policy integration. Environmental Policy and Governance 24, 233-246.
Schleyer, C. & Plieninger, T. (2011). Obstacles and options for the design and implementation of payment schemes for ecosystem services provided through farm trees in Saxony, Germany. Environ. Conserv., 38, 454-463.
Schmidt, T., Röder, N., Dauber, J., et al. (2014)
Biodiversitätsrelevante Regelungen zur nationalen Umsetzung des Greenings der Gemeinsamen Agrarpolitik der EU nach 2013.
Th ¨unen Istitute for Agricultural Research, Working, Braunschweig, Germany.
Schmitzberger, I., Wrbka, T., Steurer, B., Aschenbrenner, G., Peterseil, J. & Zechmeister, H.G. (2005). How farming styles influence biodiversity maintenance in Austrian agricultural landscapes. Agric. Ecosyst. Environ., 108, 274-290.
Schulz, N., Breustedt, G. & Latacz-Lohmann, U. (2014). Assessing farmers’ willingness to accept “greening”: insights from a discrete choice experiment in Germany. J.
Agric. Econ., 65, 26-48.
Sulemana, I. & James, H.S. (2014). Farmer identity, ethical attitudes and environmental practices. Ecol. Econ., 98, 49-61.
Sutherland, W.J., Dicks, L.V., Ockendon, N. & Smith, R.K., editors. (2015). What works in conservation. Open Book Publishers, Cambridge, UK.
Tscharntke, T., Klein, A.M., Kruess, A., Steffan-Dewenter, I. & Thies, C. (2005). Landscape perspectives on agricultural intensification and biodiversity - ecosystem service management. Ecol. Lett., 8, 857-874.
Tscharntke, T., Milder, J.C., Schroth, G., et al. (2015). Conserving biodiversity through certification of tropical agroforestry crops at local and landscape scales. Conserv.
Lett., 8, 14-23.
Van der Ploeg, J.D. (1994). Styles of farming: an introductory note on concepts and methodology. Pages 7-30 in J.D. van der Ploeg & A. Long, editors. Born from within: practice and
perspectives of endogenous rural development. Van Gorcum,
Assen, the Netherlands.
W ¨atzold, F. & Drechsler, M. (2014). Agglomeration payment, agglomeration bonus or homogeneous payment? Resour.
Energy Econ., 37, 85-101.
W ¨atzold, F. & Schwerdtner, K. (2005). Why be wasteful when preserving a valuable resource? A review article on the cost-effectiveness of European biodiversity conservation policy. Biol. Conserv., 123, 327-338.
Wrbka, T., Schindler, S., Pollheimer, M., Schmitzberger, I. & Peterseil, J. (2008) Impact of the Austrian
Agri-Environmental Scheme on diversity of landscape, plants and birds. Community Ecol., 9, 217-227.
Zinngrebe, Y., Pe’er, G., Schueler, S., Schmitt, J., Schmidt, J. & Lakner, S. (submitted) The EU’s Ecological Focus Areas – explaining farmers’ choices in Germany.