HAL Id: hal-01436502
https://hal.archives-ouvertes.fr/hal-01436502
Submitted on 16 Jan 2017
HAL is a multi-disciplinary open access
archive for the deposit and dissemination of
sci-entific research documents, whether they are
pub-lished or not. The documents may come from
teaching and research institutions in France or
abroad, or from public or private research centers.
L’archive ouverte pluridisciplinaire HAL, est
destinée au dépôt et à la diffusion de documents
scientifiques de niveau recherche, publiés ou non,
émanant des établissements d’enseignement et de
recherche français ou étrangers, des laboratoires
publics ou privés.
Blind roll-off estimation for digital transmissions
Nathalie Thomas, Jean-Yves Tourneret, Emmanuel Bourret
To cite this version:
Nathalie Thomas, Jean-Yves Tourneret, Emmanuel Bourret. Blind roll-off estimation for digital
trans-missions. Signal Processing, Elsevier, 2016, vol. 135, pp. 87-95. �10.1016/j.sigpro.2016.12.013�.
�hal-01436502�
O
pen
A
rchive
T
OULOUSE
A
rchive
O
uverte (
OATAO
)
OATAO is an open access repository that collects the work of Toulouse researchers and
makes it freely available over the web where possible.
This is an author-deposited version published in :
http://oatao.univ-toulouse.fr/
Eprints ID : 17414
To link to this article : DOI:10.1016/j.sigpro.2016.12.013
URL :
http://dx.doi.org/10.1016/j.sigpro.2016.12.013
To cite this version : Thomas, Nathalie and Tourneret, Jean-Yves and
Bourret, Emmanuel Blind roll-off estimation for digital transmissions.
(2016) Signal Processing, vol. 135. pp. 87-95. ISSN 0165-1684
Any correspondence concerning this service should be sent to the repository
administrator:
[email protected]
Blind roll-o
ff estimation for digital transmissions
Nathalie Thomas
a,⁎, Jean-Yves Tourneret
b, Emmanuel Bourret
baUniversity of Toulouse, IRIT/ENSEEIHT/TéSA, Toulouse, France bThales Alenia Space, Toulouse, France
A B S T R A C T
This paper addresses the problem of estimating the roll-off factor of a received communication signal. We study two new statistical estimation methods that determine the roll-off factor by minimizing the difference between the theoretical and empirical power or power spectral density of the received signal. Another interesting contribution is the derivation of the roll-off Cramér–Rao bound which provides a reference in terms of estimation variance. Simulation results conducted on synthetic data allow the performance of the proposed methods to be evaluated. They are compared to a recent technique based on the amplitudefluctuations of the power spectral density associated with the received communication signal. The estimation methods are shown to be robust to channel impairments (including white Gaussian noise and synchronization errors). The proposed strategies arefinally tested on real signals with known ground truth showing their possible application to digital communication problems.
1. Introduction
Linear and nonlinear digital modulation classification has received a lot of attention in the literature. Several classification rules based on the maximum likelihood method[29,9,20,8,11,4,15]or on appropriate features[22,10,24,5,13,21] extracted from the received communica-tion signal have been investigated. The robustness of the resulting classifiers to synchronization errors or channel impairments has also been studied[2,30]. However, in order to classify digital modulations efficiently, the receiver has to know or has to estimate some key parameters associated with the transmitted communication signal. These key parameters include the symbol rate and the shaping filter roll-off factor. Their imperfect knowledge decreases the performance of any digital modulation classifier. Estimating the symbol rate of a communication signal has received much attention in the literature. For instance, several symbol rate estimators take advantage of the cyclostationarity of communication signals[6,12]. This paper focuses on the roll-off estimation problem for classical transmission systems which are based on linear modulations relying on square root raised cosine (SRRC) shaping. To our knowledge, the only available roll-off estimation method is based on the waveform of the received signal
[26]. This may be explained by the negligible impact of roll-off
mismatched factors on the BER (see [18] or [27]). However, the performance of a digital modulation classifier is affected by a roll-off estimation error. Indeed, a roll-off error induces some noise enhance-ment (ISI introduced because the Nyquist criterion is no longer
fulfilled) and some reduction in the power of the useful signal (absence of matchedfiltering). This impact is particularly significative for new high order constellations.Fig. 1shows an example of a possible high order transmitted constellation (32-APSK, in DVB-S2 standard[1]).
Fig. 2shows how this constellation can be disturbed when the receiver
roll-off factor is different compared to the transmitter's one (transmit-ter roll-off =0.7, receiver roll-off =0.2), especially in the presence of other impairments such as noise or errors on the carrier frequency. The ISI due to the fact that the Nyquist criterion is no longer fulfilled and the reduction in SNR due to the absence of matchedfiltering lead to increase the degradations in the received signal and further disturb the digital modulation classification process.
Another advantage of estimating accurately the roll-off factor is spectrum supervision. In that case, it permits to check whether the transmitter uses an authorized roll-off or not. As an example, Thales Alenia Space offers end-to-end solutions for satellite frequency mon-itoring and interception, for satellite operators, national regulatory or defence agencies. In these solutions, the carrier detection and char-acterization relies on the Thales product referred to as telecom carrier analyzer (TCA). The TCA provides a large number of features, such as RF parameters (power, bandwidth, etc), digital characterization (mod-ulation, symbol rate, inner and outer codes, etc.), from blind carrier detection to inside carrier characterization. Roll-off estimation is an interesting parameter that could be added to this list, allowing better classification performance to be obtained. Moreover, this parameter is directly related to the occupied bandwidth of the received
communica-http://dx.doi.org/10.1016/j.sigpro.2016.12.013
⁎Corresponding author.
tion signal, which allows this bandwidth to be estimated, which is important in non-cooperative scenarios. Indeed, to increase their bit error rates some transmitters can use more than the authorized bandwidth by modifying the roll-off factor, generating some cross-talk. Estimating the spectral bandwidth accurately is a way of identifying these transmitters, which requires to estimate the symbol rate and the roll-off factor of the received communication signal.
This paper studies two new roll-off estimation methods that have some clear advantages with respect to the method studied in [26], which will be used as a benchmark for our study. It is organized as follows.Section 2presents a model of the received baseband commu-nication signal including some practical channel impairments.Section 3analyzes the impact of a roll-off mismatch on the BER. Section 4
studies the first proposed estimation method based on the power spectral density (PSD) of the received signal.Section 4also introduces a second method based on the power of the received communication
signal.Section 5derives the modified Cramer Rao bound (MCRB)[7]
for the roll-off estimation problem. The MCRB provides a reference in terms of mean square error (MSE) for any unbiased estimator of a given parameter. It is used here to evaluate the optimal performance of roll-off estimators. Simulation results presented inSection 6allow one to appreciate the performance of the proposed methods with respect to
[26]. The robustness of the proposed algorithms to carrier phase and frequency errors is also investigated. Simulations performed on real satellite signal measurements (provided by Thales Alenia Space)finally show the applicability of the proposed methods to real scenarios. Conclusions and future works are reported inSection 7.
2. Signal model
Consider an additive white Gaussian noise (AWGN) channel resulting from the forward link of afixed broadband satellite system. The complex envelope r(t) associated with a received communication signal can be written as
r t( ) = ( ) +s t n t( )
where n(t) is the complex envelope (or equivalent low-pass signal) of the incoming noise of power spectral density N /20 and s(t) denotes
the complex envelope of the incoming communication signal. In the presence of synchronization impairments, s(t) can be written as
∑
s t( ) = d h t( −kT− )τ e k k s j(2 Δ + )π ft ϕ (1) where•
{ }dk is the complex data symbol sequence (supposed to be zeromean, independent and identically distributed (i.i.d.)),
•
h(t) is the impulse response of the emissionfilter,•
Tsis the symbol duration,ϕ•
andΔf are the carrier phase and the carrier frequency errors,τ•
denotes the clock phase error.A communication system based on linear modulations relying on square root raised cosine (SRRC) shaping is considered in this paper. The resulting shapingfilter impulse response is defined as
h t α α πtR α πtR αtR π αtR R ( ) = 4 cos[(1 + ) ] + sin[(1 − ) ] 4 [1 − (4 ) ]/ s s s s2 s (2)
whereα represents the roll-off parameter defining the shaping filter and Rs= 1/Ts is the symbol rate. As mentioned before, in order to
simultaneously avoid interference between the transmitted symbols and minimize the bit error rate, the same SRRCfilters have to be used at the transmitter and at the receiver. Consequently, the receiver has to know a priori the roll-off parameter α of the SRRC filter. When this knowledge is not available, this parameter can be estimated from the received communication signal r(t). Before addressing this estimation problem, the next section studies the impact of a roll-off mismatch on the transmission.
3. Impact of a roll-off mismatch on the bit error rate This sectionfirst recalls the theoretical expression of the BER for a Gaussian channel, without synchronization errors (i.e., ϕ= Δ =f τ= 0) with the same SRRCfilters at the transmitter and the receiver. The impact of a roll-off mismatch between the transmitter and the receiver on the BER is then analyzed.
3.1. BER for an ideal AWGN channel
When the transmitter and receiver filters have the same roll-off factor, the Nyquist criterion ensuring interference free transmission is
Fig. 1. Transmitted 32-APSK constellation.
fulfilled. As a consequence, the received symbols after matched filtering and sampling is[19]
d∼m=d g tm ( ) +0 wm (3)
where
•
the sampling instants t0+mTs are chosen in order to avoid intersymbol interference (ISI),
•
g t( ) =h t( )*h tr( )is the impulse response of the global transmission channel, where h(t) and hr(t) are the impulse responses of thefiltersassociated with the transmitter and the receiver
•
wmis a complex Gaussian noise with variance2σ2(σ2denotes thevariance of the real and imaginary complex noise components). The expression of the BER is well known in this scenario. For example, considering a squared M-QAM modulation
dk=ak+jbk, ak,bk∈ { ± , ± 3V V, …, ± M V} the symbol error rate (SER) is given by[19]
⎛ ⎝ ⎜ ⎞⎠⎟ ⎡⎣⎢ ⎤⎦⎥ M Q V g t σ SER = 4 1 − 1 ( )0 (4) where Q (.) denotes the complementary cumulative distribution func-tion (CCDF) of a standard Gaussian random variable. When thefilter used by the receiver is identical to thefilter used by the transmitter, the following results can be obtained
∫
σ2=N0 H fr( ) df=N g t( ) =N, −∞ ∞ 2 0 0 0 (5)where Hr(f) is the receiverfilter transfer function. Note that
∫
E =E log (M) = σ H f df σ g t σ 2 ( ) = 2 ( ) = 2 s b 2 d d d 2 −∞ ∞ 2 2 0 2where Esand Ebare the averaged symbol and bit energies, andσd2
is the symbol variance. When using a Gray mapping, this leads to the following classical BER expression:
⎛ ⎝ ⎜ ⎞⎠⎟ ⎛ ⎝ ⎜⎜ ⎞ ⎠ ⎟⎟ M M Q M M E N BER ≈ 4 log ( ) 1 − 1 3 log ( ) − 1 . b 2 2 0 (6)
3.2. Impact of a roll-off mismatch
When the transmitter and receiverfilters do not have the same roll-off factor,(3)has to be replaced by
∑
d∼m=d g tm ( ) + d g t[ + ( −k m T) ] +w k m k s m 0 ≠ 0 (7) where ∑k m≠ d g tk [0+ ( −k m T) ]s is an interference term that has notbeen canceled because the transmission channel no longer satisfies the Nyquist criterion. It is interesting to note that the BER associated with
(7) has increased when compared to the BER resulting from (3)
because of ISI.
When the number of samples in the right hand side of (7) is sufficiently large, the central limit theorem can be used to assume that
∑
d g t[ + ( −k m T) ] k m k s ≠ 0 (8) is an additional complex Gaussian noise with variance 2σISI2, σISI2denoting the variance of the real and imaginary complex ISI compo-nents. The BER degradation due to roll-off mismatch can then be quantified by evaluating the variance of the additional term(8)due to ISI. For instance, considering squared M-QAM modulations, the SER can be expressed as follows:
⎛ ⎝ ⎜ ⎞⎠⎟ ⎛⎝⎜ ⎞⎠⎟ M Q V g t σ SER = 4 1 − 1 ( ) a 0 (9) with σa2=σ2+σISI2 . Due to roll-off mismatch (or equivalently to
unmatchedfiltering), the following result is obtained (g t( ) ≠ 10 here)
⎛ ⎝ ⎜ ⎞⎠⎟ ⎛ ⎝ ⎜ ⎜ ⎜ ⎜ ⎜ ⎞ ⎠ ⎟ ⎟ ⎟ ⎟ ⎟ M M Q M M E N g t σ N BER ≈ 4 1 − 1 log ( ) 3 log ( ) − 1 ( ) 1 + . b 2 2 0 0 ISI2 0 (10)
Comparing expressions(10) and (16), the degradation on the BER (expressed in decibels) due to the roll-off error can be written as
⎛ ⎝ ⎜ ⎜ ⎜ ⎜ ⎜ ⎞ ⎠ ⎟ ⎟ ⎟ ⎟ ⎟ D g t σ N (dB) = 10 log ( ) 1 + 10 0 ISI2 0 (11)
where σISI2 can be easily computed for independent symbols as follows
∑
σ = σ g t k m T 2 [ + ( − ) ]. d k m s ISI2 2 ≠ 2 0 (12) 4. Roll-off estimationThe previous section has analyzed the impact of a roll-off mismatch on the performance of a communication system. This section studies different roll-off estimation methods. The accurate knowledge of the roll-off factor allows the effect of the ISI term (outlined in the previous section) to be mitigated, but can also be used to improve the signal bandwidth estimation. Indeed, bandwidth estimation, which is an important parameter for spectrum supervision, is currently achieved by estimating the symbol rate Rsand by using the following estimator Bl= (1 +α Re)ms
which assumes that the roll-off of the emission filter, αe, is known. In
practical estimations where the parameter αe is unknown, it is
interesting to design roll-off estimation methods. This problem has received few attention in the literature. A spectral technique was investigated in[26], based on the PSD of the received communication signal. The inverse fast Fourier transform of this PSD has a raised cosine pulse shape whose amplitudefluctuations are related to the roll-off factor. The authors of[26]proposed to use the ratio between the main andfirst secondary lobe amplitudes of this raised cosine shape for roll-off estimation. However, we have observed that this method suffers from noise and other channel impairments like synchronization errors. This section introduces two new roll-off estimation methods based on the spectrum and the power of the received communication signal. These methods are then compared with the method of[26]inSection 6
(in terms of performance and robustness to synchronization errors). 4.1. Estimation method based on the received signal PSD
If the transmitted signal shaping is an SRRC, the roll-off parameter of the emission filter can be estimated by minimizing the distance between the estimated PSD of the complex envelope of r(t) denoted as Sr(f) and its theoretical expression S f α( , e), i.e.,
∫
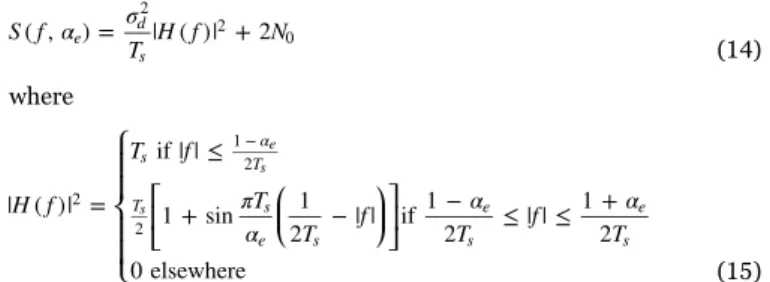
α = arg min [S( ) −f S f α( , )]df. α r e PSD −∞ ∞ 2 e l (13) This method differs from the one proposed in[26]by the fact that the spectrum is directly used instead of the amplitudes of the two maintime response raised cosine lobes. For a zero mean i.i.d. complex symbol sequence and AWGN channel, the PSD of the received communication signal complex envelope is known to be[19]
S f α σ T H f N ( , e) = d| ( )| + 2 s 2 2 0 (14) where ⎧ ⎨ ⎪ ⎪ ⎩ ⎪ ⎪ ⎡ ⎣ ⎢ ⎛ ⎝ ⎜ ⎞⎠⎟⎤ ⎦ ⎥ H f T f πT α T f α T f α T | ( )| = if | | ≤ 1 + sin 1 2 − | | if 1 − 2 ≤ | | ≤ 1 + 2 0 elsewhere s α T T s e s e s e s 2 1 − 2 2 e s s (15) when using an SRRC pulse shaping. Note that the PSD Sr(f) will be
estimated using a Welch periodogram[23], that N0is assumed to be
known and that the optimization method used to solve (13) is the Nelder–Mead (NM) method[14]. The NM method is a simplex method whose efficiency has been proved in many applications. The main idea is to build a sequence of simplices (polytopes of n + 1 vertices in n dimensions) by simple operations such as reflections, expansions, contractions or shrinks in order to approximate the minimum of the objective function (see[16]for more details).Table 1presents the time it takes to classify a modulation for different numbers Nsof samples.
This classification does not need to be made in real time. However, the decision has to be taken as fast as possible, which is satisfactory for Ns=10,000 observed symbols.
4.2. Estimation based on the received signal power
The method considered in this sectionfilters the received commu-nication signal by an SRRCfilter. If the roll-off parameter of this filter matches the roll-off of the transmitter, the received symbols after matchedfiltering and sampling can be written as in(3)and no longer as in(7). The interference term is canceled (due to the fact that the Nyquist criterion is fulfilled, see [25, pp. 556–557]) and the power of the useful term is maximized (due to matchedfiltering, see [25, pp. 236–242]). This section studies a roll-off estimator taking advantage of this property. More precisely, using (7), the power of the received signalfiltered by an SRRC filter with roll-off factor αrand sampled at t0+mTsis
P α t( r| ,0 σ2) =E d[|∼m| ] =2 σ g td2 2( ) + 20 σISI2 + 2σ2 (16)
where the interference and useful terms depend on αrthrough the
expression of the impulse response g(t). Fig. 3 displays a typical evolution of the power P α t σ( r| ,0 2)as a function ofαrfor a given value
of the transmitter roll-off α = 0.35e . Thisfigure shows that the power at
the output of the receiver SRRCfilter is maximum (due to matched filtering) forαr=αe.
Based on(16), an estimator ofαecan be defined as follows α = arg maxP α t( | ,σ ) α r P 0 2 r l (17) provided that t0is known. The absence of knowledge about t0can be
alleviated by using the following roll-off estimation procedure. 1. Sample the received signal at rate 2 Rsin order to fulfill the sampling
Nyquist criterion. Note that there are several techniques that can be used for the blind estimation of the symbol rate. The method proposed in[12]has been considered here for its simplicity. 2. Estimate the optimal sampling instants using the method described
in[17], leading to t^0.
3. Estimateαeby maximizing(16)after replacing t0by its estimator,
i.e., α = arg maxP α t( |^ ,σ). α r P 0 2 r l (18) Again, the optimization method used to solve(18)is the Nelder–Mead method.
5. Cramer–Rao Bound for the roll-off estimation problem In order to obtain a reference in terms of estimation variance, it is usual to determine the Cramer–Rao bound associated with the para-meters to be estimated. This section derives bounds for the estimation of the roll-off factor αe. As explained before, in the presence of
synchronization errors, the received signal depends on the roll-off factor but also on parameters related to synchronization impairments (classically referred to as unwanted or nuisance parameters). These parameters include the clock phase errorτ and the residual carrier frequency and phaseΔf andϕ. Because of the presence of nuisance parameters and also because the complex data symbols belong to a finite alphabet, the exact Cramer–Rao bound associated with the parameters contained in the received communication signal cannot be computed in closed form. A classical way of solving this problem is to consider the following modified Cramer–Rao bound (MCRB)[7]
⎪ ⎪ ⎪ ⎪ ⎧ ⎨ ⎩ ⎡ ⎣⎢ ⎤ ⎦⎥ ⎫ ⎬ ⎭ α E p α α r u MCRB( ) = 1 ∂ ln ( | , ) ∂ r u, 2 (19) wherer= [ (1), …, ( )]r r N Tis thefinite-dimensional observed vector
and u is a vector containing the nuisance parameters τ, Δ ,f ϕand the data symbols dk. It is shown in[25]that in the limit, as the number of
dimensions ofrtends to infinity, the MCRB(19)can be computed by replacing p( | ,r u α)by the following continuous-time function
⎡ ⎣⎢ ⎤ ⎦⎥
∫
∫
Λ α N s t r t dt N s t dt u ( , ) = exp −1 ( ) ( ) − 1 2 ( ) T T 0 0 2 0 0 (20)where T0denotes the observation interval. Straightforward
computa-tionsfinally lead to the following result:
Table 1
Computation time versus number of observed symbols.
Ns Computation time (ms) 500 52.64 1000 28.82 2000 57.79 5000 88.29 10,000 167.92
⎡ ⎣ ⎢ ⎢ ⎤ ⎦ ⎥ ⎥
∫
α N E s t α dt MCRB( ) = ∂ ( ) ∂ . T u 0 2 0 (21) Using(1), we obtain∫
s t∑
∫
α dt d d q t kT τ q t mT τ dt ∂ ( ) ∂ = * ( − − ) ( − − ) T k m k m T α s α s 2 , 0 0 (22) where q tα( ) = h t α ∂ ( )∂ . As indicated in(21), the statistical expectation of
(22)with respect to the data symbols dkand the nuisance parameters τ, Δ ,f ϕneeds to be computed. The computations are very similar to the ones related to the estimation of the carrier frequency, carrier phase and timing epoch derived in[7]. The next result follows from
(22) by recalling that symbols d{ }k are assumed to be i.i.d. with zero
mean and varianceσd2
⎡ ⎣ ⎢ ⎢ ⎤ ⎦ ⎥ ⎥
∫
∫
∑
E s t α dt σ q t kT τ dt ∂ ( ) ∂ = ( − − ) . d T d T k α s 2 2 2 0 0 (23)The Poisson formula[3]leads to ⎛ ⎝ ⎜ ⎞⎠⎟ ⎛ ⎝ ⎜ ⎞⎠⎟
∑
q t kT τ∑
T Q k T e ( − − ) = 1 k α s s k α s j πk t τ T 2 2, 2 − s (24) where Q2,α( )f is the Fourier Transform of q tα2( ). After substituting(24)in (23) and averaging with respect to τ (considered as a discrete random variable uniformly distributed between 0 and Ts)
⎡ ⎣ ⎢ ⎢ ⎤ ⎦ ⎥ ⎥ ⎡ ⎣ ⎢ ⎢ ⎡ ⎣ ⎢ ⎢ ⎤ ⎦ ⎥ ⎥ ⎤ ⎦ ⎥ ⎥ ⎛ ⎝ ⎜ ⎞⎠⎟ ⎛ ⎝ ⎜⎜ ⎞ ⎠ ⎟⎟ ⎛ ⎝ ⎜⎜ ⎞ ⎠ ⎟⎟ ⎛ ⎝ ⎜ ⎞⎠⎟ ⎛ ⎝ ⎜ ⎞⎠⎟
∫
∫
∫
∫
∑
∑
E s t α dt E E s t α dt τ T σ T Q k T e dtdτ σ T T Q k T sinc πkT T sinc πk e ∂ ( ) ∂ = ∂ ( ) ∂ | = 1 1 = ( ) T τ d T s T d T s k α s j πk t τT d s k α s s jπk T T u 2 2 0 2 2, 2 − 2 0 2, 0 −1 s s s 0 0 0 0 (25) where sinc x( ) = sin( )xx. Straightforward computationsfinally lead to⎡ ⎣ ⎢ ⎢ ⎤ ⎦ ⎥ ⎥
∫
E s t α dt σ T T Q ∂ ( ) ∂ = (0) T d s α u 2 2 0 2, 0 (26) with Q2,α(0) = [Qα( ) ⊗f Qα( )]f f=0 (27)where ⊗ denotes convolution and Q fα( )is the Fourier transform of
q tα( ). Using the property that Qα( )f is an Hermitian function (since
q tα( )is a real function), the following result can be obtained
∫
∫
Q2,α(0) = Q uα( ) du= q uα( ) du. −∞ ∞ 2 −∞ ∞ 2 (28) By denoting as Nsthe number of symbols in the observation intervalT0,(26) and (28)lead to α N σ N P MCRB( ) = d s α 0 2 (29) where N =s T Ts 0 and P =
∫
Q u( ) du=∫
q u( ) du α −∞ α α ∞ 2 −∞ ∞ 2 . Denoting the symbol energy as∫
E =E log (M) = σ H f df σ 2 ( ) = 2 s b 2 d d 2 −∞ ∞ 2 2and using symbolic computations leading to P =α π
α
48
2
, the following expression isfinally obtained
α α π E N M N MCRB( ) = 24 log ( ) . b s 2 0 2 (30) 6. Simulation results
6.1. Impact of a roll-off mismatch
Even if the number of samples in(8)depends on the roll-off factor
(this number increases as the roll-off factor decreases),Fig. 4shows qualitatively that the Gaussian assumption for the additional term due to roll-off mismatch is valid for all roll-off factors. Quantitative results coming from the application of the Kolmogorov test confirm the validity of the Gaussian assumption for(8)since the P-values indicated on eachfigure are clearly in favor of accepting the Gaussian assumption with usual probabilities of false alarm (seeFig. 4).Fig. 5illustrates this property, showing received QPSK constellations (plotted afterfiltering) with and without roll-off impairment. The top figure has been obtained with identicalfilters at the emitter and the receiver (without additive noise). The middlefigure corresponds to a roll-off mismatch (roll-off at the emitter side α = 0.35e , roll-off at the receiver side α = 0.7r ) which
clearly shows the additional noise affecting the QPSK constellation. The bottom figure has been obtained with identical emitter and receiver filters (i.e., h tr( ) =h t( )) with an additive Gaussian noise whose variance
Fig. 4. Estimated andfitted Gaussian pdf's for the interference term to the roll-off mismatch.
has been set to the variance of the constellation obtained with the previous roll-off mismatch. These results confirm that the ISI term due to the roll-off impairment can be approximated by an additional Gaussian noise with good accuracy.
Denoting asαeandαrthe roll-off factors of the transmission and
receptionfilters,Fig. 6compares the BERs obtained for αe=αr= 0.5 (no roll-off error) and for αe= 0.5,αr= 0.2 (roll-off error) using the theoretical expression (10) and an estimation computed from 105
emitted symbols. The BERs are displayed as a function of E Nb/ 0for a
4-QAM (or QPSK) modulated signal. It can be noted that there is a good match between the theoretical and experimental BERs, validating the assumption that the interference term can be approximated by an additive Gaussian noise.Fig. 7shows the corresponding degradation as a function of αr for α = 0.5e and for different values of E Nb/ 0. As
expected, for low roll-off values the degradation due to a roll-off mismatch is higher due to more powerful side lobes of g(t) yielding more powerful interference terms (as shown inFig. 8).
6.2. Performance of the roll-off estimation methods
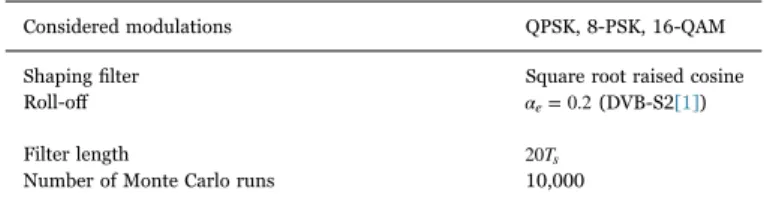
The objective of this section is to compare the performance of different roll-off estimation methods. More precisely, we consider the spectral method of [26](referred to as “Xu”) and the two proposed strategies based on the power and PSD of the received communication signal (referred to as “Power” and “PSD” respectively). Table 2
summarizes the simulation parameters used for the comparison.
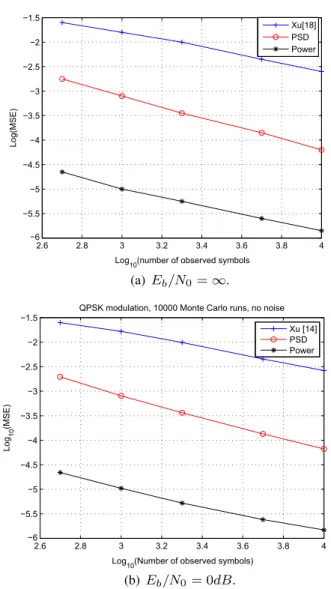
Fig. 9(a) shows the estimated MSEs as a function of the number of
observed symbols Ns in absence of noise, whereas Fig. 9(b)
corre-sponds to E Nb/ 0= 0dB. The algorithm based on the power of the
received signal has clearly the best performance. The performances of the roll-off estimation methods are depicted inFig. 10. The MSEs of the roll-off estimates are clearly decreasing when the number of samples Nsis increasing or when E Nb/ 0is increasing, as expected.
Fig. 11compares the performance of the power-based strategy for
different modulations and E Nb/ 0= 0dB. It appears that the
power-based roll-off estimation method performs better for high efficiency modulations. This is due to the fact that the SNR increases with the modulation order M. Indeed, this SNR can be expressed as
SNR = [(SNR )w−1+ (SNR ) ]ISI−1 −1 (31)
whereSNRISI(which does not depend on M) is the SNR related to the
ISI part of(7)defined as σ g t σ g t g t k m T SNR = ( ) 2 = ( ) ∑ [ + ( − ) ] d k m s ISI 2 2 0 ISI2 2 0 ≠ 2 0 (32)
and SNRwis the required SNR, i. e., the SNR related to the noise in(7)
σ g t σ M g t E N SNR = ( ) 2 = log ( ) ( ) w d b 2 2 0 2 2 2 0 0 (33)
which is an increasing function of M1. We will focus on the QPSK modulation in the rest of the paper.
6.3. Estimation errors and MCRBs
This section compares the MSEs of the power based roll-off estimator with the corresponding MCRBs. All simulations are shown for the QPSK modulation and do not change significantly for other modulations.Fig. 12(a) compares the MSEs and MCRBs, as a function of Nsfor three values of E Nb/ 0, whereasFig. 12(b) shows a comparison Fig. 6. Theoretical and simulated BER obtained with and without roll-off errors.
Fig. 7. BER degradation as a function ofαrfor α = 0.5e and several values of E Nb/ 0.
Fig. 8. Channel impulse response g(t) for several values ofαr, α = 0.5e .
Table 2
Simulation parameters.
Considered modulations QPSK, 8-PSK, 16-QAM Shapingfilter Square root raised cosine Roll-off α = 0.2e (DVB-S2[1])
Filter length 20Ts
Number of Monte Carlo runs 10,000
1Note that it is not necessary to demodulate the signal to estimate the roll-off.
Consequently, the performance of the estimation method is not related to E Nb/ 0(like
as a function of the emitted roll-off αefor Ns=2000 observed symbols
and E Nb/ 0= 0dB. The obtained MSEs and MCRBs present the same
trends and are quite close. Indeed, the average differences between the two curves are 1.40 dB for E Nb/ 0= 0 dB, 0.94 dB for E Nb/ 0= 5 dBand
0.89 dB for E Nb/ 0= 10 dB.
6.4. Robustness to channel impairments
The transmission channel is affected by several impairments in most practical applications. These impairments include synchroniza-tion errors for the carrier phase and frequency. Since the noise is independent from the received data, the theoretical PSD of the received signal (and its integral yielding the power) is insensitive to the presence of a phase shift. More precisely, the PSD of the complex envelope
∑
r t( ) = d h t( −kT e) +n t( )
k
k s jϕ
(34) does not depend on the phase errorϕ. Thus the presence of a phase shift should not impact either the proposed roll-off estimation meth-ods, or the method studied in[26]. The situation is different when the received signal is affected by a carrier frequency error fΔ. In this case, the complex envelope of the received signal can be written
∑
r t( ) = d h t( −kT e) +n t( ).
k
k s j π ft2 Δ
(35) The effect of the frequency error is to shift the useful part of the PSD around the frequency Δf inducing a mismatch between Sr(f) and S f α( , e). Some additional ISI also appears since the transfer function of the emittedfilter H(f) is also shifted resulting in a global transmission channel G(f) that does not fulfill the Nyquist criterion. In order to analyze the effect of frequency errors, we have tested the roll-off estimation methods for a QPSK modulation, without noise (E Nb/ 0= 100 dB), for E Nb/ 0= 0 dB and for different values of the
frequency error normalized by the symbol rate, i.e.,Δ /f Rs.Figs. 13,
14 and 15show the precision of the three studied roll-off estimators
(square root of the MSE) as a function ofΔ /f Rsfor different values of
Ns. Note thatΔ /f Rscan reach a value of 25% in a DVB-S2 system, but
can be significantly reduced by implementing a correction process such as, for example, a blind carrier frequency offset estimation algorithm
[28]. Depending on the desired roll-off estimation precision,Figs. 13,
14 and 15allow us to determine the appropriate required precision for
the carrier frequency error correction process. 6.5. Real data
The proposed power-based estimation method has been finally tested on real signals provided by Thales Alenia Space. In order to test our power roll-off estimation method on real data, two sets of data have been sent on an AWGN channel and recorded by the TCA: BPSK modulated data with roll-off α = 0.35e and QPSK modulated data with
roll-offα = 0.4e . Several values ofE Ns/ 0have been considered (5, 10, 15 Fig. 9. Estimated logMSEs as a function of the number of observed symbols for a QPSK
modulated signal.
Fig. 10. Estimated logMSEs as a function of the number of observed symbols for several values of E Nb/ 0.
Fig. 11. Power-based estimation method: logMSEs for QPSK, 8-PSK and16 −QAM
and 20 dB). The baseband in-phase and quadrature recorded compo-nents sampled at 2 Rswere used for roll-off estimation. The sampling
frequency, the center frequency and the bandwidth were adjusted to 11.71875 MHz, 3890 MHz and 5859.375 kHz. Each baseband signal was then divided into 100 blocks of 10000 symbols and the roll-off was estimated for each block. The obtained results are given inTables 3, 4. The means, variances and MSEs were computed from 100 blocks for each value ofE Ns/ 0. The results are coherent with the ones obtained
with the synthetic data. As expected, the precision increases with SNR, and with the modulation order for a given E Nb/ 0 (e.g., compare
estimates resulting from a BPSK constellation with
E Ns/ 0=E Nb/ 0= 5dB given in the first line ofTable 3 with estimates
resulting from a QPSK constellation with E Ns/ 0= 2E Nb/ 0= 10dBgiven
in the second line ofTable 4). 7. Conclusions
In order to perform digital modulation classification, the receiver has to know or to estimate some key parameters associated with the transmitted communication signal. This paper addressed the problem of estimating the roll-off factor of a classical square root raised cosine shapingfilter. We first analyzed the impact of a roll-off mismatch on the bit error rate (directly related to the modulation classifier perfor-mance). Then, we proposed two roll-off estimation methods and compared them to a benchmark available in the literature[26]. The two proposed method are based on the power spectral density and on
Fig. 12. MSEs and MCRBs for a QPSK modulation and the power-based estimation method.
Fig. 13. Squared root MSE of the Xu based roll-off estimator[26]in the presence of a carrier frequency error.
Fig. 14. Squared root MSE of the PSD-based roll-off estimator in the presence of a carrier frequency error.
Fig. 15. Squared root MSE of the power-based roll-off estimator in the presence of a carrier frequency error.
the power of the received signal. The performance of these two methods have been analyzed and their robustness to channel impair-ments (including white Gaussian noise and synchronization errors) has been studied. Several experiments have shown the good performance of the power-based estimation method. The modified Cramer–Rao bound
[7]for the roll-off estimation problem was also derived and compared to the obtained MSEs. Simulations performed on real satellite signal measurements (provided by Thales Alenia Space) finally showed the applicability of the proposed methods to real systems such as the telecom carrier analyzer of Thales Alenia Space. Future work include the performance analysis of modulation classifiers when the roll-off has been estimated with the proposed algorithm.
Acknowledgments
The authors would like to thank Rami Ali Ahmad for help with some simulation results, Mathieu Dervin for fruitful discussions about this project and Jorge Prendes for his advices about symbolic compu-tation.
References
[1] Digital Video Broadcasting (DVB): Second generation framing structure, channel coding and modulation systems for Broadcasting, Interactive Services, News Gathering and other broadband satellite applications - Ref. ETSI EN 302 307 v1.1. 1, June 2004.
[2] H. Alharbi, S. Mobien, S. Alshebeili, and F. Alturki, Automatic classification of digital modulations in presence of HF noise, in: EURASIP Journal on Advances in Signal Processing, November 2012, pp. 1–14.
[3]J.M. Borwein, P.B. Borwein, The AGM: a Study in Analytic Number Theory and Computational Complexity, Wiley, New York, 1987.
[4] K.M. Chugg, C.S. Long, A. Polydoros, Combined likelihood power estimation and multiple hypothesis modulation classification, in: Proceedings of the Asilomar Conference Signals, Systems, Computers, vol. 2, November 1995, pp. 1137–1141. [5] C.D. Chung, A. Polydoros, Envelope based classification schemes for continuous
phase binary frequency shift keyed modulation, in: Proceedings of the IEEE Milcom, Fort Monmouth, NJ, Oct. 1994, pp. 796–800.
[6]P. Ciblat, P. Loubaton, E. Serpedin, G.B. Giannakis, Asymptotic analysis of blind
cyclic correlation-based symbol-rate estimators, IEEE Trans. Inf. Theory 48 (July (7)) (2002) 1922–1934.
[7] A.N. D′Andrea, U. Mengali, and R. Reggiannini, The modified Cramer-Rao bound and its application to synchronization problems, IEEE Transactions on Communications, no. 2, February/March/April 1994.
[8] O.A. Dobre, A. Abdi, Y. Bar-Ness, W. Su, Survey of automatic modulation classification techniques: classical approaches and new trends, IET Commun. 1 (April (2)) (2007) 137–156.
[9] B. Dulek, O. Ozdemir, P.K. Varshney, W. Su, Modulation discovery over arbitrary additive noise channels based on the Richardson-Lucy algorithm, in: Proceedings of the IEEE International Conference on Acoustics, Speech and Signal Processing (ICASSP), Brisbane, Australia, April 2015, pp. 756–760.
[10] A.E. El-Mahdy, N.M. Namazi, Classification of multiple M-ary frequency-shift keying over a rayleigh fading channel, IEEE Trans. Commun. 50 (June (6)) (2002) 967–974.
[11] L. Hong, K.C. Ho, An antenna array likelihood modulation classifier for BPSK and QPSK signals, in: Proceedings of the IEEE Milcom, vol. 1, Anaheim, CA, USA, October 2002, pp. 647–651.
[12] S. Houcke, A. Chevreuil, P. Loubaton, Joint blind equalization and estimation of the symbol period: a contrast function approach, in: Proceedings of the IEEE International Conference on Acoustics, Speech and Signal Process. (ICASSP), Salt Lake City, USA, May 2001, pp. 2545–2548.
[13] C.Y. Huang, A. Polydoros, Two small SNR classification rules for CPM, Proceedings of the IEEE Milcom, vol. 3, October 1992, pp. 1236–1240.
[14] J.C. Lagarias, J.A. Reeds, M.H. Wright, P.E. Wright, Convergence properties of the Nelder-Mead simplex method in low dimensions, SIAM J. Optim. 9 (1), 112–147. [15] N. Lay, A. Polydoros, Modulation classification of signals in unknown ISI
environments, in: Proceedings of the IEEE Milcom, vol. 1, San Diego, CA, USA, November 1995, pp. 170–174.
[16] J.A. Nelder, R. Mead, A simplex method for function minimization, Comput. J. 7 (1965) 308–313.
[17] M. Oerder, H. Meyr, Digitalfilter and square timing recovery, IEEE Trans. Comm. 36 (May (5)) (1988) 605–612.
[18] S. Park, H. Chung, S. Na, Inter symbol interference due to mismatched roll off factors and sampling jitter over a Gaussian channel, Electron. Lett. 33 (November (24)) (1997) 2016–2017.
[19] J.G. Proakis, Digital Communications, Mc Graw Hill, Boston, 2001.
[20] A. Puengnim, N. Thomas, J.-Y. Tourneret, J. Vidal, Classification of linear and non-linear modulations using the Baum-Welch algorithm and MCMC methods, Signal Process. 90 (12) (2010) 3242–3255.
[21] S. Soliman, S.Z. Hsue, Signal classification using statistical moments, IEEE Trans. Comm. 40 (May) (1992) 908–916.
[22] S. Fki, A. Aïssa-El-Bey, T. Chonavel, Blind equalization and automatic modulation classification based on pdf fitting, in: Proceedings of the IEEE International Conference on Acoustics, Speech and Signal Processing (ICASSP), Brisbane, Australia, April 2015, pp. 2989–2993.
[23] P. Stoica, R. Moses, Introduction to Spectral Analysis, Prentice-Hall, New Jersey, 1997.
[24] A. Swami, B. Sadler, Hierarchical digital modulation classification using cumulants, IEEE Trans. Comm. 48 (March (3)) (2000) 416–429.
[25] H.L.V. Trees, Detection, Estimation and Modulation Theory, Wiley, New York, 1968.
[26] H. Xu, Y. Zhou, Z. Huang, Blind roll-off factor and symbol rate estimation using iFFT and least squares estimators, in: Proceedings of the International Conference on Wireless Communications, Networking and Mobile Computing (WiCom 2007), Shanghai, China, 2007, pp. 1052–1055.
[27] H. Yang, L. Zhu, T. Wu, The effects of mismatched roll-off factor on the receiving performance of QAM signals, in: Proceedings of the International Conference on Communications, Circuits and Systems (ICCCAS 2009), Milpitas, CA, 2009, pp. 86–90.
[28] Y. Yao, G. Giannakis, Blind carrier frequency offset estimation in SISO, MIMO and multiuser OFDM systems, IEEE Trans. Comm. 53 (January (1)) (2005) 173–183. [29] Z. Zhu, A.K. Nandi, Automatic Modulation Classification: Principles, Algorithms
and Applications, John Wiley and Sons, New York, 2014.
[30] Z. Zhu, A.K. Nandi, Modulation classification in MIMO fading channels via expectation maximization with non-data-aided initialization, in: Proceedings of the IEEE International Conference Acoustics, Speech and Signal Process. (ICASSP), Brisbane, Australia, April 2015, pp. 3014–3018.
Table 3
BPSK modulated signal, α = 0.35e .
E Ns/ 0 Mean Variance log10(MSE) Precision
5 dB 0.3340 2.9309 10−4 −3.2604 0.0234 10 dB 0.3338 5.4552 10−5 −3.4990 0.0178 15 dB 0.3351 2.2757 10−5 −3.6112 0.0156 20 dB 0.3349 6.9306 10−6 −3.6290 0.0153 Table 4 QPSK modulated signal, α = 0.4e .
E Ns/ 0 Mean Variance log10(MSE) Precision
5 dB 0.419 2.3299 10−4 −3.2262 0.0244 10 dB 0.4179 7.577 10−5 −3.4021 0.0199 15 dB 0.4154 1.8353 10−5 −3.5926 0.0160 20 dB 0.4162 7.8 10−6 −3.5683 0.0164