Publisher’s version / Version de l'éditeur:
Journal of the Acoustical Society of America, 72, 3, pp. 834-844, 1982-09
READ THESE TERMS AND CONDITIONS CAREFULLY BEFORE USING THIS WEBSITE. https://nrc-publications.canada.ca/eng/copyright
Vous avez des questions? Nous pouvons vous aider. Pour communiquer directement avec un auteur, consultez la
première page de la revue dans laquelle son article a été publié afin de trouver ses coordonnées. Si vous n’arrivez pas à les repérer, communiquez avec nous à [email protected].
Questions? Contact the NRC Publications Archive team at
[email protected]. If you wish to email the authors directly, please see the first page of the publication for their contact information.
NRC Publications Archive
Archives des publications du CNRC
This publication could be one of several versions: author’s original, accepted manuscript or the publisher’s version. / La version de cette publication peut être l’une des suivantes : la version prépublication de l’auteur, la version acceptée du manuscrit ou la version de l’éditeur.
Access and use of this website and the material on it are subject to the Terms and Conditions set forth at
Sound transmission through windows. I. Single and double glazing
Quirt, J. D.
https://publications-cnrc.canada.ca/fra/droits
L’accès à ce site Web et l’utilisation de son contenu sont assujettis aux conditions présentées dans le site LISEZ CES CONDITIONS ATTENTIVEMENT AVANT D’UTILISER CE SITE WEB.
NRC Publications Record / Notice d'Archives des publications de CNRC:
https://nrc-publications.canada.ca/eng/view/object/?id=a0490db6-04e0-49e8-b1e5-a529d125bb7f https://publications-cnrc.canada.ca/fra/voir/objet/?id=a0490db6-04e0-49e8-b1e5-a529d125bb7f
3er
pH1
N22.d 1
.
no64
National Research
Conseil national
BLDG
Council Canada
de recherches Canada
SOUND TRANSMISSION THROUGH WINDOWS I. SINGLE AND DOUBLE GLAZING
by J.D. Quirt
ANALYZED
Reprinted from
Journal of the Acoustical Society of America Vol. 72, No. 3, September 1982
p. 834
-
844L I B R A R Y
rn
DBR Paper No. 1064Division of Building Research
Dans c e t t e n o t e on pr'esente une s ' e r i e d e mesures de l a
transmission
du s o n p a r l e s f e n b t r e s r e l e v g e s e n l a b o r a t o i r e .A p a r t i r d e c e s i n f o r m a t i o n s , l f e f f e t de p e r t e d e l a t r a n s m i s s i o n du s o n dii
2
l ' g p a i s s e u r du v i t r a g e e t2
l ' e s p a c e e n t r e l e s v i t r e s est 6valu6 pour d i f f g r e n t s c a s .;sound transmission through
lows I. Single and double
1
J. D.
Quirt
Division of Building Research, National Research council of Canada, Montreal Road, Building M-27
Ottawa, Ontario, Canada KIA OR6
(Received 13 October 1981; accepted for publication 11 May 1982)
The results of an extensive series of laboratory measurements of sound transmission throul windows are presented. By reference to these data, the systematic dependence of the sound transmission loss on glass thickness and interpane spacing is evaluated.
PACS numbers : 43.55.Ti, 43.50.Jh
\LI
A series of measurements of the sound transmission loss (TL) of single- and double-glazed windows has been carried out primarily to determine the dependence of TL on glass thickness and interpane spacing. Although sound transmis- sion data for many types of window have been published, the results of different studies are not in close agreement. Fig- ure 1, which is based on data from a review paper by Marsh,' illustrates the typical variation among published results. De- spite the nominal similarity of glazing and interpane spac- ing, the results obtained in the three sets of measurements differ appreciably. Such discrepancies are apparently due to properties of both the samples themselves and the laborato- ries in which they are tested.
Several window properties in addition to glass thickness and interpane spacing can appreciably affect sound trans- mission. At low frequencies it is affected by panel resonances whose frequencies depend on the dimensions of the panes of glass and on the edge constraints. Below the coincidence frequency both edge constraints (rigidly mounted, simply supported, etc.) and damping appear to have some effect on sound transmission, although experimental tests5-'' are not
fully consistent with each other or with theoretical predic- tions. 12-14 Near and above the coincidence frequency the TL is strongly dependent on damping (which depends not just on losses in the glass but on sound energy dissipated within the seals around the window or transmitted to the support- ing structure). In addition to the effects that change sound transmission through the glass there is the problem of trans- mission around it; most of the data in the literature are for openable windows and such TL data are generally dominat- ed by the sound transmission characteristics of the leaks around openable sections.
Variations in TL data are also introduced by the char- acteristics of the laboratory reverberation room suite. Prob- lems of interlaboratory repeatability of TL measurements have been discussed in considerable detail in reports on round-robin test ~ e r i e s . ' ~ ~ ' ~ ~ ' ~ Many of the laboratory-relat- ed effects are predicted by theory, but the accuracy of predic- tion does not appear to justify systematic adjustment of pub- lished data (even if all relevant laboratory and test specimen details were available). Unfortunately, these systematic dis- crepancies are particularly pronounced for window TL data because practical constraints on pane size generally lead to the use of small windows mounted in filler walls, conditions that exaggerate some of the laboratory-related effects.
Given the large number of confounding effects, the lack of agreement among the published data, as illustrated in Fig. 1, is not particularly surprising. This large variability limits the information to be gained by combining the results of earlier studies of the change in window TL with parameters such as interpane spacing of double glazing. In an effort to obtain further information an extensive series of measure- ments of sound transmission through windows has now been made. As many variables as possible (such as window dimen- sions, glass mounting, and laboratory-related details) were held as constant as was practicable. This paper presents the results for single- and double-glazed windows, using data specifically selected to illustrate trends in the sound trans- mission performance. A full tabulation of the test results is available.
''
I. EXPERIMENTAL CONDITIONS l o o 200 500 1 ~ Z K 5K ~ O K A. Test environment
B A N D CENTER F R E Q U E N C Y . Hz
All the sound transmission measurements were made in
FIG. 1. TL. data from three studies of nominally equivalent windows (do"- accordance with ASTM standard Ego-75, ''Laboratory ble 6-mm glazing with approximately 100-mm separation). measurement of airborne sound transmission loss of build- 834 J. Acoust. Sot. Am. 72(3), Sept. 1982 0001 -4966/82/0g0834-11$00.80 @ 1982 Acoustical Society of America 834
ing partitions."18 The source room has a volume of 62 m' (2 100 cu ft) and the receiving room a volume of 255 m3 (9000 cu ft). Test specimens are mounted in an opening 2.44 m (8 ft) high by 3.05 m (10 ft) wide between the two reverberation rooms. Following the recommendations of ASTM E90, each room is equipped with both fixed and moving diffusing pan- els intended to provide as good an approximation as possible to the diffuse sound field that is assumed in transmission loss theory.
The sound-pressure level in each room is sampled by a set of nine Genrad 1961 electret condenser microphones with associated preamplifiers whose outputs are observed individually. The signal from each microphone is selected via a Genrad 1566 32-channel multiplexer/amplifier and measured with a Genrad 1921 1/3-octave real-time analyz- er. These instruments and the noise sources are all interfaced to a minicomputer that controls the measurements and per- forms all necessary calculations.
Measurements were made for the standard 1/3-octave bands with centers from 80 to 5000 Hz. The data for the 80- and 100-Hz bands should be treated with caution because the test facility does not satisfy room dimension require- ments for these bands.''
Figure 2 shows the dimensions of the window frame and the associated filler wall in which the window units were mounted. The frame was sufficiently deep to permit inter- pane spacings up to 200 mm (8 in.). The filler wall was of double wood stud construction with multiple layers of gyp- sum board on each face and sound absorbing material in the cavity. Tests were made with heavy panels inserted in the window openings to make sure that flanking transmission, including sound transmitted through the filler wall and frame, was insignificant in relation to sound transmitted through the windows.
FIG. 2. Location and size of window openings in filler wall.
6. Window mounting
ion detail dows we1
-
.-
.
The window construct Is are shown schen cally in Fig. 3. All the win -e mounted in woo sashes of the same size: 62U m m ( ~ 4 . 5 in.) wide, 1750 mm (68.75 in.) high, and 41 mm (1.625 in.) thick. These had spring metal weatherstripping around their perimeter and fitted snugly into the frame openings. Each sash was butted against a wooden positioning strip and held firmly in posi- tion by a second wooden strip fastened to the frame. All cracks around the perimeter were sealed using an adhesive tape (which for narrow cracks provides a seal essentiallj equivalent of caulking).
The windows tested had single or double glazing 1
nominal glass thicknesses of 3, 4, and 6 mm, actual mass/ unit area of 8.1 kg/m2 (26 oz/ft2) 10.4 kg/m2 (34 oz/ft2) and 14.4 kg/m2 (47 oz/ft2), respectively. The glass panes (560 m m x 1680 mm) were held in place by wooden strips ns '-
-
to the sash. A small bead of caulking sealant ensured a g
acoustical seal (and a thin resilient layer) between the a and the glass. Double glazing was tested with two p mounted in a single sash (for interpane spacings up t~ mm) and with each pane mounted in a separate sash spacings of 19 mm or greater).
The effects of edge conditions have been studied 1 theoretically and experimentally in several studies. though the experimental results do not agree perfectly theoretical predictions, the basic trends have been ez lished at least qualitatively. As noted by Utley and Fletcl practical window mountings usually are interma between rigidly clamped and simply supported edges, the damping provided by edge losses tends to be substar ly greater than that of the glass itself. In general, the lo values of TL appear to be obtained for firmly clamped euges
and minimum damping. Simply supported edges and higher
S I N G L E D O U B L E D O U B L E G L A Z l N G G L A Z l N G G L A Z I N G ( 1 S A S H ) ( 2 S A S H E S 1 r the with uled ;ood rood --a" i l l l G J o 19 (for both Al- with and ~tial- west 3 --a
FIG. 3. Schematic representation of window mounting details. Caulked seals are indicated by circles and taped seals by arrows.
cies 1 ment sideri exam cause range lant 1 with
:
of thc C. De incidence : critical f mode sl larger in ndows w nprove- ere not aamplng can provlae Increases ot up to-
3 dl3 tor t,,,,,..-below coi and substantially s near the requency .6.9. l 2 Although iapes for these wi
ured to determine actual edge constraints, their edge itions are probably intermediate to the simply support- d rigidly clamped cases. Measured damping (as will be aiscussed) appears to be in the middle of the range of results reported in the
literature.'^^
The present study should there- fore provide a reasonable estimate of the performance of "ty- pical" windows. Of greatest concern, however, was the con-ation that this mounting technique is well suited to ining the dependence of TL on interpane spacing be- t similar edge constraints can be obtained for a wide : of interpane spacing. It is hoped that because the sea- ayer was rather thin, changes in damping associated hardening of the sedant over the extended time period : test seric :S were m inimal.
scriptive Code for windows
For ease of presentation the window glazing is identi- fied by a simple descriptive code based on nominal glass thickness (in mm) and interpane spacing (in mm) for double glazing. A single layer of 3-mm glass is simply denoted by "3," double glazing with two panes of 4-mm glass separated by a 50-mm air space by "4(50)4," and so on. Special details related to the interpane cavity are indicated by minor varia- tions:
(1) Nonparallel double glazing with interpane spacing at the top of the window different from that at the bottom is indicated by specifying the maximum and minimum spac- ing; e.g., "4(4 to 19)4."
(2) Absorptive treatment (with 25-mm thick glass-fiber) covering the surface of the cavity perimeter between the sashes is denoted by addition of the letter A to the interpane s~acing code; e.g., "3(100A)3."
II. EXPERIMENTAL RESULTS
A. Precision and reproducibility of transmission loss data
Data were obtained in three series of measurements with intervals of approximately one year between each. Al- though details of glass mounting and measurement proce- dures were consistent within each series, there were some changes in the laboratory between series: alterations were made in the diffusing panels of the receiving room, in the position of the noise sources, and in the number and location of microphones in both rooms. Although the tests conform in all cases to the ASTM E90-75 standard, it was found that these modifications could introduce systematic changes in the measured TL results.
The nominal 95% confidence limits for TL measure- ments are f 1 dB for the 1/3-octave bands at or above 3 15 Hz, & 2 dB for the 250 and 200-Hz bands, and f 3 dB for the lower frequencies. l7 Repetition of measurements with-
out removing the test specimen consistently gave agreement within those limits. When windows were reinstalled and test- ed again within a test series, the changes in TL were general- 836 J. Acoust. Soc. Am., Vol. 72, No. 3, September 1982
untine ly larger, presumably because small u1a11Sm CllG lllU
_
conditions resulted in slightly different specimens for the retests. The changes in TL were still consistently within the confidence limits, except near the coincidence dip where sen- sitivity to damping (and hence to mounting conditions) is expected to be greatest. In no case did the changes exceed 3 dB and no average trends were discernible.
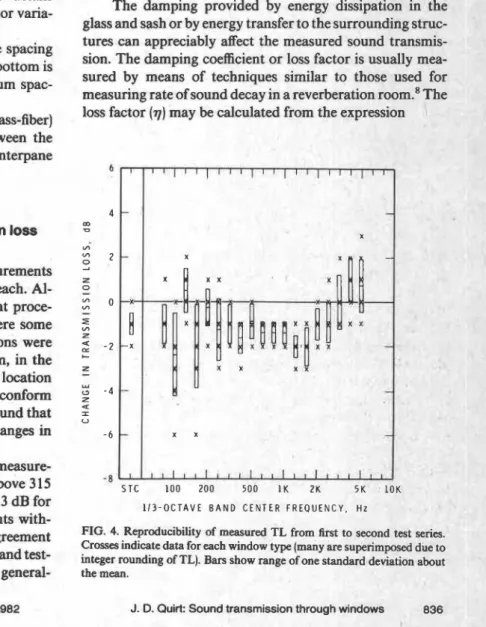
Because of possible systematic changes in TL between test series, the second and third series of measurements in- cluded a number of window types that had been tested in the first series. Figures 4 and 5 show the changes in TL results for these tests on nominally identical windows. Not only do the differences frequently exceed the confidence limits, but rather well defined mean changes are evident for some 1/3- octave bands. Although the differences are not far outside the confidence limits (and are small when viewed in the light of interlaboratory round-robin test ~eries),'~." they do inter- fere with comparison of TL results from different series. Wherever possible, detailed comparison of TL results to as- sess trends associated with glass thickness or other variables were restricted to comparisons within a series. The window types retested were chosen primarily to facilitate this ap- proach. Cases where data from several series are combined are specifically identified.
B. Damping measurements
The damping provided by energy dissipation in the glass and sash or by energy transfer to the surrounding struc- tures can appreciably affect the measured sound transmis- sion. The damping coefficient or loss factor is usually mea- sured by means of techniques similar to those used for measuring rate of sound decay in a reverberation room.' The loss factor ( 7 ) may be calculated from the expression
S T C 1 0 0 2 0 0 5 0 0 1K 2K 5K 1 0 K 1 1 3 - O C T A V E B A N D CENTER F R E Q U E N C Y . H z
FIG. 4. Reproducibility of measured TL from iirst to second test Crosses indicate data for each window type (many are superimposed integer rounding of TL). Bars show range of one standard deviatiol the mean.
J. D. Quirt: Sound transmission through wir
series.
l due to
S T C 1 0 0 2 0 0 5 0 0 1 K 2 K 5 K 10K 1 1 3 - O C T A V E B A N D CENTER F R E Q U E N C Y . H z
FIG. 5. Reproducibility of measured TL from first to third test series.
Crosses indicate data for each window type (many are superimposed due to integer rounding of TL). Bars show range of one standard deviation about the mean.
77 = D (27.3 fo)-', (1)
where D is decay rate (in dB/s) and fo is resonant frequency (or band center frequency when measurements are made with 1/3-octave noise signals).
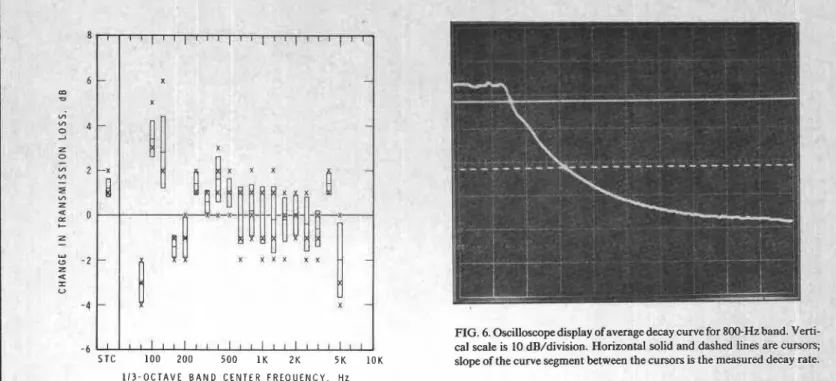
For the present study 1/3-octave bands of random noise were used to drive magnetic transducers to excite the window. The signal was obtained from one of three B and K accelerometers mounted on the glass, using a B and K 2209 sound level meter as a pre-amplifier. The ac signal from the sound level meter was input to a custom rms module (based on an Analog Device AD536A) with selectable time con- stants from 1 to 1000 ms and a logarithmic output of 10 dB/ V. This output signal was displayed on a Tektronix 468 digi- tal storage oscilloscope. The signal-averaging mode of the oscilloscope was used to obtain a decay curve average (typi- cally of 32 decays), which yields a more reliable measure- ment of decay rate. A typical trace is shown in Fig. 6; mova- ble cursors provided direct digital readout of time and voltage (at 10 dB/V) differences between any two points on the trace. Measurements were restricted to a range of about 5 dB below the initial signal level to 15 dB above the back- ground level, and the rms time constant was set to less than
1/10 of the measured time constant for the decay.
Preliminary measurements were made with each of the four source transducers driven individually, and with all four driven simultaneously. Repeatability for any source po- sition was found to be approximately f 5% about the mean. Similar differences were observed among values measured for individual source transducers, and much of this variation may be ascribed to measurement uncertainty. With all four transducers driven simultaneously, the data fell in the same range as those for individual sources and provided slightly higher and much more uniform signal levels at the three pickup accelerometers. Because this uniformity of signal 837 J. Acoust. Soc. Am., Vol. 72, No. 3, September 1982
FIG. 6. Oscilloscope display of average decay curve ror a w - H z band. Ve"
cal scale is 10 dB/division. Horizontal solid and dashed lines are cum slope of the curve segment between the cursors is the measured decay ri
strength is desirable for decay curve averaging, the actual tests were performed with all four source transducers driven simultaneously.
Damping was measured in full detail only for the 4-n glass, but similar results would be expected for the otl. thicknes~es.~ Data for the cases with the window sash resti on a concrete floor and with it mounted in the wi
are presented in Fig. 7. Overall measurement estimated to be approximately
+
10%. Mountin the frame significantly increases damping for rrequenc below about 2 kHz. ndow frar accuracy ing the sa E C. Single glazing
Measured transmission loss data for the three thic nesses of glass are presented in Figs. 8 (a)-(c). For compa
0
5 0 1 0 0 2 0 0 5 0 0 1K PK 5 K 1 0 K 1 1 3 - O C T A V E C E N T E R F R E Q U E N C Y , H z
FIG. 7. Measured loss factors for ~ i n ~ l e - ~ k e d window with Cmm glass
lying on concrete floor (0) and mounted in window frame (A).
1 1 3 - O C T A V E C E N T E R F R E Q U E N C Y . H z
1 1 3 - O C T A V E C E N T E R F R E Q U E N C Y . H z
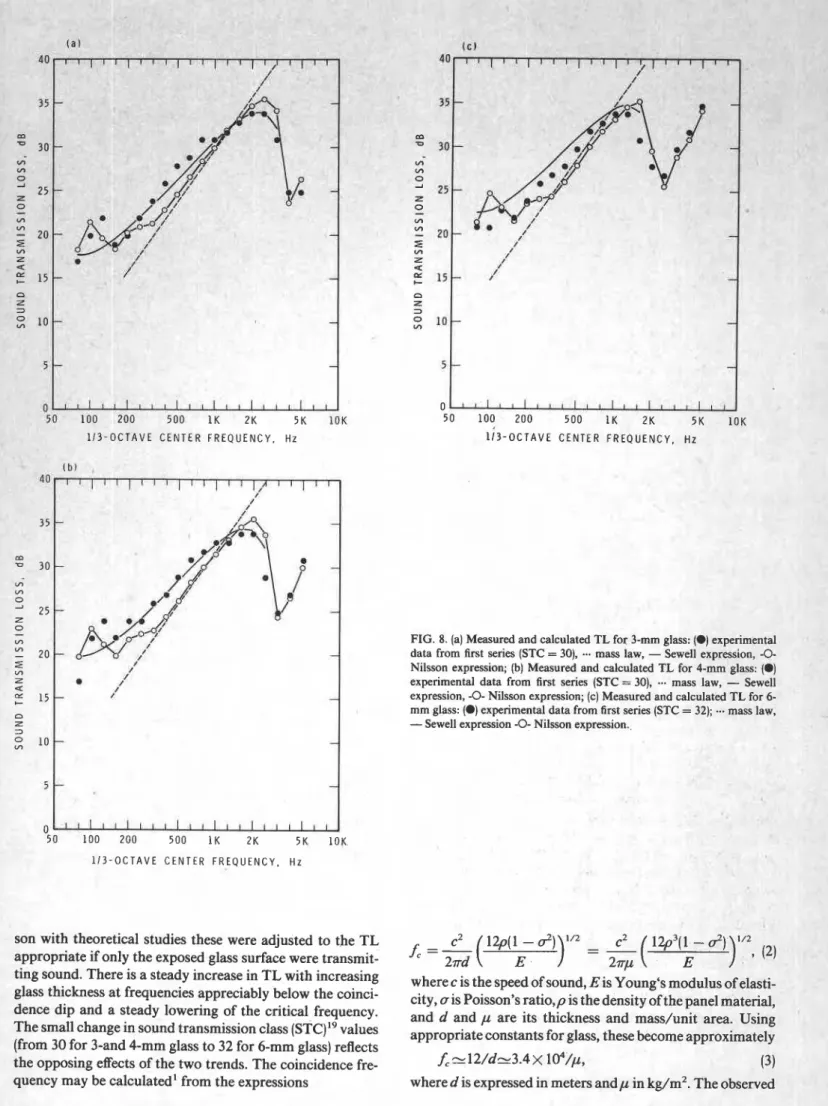
son with theoretical studies these were adjusted to the TL appropriate if only the exposed glass surface were transmit- ting sound. There is a steady increase in TL with increasing glass thickness at frequencies appreciably below the coinci- dence dip and a steady lowering of the critical frequency. The small change in sound transmission class (STC)I9 values (from 30 for 3-and 4-mm glass to 32 for 6-mm glass) reflects the opposing effects of the two trends. The coincidence fre- quency may be calculated1 from the expressions
838 J. Acoust. Soc. Am., Vol. 72, No. 3, ~ e ~ t d m b e r 1982
0
5 0 1 0 0 2 0 0 5 0 0 1 K 2 K 5 K 1 0 K l i 3 - O C T A V E C E N T E R F R E Q U E N C Y , H z
FIG. 8. (a) Measured and calculated TL for 3-mm glass: (0) experimental data from first series (STC = 30), mass law, - Sewell expression, -0- Nilsson expression; (b) Measured and calculated TL for 4-mm glass: (0)
experimental data from first series (STC = 30),
...
mass law,-
Sewell expression, -0- Nilsson expression; (c) Measured and calculated TL for 6- mm glass: (0) experimental data from first series (STC = 32);...
mass law,-
Sewell expression -0- Nilsson expression.where c is the speed of sound, E is Young's modulus of elasti- city, cr is Poisson's ratio,p is the density of the panel material, and d and p are its thickness and mass/unit area. Using appropriate constants for glass, these become approximately
f,?12/d=3.4X 1O4/p, (3)
where d is expressed in meters andp in kg/m2. The observed J. D. Quirt: S ~ u n d transmission through windows 838
ce freque~ 3). lculating LiS study 2 nsmissior :oincidenl ncies in tl: with
Eq.
( In ca sound tra$ably below coincidence, it is comn law" expression. Actually, numerous have been proposed'5; that used in tht
we in goo I at freque lon to us' mass law : present ! d agreemc :ncies app e the "mmn expressions study is ent si P re- 1>1 A""
-
TL = 20 log( fp)-
48, (4)where f is the 1/3-octave band center frequency. As shown in Figs. 8 (a)+), this equation does not accurately predict the dependence of the TL data on frequency. The so-called "baf- fle effect" and "niche effect" are presumably responsible for much of this deviation from
Eq.
(4).The b a e effect arises when the sound transmitting ele- ment constitutes only part of the partition separating the source and receiving rooms (the remainder of the partition being the baffle, which transmits negligible sound power). Expressions for sound transmission through a panel in a baf- fle have been derived by Nilsson12 and by Sewe1ll3; resulting calculated TL values are presented in Figs. 8 (a)+). For comparison with measured data 1/3-octave band TL values were calculated using transmission coefficients evaluated at 1/30-octave frequency intervals and weighting their contri- bution to each band in accordance with the response charac- teristic of an ANSI class I11 1/3-octave filter."
Sewell's evaluation of forced sound transmission through a panel in an infinite baffle13 yielded a correction of the mass law that should be applicable for frequencies below
f,
/2. As is evident from Figs. 8 (a)-@), this correction appre- ciably improves the prediction relative to the mass law. It should be noted, however, that this curve represents only the contribution from forced transmission; the effect of includ- ing resonant transmission (which depends on damping and edge constraints of the panel) would be to lower the calculat- ed TL, changing the apparent agreement with experiment.Nilsson's treatment of the problem''*'2 includes the contribution of resonant transmission and takes specific ac- count of the effect of room and panel modes. The curves in Figs. 8 (a)-(c) were calculated following Eqs. (6.5) to (6.7) of Ref. 12, with b = 3.05 m and c = 2.44 m (the test opening dimensions) to allow for the effect of the deep niches on ei- ther side of the test frame in the D B R N R C reverberation rooms. The experimentally determined loss factors were used in the calculation and edge effects were assumed to be midway between the clamped and simply supported cases. For frequencies above f, the expression developed by Cremer2' (which has been validated in many studies) was substituted for that of Nilsson because it provides markedly better agreement with the experimental data. The calculated TL values do not agree perfectly with the measured ones, but do exhibit many qualitative similarities such as the local minimum in TL at 160 Hz and the general shape of the curve near f,
.
The fairly consistent discrepancy
-
1 to 3 dB between experiment and Nilsson's expression at frequencies below f, may be due to a "niche effect." The windows were mounted at one extreme of the 25-cm thick filler wall, with the win- dow frame creating a deep niche on the source room side. A similar increase in TL associated with a deep niche at one 839 J. Acoust. Soc. Am., Vol. 72. No. 3. September 1982.de of the reciabk n ecause of . -
D. Simple double glazing
ne spacin rnsmissioi
.I,.",. .la--
g. n class of
specimen has been reported elsewhere.'' An a liche was present for all the tests reported her the low sensitivity of this effect to the depth of tl i c h e l b it should not appreciably affect the trends obsewc
in TL as a function of interpa
The measured sound t n ' the sing1
glazed windows showed much 1-a U G ~ G I I U ~ ~ ~ ~ VLI mass/ur
area (p) of the glass than one would expect from the 20 log ( dependence of the mass law expression. Similar results ha been presented in previous s t ~ d i e s . ~ ' ~ In part, this may 1
explained by the decrease in the critical frequency
(f,
) wiincreasingp, so that for heavier glass the coincidence dip h a greater effect within the frequency range affecting the S?
or the mean sound insulation. Even at frequencies appreci bly below f, , however, the change in TL was less than 6 dl doubling ofp. It is interesting that for small panels Nilssor theory predicts a very similar reduced dependence of TL on p , as is evident from the changing relation between the curves for mass law and Nilsson's expression in Figs. 8 (a)- (c).
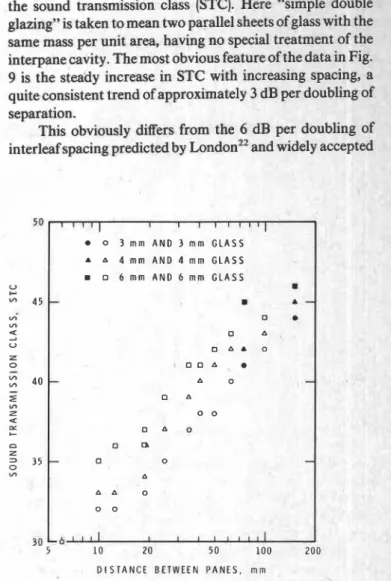
The basic results of the maln serles or tests on slml double-glazed windows are presented in Fig. 9 in terms the sound transmission class (STC). Here "simple doul glazing" is taken to mean two parallel sheets of glass with t same mass per unit area, having no special treatment o f t interpane cavity. The most obvious feature of the data in F 9 is the steady increase in STC with increasing spacing quite consistent trend of approximately 3 dB per doubling separation.
This obviously differs from the 6 dB per doubling interleaf spacing predicted by London22 and widely accept
o 3 m m A N D 3 m m G L A S S A 4 m m A N 0 4 m m G L A S S q 6 m m A N D 6 m m G L A S S
-
B A q*
q A q A 0 ' 0 0 1-
A 0 q A 0 0 O A 0 D rb-
q 0 A A A 0 0 0 3 0 5 1 0 2 0 5 0 1 0 0 2 0 0 D I S T A N C E BETWEEN P A N E S , m mFIG. 9. STC as a function of interpane spacing for double glazing; open closed symbols denote data from first and third test series, respectively
J. D. Quirt: Sound transmission through windows E La- B/ 1's AS.# he ig.
.
a and4 5 - 1 l l l r 1 " ' I " 40
-
-
m 0 G 35-
V) 0 0 A-
V) I 25 Z a C 20 3 0 V) IS-
-
10 0 S T C 1 0 0 2 0 0 5 0 0 1 K 2K 5K 1 0 K 1 1 3 - O C T A V E B A N D C E N T E R F R E Q U E N C Y . HZFIG. 12. Sound transmission loss data from the third series for single 3-mm glass (O), double 3-mm glass with the panes touching ( A ) , and double 3-mm glass with a very thin oil film between (0).
as a single layer of 6-mm glass; (2) for most frequencies the TL of the double layer is 5 or 6 dB higher, as one would expect because of the increased mass; (3) around 2 kHz the increase in TL is much smaller.
Two simple hypotheses may be advanced to explain the smaller increase near 2 kHz: one or more of the three win- dows may have sufficient contact between layers to make it act like a single layer of 6-mm glass (with
f,
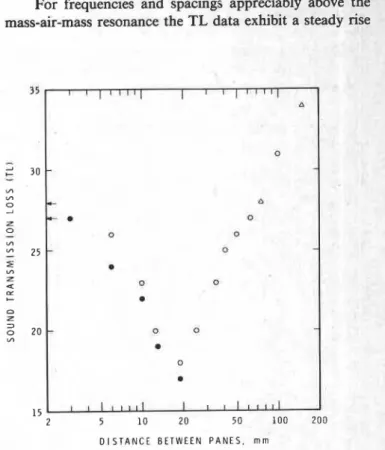
~2 kHz). Alter- natively, there may be a small air gap between the panes; the resonance frequency of 2 kHz would occur for an airspace -0.4 mm (which could readily exist, considering the ob- served presence of minute glass chips). To investigate these possibilities further, an additional test was run with a very thin film of oil between the two layers of glass; the data are included in Fig. 12. The resulting TL curve matches very closely the shape of that for a single layer of 3-mm glass, but it is higher by an average of 5.4 dB (with a standard deviation of 0.9 dB). Because the oil would both reduce interpane fric- tion and move the mass-spring-mass resonance to much higher frequencies, this test does not discriminate between the two hypotheses about the origin of the dip at 2 kHz. On the other hand, it does give a result that can reasonably be interpreted as the TL of double glazing in the limit as inter- pane spacing goes to zero.Figure 13 compares this result with the TL curves for 3- and 6-mm interpane spacings. At frequencies well below the mass-air-mass resonance the change in TL with spacing is insignificant. For the two-octave range centered on the mass-air-mass resonance the TL is lower than that for zero interpane spacing. Above the resonance the TL increases steadily with increasing interpane space. For the cases shown in Fig. 13 the STC decreases with increasing spacing; this trend is reversed for large interpane spacing, with the minimum STC values occuring for the range from 6 to 13 mm. It is unfortunate that most hermetically sealed double glazing is fairly close to the worst case condition.
84 1 J. Acoust. Soc. Am., Vol. 72, No. 3, September 1982
15
-
S T C 1 0 0 2 0 0 500
1 1 3 - O C T A V E B A N D CE N T E R FREQ U E N C Y . H z
FIG. 13. Comparison of TL data for small interpane spacing for 3(3)3, and A for 3(oil film)3 data.
3: 0 for 3(6):
Trends in the TL as a function of interpane spacing also clearly evident in the data for individual freque~ bands. For lower frequency bands the effect of the mass-: mass resonance is clearly evident. Figure 14 presents data the 250-Hz band; for double 3-mm glass the data exhib pronounced minimum apparently centered between 13 i 19 mm, in good agreement with the values predicted by (5). For much smaller spacing the TL becomes almost in pendent of spacing; the arrows at the left of Fig. 14 show TL for the limiting cases with nominally touching pa (with and without an oil film).
For frequencies and spacings appreciably above the mass-air-mass resonance the TL data exhibit a steady rise
- 3 - ~de- the are ncy air- c-
-
IUI 15 2 5 1 0 2 0 5 0 1 0 0 2 0 0 D I S T A N C E BETWEEN P A N E S , m mFIG. 14. TL for 250-Hz band as a function of interpane spacing for double 3-mm glazing: symbols 0 , A , and denote data from the first, second, and third test series, respectively.
wim Increasing spacmg, as illustrated by the 800-Hz data in Fig. 15. For frequencies near coincidence (where variations in damping and edge conditions would be expected to have their strongest effect) the scatter increases, but the data still exhibit the same trend of slightly less than 3-dB increase per doubling of the spacing. This dependence on spacing is slightly less than that exhibited by the STC, because the lat- ter is also affected by the shifting of the mass-air-mass reso- nance. In neither case is there a clear indication that a limit- ing value is being approached at very large spacing.
windc Panes simpl: .
.
me or sectio ments n A n n S .."'.p' treatn I glass 1-
ing re! the ot sameecial double glazing
n the preceding section the effect of changing inter- pane spacing on the sound transmission loss of double glaz- ing has been examined in some detail. Sometimes other con- straints may limit the acceptable total thickness of the )w. In such cases changing the thickness of the two of glass does alter the TL, as shown in Fig. 9, but y increasing the thickness of both panes of glass is not ily (and seldom the best) way to improve the TL. This n examines the effectiveness of special window treat-
;, including the use of two different thicknesses of glass,
irallel orientation of the two layers of glass, and special nent of the interpane cavity.
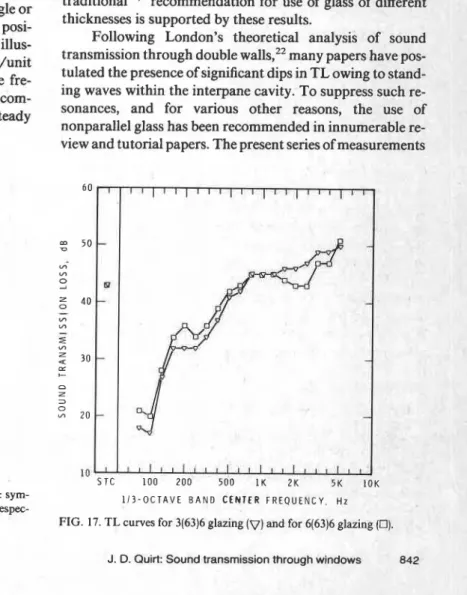
:igure 16 compares the STC results for the heaviest tested (two layers of 6-mm glass) with the correspond- sults obtained when one of the layers is 6-mm glass and her 3-mm glass. In most cases the lighter glass gave the STC or higher. In part, this is possible because of the small change in STC with glass thickness of typical single or double glazing, as noted in the preceding sections. The posi- tive reason for the effectiveness of mismatched glass is illus- trated by the TL curves in Fig. 17. The different mass/unit area gives different panel resonances and coincidence fre- quencies for the mismatched glass layers,so that the com- l.;..-~ system exhibits much smaller deviations from a steady
25
2 5 1 0 2 0 5 0 1 0 0 ZOO
D I S T A N C E B E T W E E N P A N E S , m m
FIG. 15. TL for the 800-Hz band as a function of interpane spacing: sym-
bols 0, A, and denote double 3-mm, 4-mm, and 6-mm glazing, respec-
tively. The dashed line indicates a slope of 3 dB/distance doubling.
842 J. Acoust. Soc. Am., Vol. 72, No. 3, September 1982
\ N D 6 m m I I N D 6 mrn I . . . . I G L A S S ; L A S S D I S T A N C E B E T W E E N P A N E S , rnm
FIG. 16. STC as a function of interpane spacing for double glazing; open and closed symbols denote data from first and second test series, respective- ly.
increase with increasing frequency. Because the STC (like the corresponding I S 0 rating, I,) tends to be controlled mainly by dips in the TL curve, this smoothing of the curve more than offsets the effect of reducing the mass. Thus the traditional
'.'
recommendation for use of glass of different thicknesses is supported by these results.Following London's theoretical analysis of sound transmission through double walls,22 many papers have pos- tulated the presence of significant dips in TL owing to stand- ing waves within the interpane cavity. To suppress such re- sonances, and for various other reasons, the use of nonparallel glass has been recommended in innumerable re- view and tutorial papers. The present series of measurements
10
S T C 1 0 0 2 0 0 5 0 0 1 K 2 K 5 K 1 0 K 1 1 3 - O C T A V E B A N D C E N T E R F R E Q U E N C Y , H z
FIG. 17. TL curves for 3(63)6 glazing (V) and for 6(63)6 glazing (0).
- - - 5 0 0 1 K 2 K 5 K 1OK 1 1 3 - O C T A V E B A N D C E N T E R F R E Q U E N C Y . H z 1 1 3 - O C T A V E B A N D C E N T E R F R E Q U E N C Y . H z S T C 1 0 0 2 0 0 500 1 K Z K 5 K 1 0 K 1 1 3 - O C T A V E B A N D CENTER F R E Q U E N ' C Y , Hz maximur : differenc of the ;la I the TL fc
included tests witn eacn of the four gqss rnicmesse
three cases with interpane separation at one end of the three times greater than that at the other end. Inter spacings of 6 to 19 mm, 25 to 75 mm, and 50 to 150 mm chosen. These not only spanned the range of typical i pane separation but also permitted comparison with the responding TL data for parallel windows with s ~ a c i n ~ e
to the minimum, mean, or n spacing
windows.
Figure 18(a) shows the e betweer
slanted windows and that obtained with parallel glz whose interpane spacing matches the maximum spacin the nonparallel glass. The negative values observed in a1 all cases (including all the STC values) indicate the consi, superiority of parallel glass. Thus, if the thickness of a permits a maximum interpane spacing of, for example mm, better noise reduction can be obtained with pal glass at 100-mm separation than with slanted glass wit1 mm as the largest separation. This agrees with the cor
sion of several review papers'.' based on the limited previously a~ailable.~
The difference between TL for slanted (
and that for parallel windows having the same mean 1
pane spacing is shown in Fig. 18(b). Neither the STC na TL for individual 1/3-octave bands shows much eviddn appreciable change introduced by slanting the glass el possibly a slight improvement near coincidence. The f o ~ data presentation in Fig. 18(b) tends to put undue stre: the differences between the results for parallel and nonp lel glass. A typical example of the similarity of the pal TL curves is presented in Fig. 19. The dips and peaks c at the same frequencies and do not exhibit great differ( in the strength of resonance. Most of the differences c reasonably be ascribed to measurement uncertainty slight changes in damping and edge constraints.
The third case (where the parallel glass spacing ec
FIG. 18. (a) TL for slanted double glazing (separation d to 3d ) minus TL for parallel double glazing with separation 3d. (b) TL for slanted double glazing
(separationd to 3d )minus TL for corresponding parallel glazing with separ- ation 2d. (c) TL for slanted double glazing (separation d to 3d ) minus TL for corresponding parallel glazing with separation d. Crosses indicate data for each window type (many are superimposed due to integer rounding of TL). Bars show range of one standard deviation about the mean.
10
S T C 100 200 5 0 0 I K 2K 5 K 1 0 K 1 1 3 - O C T A V E B A N D C E N T E R F R E Q U E N C Y , H z
FIG. 19. TL curves for 4(12.5)4 glazing (0) and for 4(6 to 19)4 glazinl S ror sash Pan'= warn n r r r nter- : cor- aual uing g for most .
.
scent wall ,100 r n l l a l L '&l.U 1 loo nclu- data izing nter- lr the Ice of rcept ..,---
andX X X
. - n u
" " I
1 1 3 - O C T A V E B A N D CENTER F R E Q U E N C Y . H z
FIG. 20. TL with fiberglass lining around perimeter minus TL for same glazing without absorptive material, for 100-mm interpane space. Crosses indicate data for each window type (many are superimposed due to integer rounding of TL). Bars show range of one standard deviation about the mean.
the minimum interpane spacing for nonparallel orientation) is presented in Fig. 18(c). Here the slanted glass is clearly superior, by about 3 dB on average, but this improvement is essentially what one would expect from the doubling of the
mean interpane spacing. Thus nonparallel glazing does not
appear to offer any significant benefits.
The effect of special treatment of the interpane cavity was examined only briefly in this study as it has already been fully examined. Figure 20 illustrates the effect of adding a 25-mm layer of glass fiber around the perimeter of the win- dow openings. Clearly, the glass fiber substantially increased TL at the high frequencies, but had little effect at lower fre- quencies, as one might expect from the absorption coeffi- cient of the material used. By using a thicker layer of absorp- tive material with suitable surface treatment it should be possible to tailor this effect to offset dips in TL over most of the frequency range.
Ill. SUMMARY
Experimental sound transmission loss (TL) data for sin- gle-glazed windows have been compared with theoretical predictions. Changes in the STC with increasing glass thick- ness are smaller than predicted by "mass-law."
ment of the cavity perimeter and use of different thicknesses of glass in the two layers give noticeable improvements.
ACKNOWLEDGMENT
This paper is a contribution from the D ing Research, National Research Council o
ivision of ~f Canada
-r LL - n:
Build- and is with the approval of the Director ol ~nc: ulvision.
'J. A. Marsh, "The airborne sound insulation of glass," Part 1, Appl. Acoust. 4, 55-70 (1971); Part 2, 131-154 (1971); Part 3, 175-192 (1971). 'W, A. Oosting, "Investigation of the sound insulation of flat glass," Build- ing Acoustics Technical Physical Service, TNO and TH, Delft, Rep. 7 0 6 007 (April 1967). [Also see P. A. DeLange, Appl. Acoust. 2, 215-236 (1969).]
4R. M. Woolley, "Sound insulation of windows," Glass Age 10,44 (1967). 4E. N. Bazley, "The airborne sound insulation of partitions," Natl. Phys.
Lab., HMSO, London (1%6).
'A. Eisenberg, "The sound insulation of glasses and glazing," I. "Firmly fitted single glazing," Glastech. Ber. 31,297-302 (1958); 11. "Firmly fitted double glazing," Glastech. Ber. 34, 54&547 (1961).
6A. Cops, M. Myncke, E. Lambert, and G. Vermeir, "Some recent results on the sound insulation of glass by means of scale models," Internoise 73 (1973).
7A. COPS, H. Myncke, and G. Vermeir, "Insulation of reverberant sound through double and multilayered glass constructions," Acustica 33,257- 265 (1975).
'W. A. Utley and B. L. Fletcher, "Influence of edge conditions on the sound insulation of windows," Appl. Acoust. 2, 131-136 (1969).
9W. A. Utley and B. L. Fletcher, "The effect of edge conditions on the sound insulation of double windows," J. Sound Vib. 26,63-72 (1973). ' 9 . Kihlman and A. C. Nilsson, "Effects of some laboratory designs and
mounting conditions on reduction index measurements," J. Sound Vib. 24, 349-364 (1972).
"A. C. Nilsson, "Reduction index and boundary conditions for a wall between two rectangular rooms," I. "Theoretical results;" 11. "Experi- mental results," Acustica 26, 1-23 (1972).
1 2 ~ . C. Nilsson, "Sound transmission through single leaf panels," Rep. 74-
01, Build. Acoust. Chalmers University of Technology, Sweden (1974). "E. C. Sewell, "Transmission of reverberant sound through a single-leaf
partition surrounded by an infinite rigid baffle," J. Sound Vib. 12,21-32 (1970).
'"E. C Sewell, "Two dimensional solution for transmission of reverberant sound through a double partition," J. Sound Vib. 12, 33-57 (1970). "R. E. Jones, "Intercomparisons of laboratory determinations of airborne
sound transmission loss," J. Acoust. Soc. Am. 66, 148-164 (1979). 16N. Michelsen, "The effects of laboratory design on the measured sound
reduction index," Lydteknisk Laboratorium, Denmark, Rep. No. 18 (1979).
I7J. D. Quirt, "Measurements of the sound transmission loss of windows," NRC Can. Division of Building Research, BR Note 172 (April 1981). 18ASTM E90-75, "Laboratory measurement of airborne sound transmis-
sion loss of building partitions," Am. Soc. Test. Mater., Philadelphia, PA (1975).
19ASTM E413-73, "Determination of sound transmission glass," Am. Soc. Test. Mater. Philadelphia, PA (1973).
''ANSI Standard S1.ll, "Specification for octave, 1/2-octave, and 1/3-oc- tave filter sets," Am. Standards Assoc. (19661.
A systematic study of the TL of double-glazed windows "L. Cremer, Akust. Z.7,8 1-103 (1942). kepinted with English summary
has shown clear trends as a function of glass thickness, inter- in ArchitecturalAcou~tic~, Vol. 10 ofBenchmark Papers in Acoustics, edit-
ed by T. D. Northwood (Dowden, Hutchinson, and Ross, Stroudsberg,
pane spacing, and cavity treatment. Changes in STC of dou- 1977). . .
ble glazing with glass thickness are
-
6 dB/doubling of ='A. Lbndon, "Transmission of reverberant sound through double walls,"thickness. For typical spacing of the two panes the STC of J. Res. Natl. Bur. Stand. 449 77-88 (1950).
23B. M. Sharp, "A study of techniques to increase the sound insulation of
doub'e-glazed windows at dB'doubling of the building elemen&.. R e p pB-222 829, U, S Dept of Housing and Urban separation. The data do not indicate any significant im- ~~~~l~~~~~~ (19731.
provement in TL for nonparallel glass relative to that for '"A. J. icea and'^.
ice rocker,
"Sound transmission through double panelsparallel glass of the same mean spacing. Absorptive treat- using statistical energy analysis," J. Acoust. Soc. Am. 47,683493 (1970).
This publication is being distributed by the Division of Buiidirrg R e s e a r c h of the National R e s e a r c h Council of
Canada. It should not be reproduced i n whole o r in p a r t
without p e r m i s s i o n of the original publisher. The Di- vision would b e glad to b e of a s s i s t a n c e in obtaining such p e r m i s s i o n .
Publications of the Division m a y be obtained by m a i l - ing the a p p r o p r i a t e r e m i t t a n c e (a Bank, Exprees, o r P o s t Office Money O r d e r , o r a cheque, m a d e payable to the R e c e i v e r G e n e r a l of Canada, c r e d i t NRC) t o the
National R e s e a r c h Council of Canada, Ottawa. KIA OR6.
Stamps a r e not acceptable.
A l i s t of a l l publications of the Division i s available and may be obtained f r o m the Publications Section, Division of Building R e s e a r c h , National R e s e a r c h Council of