HAL Id: hal-00568245
https://hal.archives-ouvertes.fr/hal-00568245
Submitted on 23 Feb 2011
HAL is a multi-disciplinary open access
archive for the deposit and dissemination of
sci-entific research documents, whether they are
pub-lished or not. The documents may come from
teaching and research institutions in France or
abroad, or from public or private research centers.
L’archive ouverte pluridisciplinaire HAL, est
destinée au dépôt et à la diffusion de documents
scientifiques de niveau recherche, publiés ou non,
émanant des établissements d’enseignement et de
recherche français ou étrangers, des laboratoires
publics ou privés.
Bartosz Palubicki, Rémy Marchal, Jean-Claude Butaud, Louis-Etienne
Denaud, Laurent Bléron, Robert Collet, Grzegorz Kowaluk
To cite this version:
Bartosz Palubicki, Rémy Marchal, Jean-Claude Butaud, Louis-Etienne Denaud, Laurent Bléron, et
al.. A Method of Lathe Checks Measurement; SMOF device and its software. European Journal of
Wood and Wood Products, Springer Verlag, 2009, 68 (2), pp.151-159. �10.1007/s00107-009-0360-y�.
�hal-00568245�
For Peer Review
Draft Manuscript for ReviewA Method of Lathe Checks Measurement;
SMOF device and its software
Journal: Holz als Roh- und Werkstoff Manuscript ID: HRW-09-0063
Manuscript Type: ORIGINALARBEITEN / ORIGINALS Date Submitted by the
Author: 16-Apr-2009
Complete List of Authors: Palubicki, Bartosz; Poznan University of Life Sciences, Dept of Woodworking Machinery and Basis of Machines Construction; Arts et Metiers ParisTech, LABOMAP
Marchal, Rémy; Arts et Metiers ParisTech, LABOMAP Butaud, Jean-Claude; Arts et Metiers ParisTech, LABOMAP Denaud, Louis-Etienne; Universite Paul Sabatier, LGMT Bléron, Laurent; Arts et Metiers ParisTech, LABOMAP Collet, Robert; Arts et Metiers ParisTech, LABOMAP
Kowaluk, Grzegorz; Wood Technology Insitute, Wood-based Materials and Glues Dept.
Keywords: veneer quality, veneer checks, lathe checks, check frequency
For Peer Review
1
A Method of Lathe Checks Measurement;
SMOF device and its software
Bartosz Pałubicki
(1, 2)*, Rémy Marchal
(1), Jean-Claude Butaud
(1), Louis-Etienne
Denaud
(3), Laurent Bléron
(1), Robert Collet
(1), Grzegorz Kowaluk
(4)(1) Arts et Metiers ParisTech, LABOMAP, rue Porte de Paris 71250 Cluny, France
(2) Poznan University of Life Sciences, Dept. of Woodworking Machinery and Basis of Machines
Construction, ul. Wojska Polskiego 38/42, 60-627 Poznan, Poland
(3)
Universite Paul Sabatier, LGMT-, 1 rue Lautréamont, 65016 Tarbes cedex, France
(4) Institute of Wood Technology, Winiarska 1, 60-654 Poznan, Poland
*corresponding author:
Abstract
In the present paper, a novel method for veneer checks measurement and
description based on digital image analysis is evaluated. According to this
method, the camera is located sideways to the veneer allowing for viewing the
checks geometry in the cross-section of the veneer. Checks are opened by bending
the veneer on a roller of a specific diameter and they are exposed in such a way
that good visibility of checks is assured. The algorithm used reproduces the
checks by finding their coarse positions on the rescaled image and then migrating
to the original, full resolution image to precisely localize the checks’ bottom. The
method is automatic and delivers the most important information on checks of
veneer, namely distances between checks and their depths.
Ein Verfahren zur Messung von Rissen in Furnieren: SMOF–Apparatus und
zugehörige Software
Zusammenfassung
In dieser Studie wird ein neues Verfahren zur Messung von Rissen in Furnieren
unter Verwendung digitaler Bildanalyse untersucht. Dabei ist die Kamera seitlich
angeordnet, wodurch die Rissgeometrie auf einer Querschnittsseite des Furniers
betrachtet werden kann. Durch Biegen des Furniers auf einer Rolle mit
spezifischem Durchmesser werden die Risse geöffnet und so belichtet, dass diese
gut sichtbar sind. Der verwendete Algorithmus bestimmt die Risse, indem er
zunächst in einem Bild mit verringerter Auflösung deren ungefähre Position
feststellt und dann an diesen Stellen im Originalbild mit voller Auflösung die
Risstiefe genau erfasst. Es handelt sich um ein automatisches Verfahren, das die
wichtigsten Informationen zur Rissbildung, nämlich den Abstand zwischen den
Rissen und deren Tiefe, liefert.
Introduction
3 4 5 6 7 8 9 10 11 12 13 14 15 16 17 18 19 20 21 22 23 24 25 26 27 28 29 30 31 32 33 34 35 36 37 38 39 40 41 42 43 44 45 46 47 48 49 50 51 52 53 54 55 56 57 58 59 60For Peer Review
Usually, a few parameters are used for the description of veneer quality: thickness variation, surface roughness, veneer curl-up and lathe checks (Lutz 1974; Feihl 1986; Nagatomi et al. 1999; Denaud 2006). Methods for surface roughness evaluation as well as thickness variation measurement are easily available, but methods and devices for lathe check detection are not so common. It must be pointed out that lathe check occurrence is a very serious defect because of its huge effect, first on the veneer and then on the mechanical strength of plywood or LVL (Ohya et al. 1989; DeVallance et al. 2007). It also affects the glue consumption during panel production.
The lathe checks phenomenon has been widely studied for a long time with regard to the forming mechanisms (Leney 1960a, b) and it is still of high interests (Ohbayashi et al. 2007). Furthermore, an energetic approach and risk of lathe check occurrence has been reported (Thibaut 1988; Thibaut and Beauchene 2001).
There are two main characteristics describing lathe checks: the depths and the intervals between two neighbor checks. Most of the researchers (Koch 1964; DeVallance 2007; Denaud 2006 and others) use the lathe check frequency defined as the inverse of check interval. However, since frequency is used in the time and not in the geometrical domain, lathe check interval is preferred in the present work.
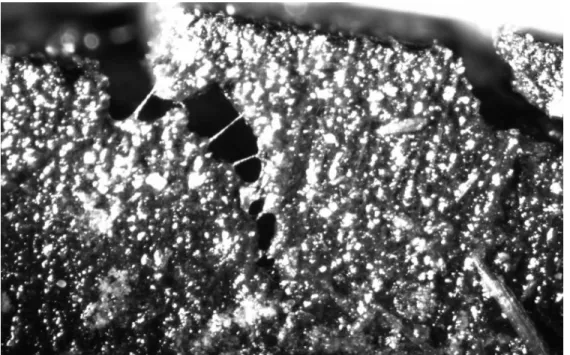
It would be ideal to determine the checks pattern on the veneer surface as well as the depth function along each check. Some problems occur though. Usually, the measurement of average intervals is not a complicated task – it is sufficient to count the checks on a given veneer length (e.g., 100 mm) and divide this length by the number of checks counted. The check depth, however, is more difficult to evaluate. The geometry of checks usually makes it hard to measure the depth on many points along the check using a nondestructive method (unless tomography is available). Figure 1 shows lateral views of checks opened by bending. Having a manipulated access only from the open face (possibly also from the closed face) of the veneer, it is impossible to reproduce the shape of the check`s cross-section or, what would be even more interesting, to determine its depth (e.g., using laser displacement sensor). Two groups of approximate methods are exploited instead: indirect methods or single cross-section optical measurement.
Several indirect methods of lathe check depth measurement exist, however they all give values averaging not only along one, but often along several checks. The simplest and widely used method in industry is the “stiffness” method. By bending the veneer in both opposite directions, the difference of stiffnesses is perceptible between open and closed veneer faces. When the open face is on the compressed side, the fact of check existence does not influence the rigidity, but the veneers seem to be significantly weaker when bending in the opposite direction. The difference of bending stiffnesses in both directions gives an idea of the checks depth. The disadvantages of this method are:
- the initial curvature of the veneer introduces measuring difficulties to the method and - the resulting difference of the stiffness depends not only on the depth but also on the
intervals of the checks for a given veneer.
Another method uses air pressure loss during passing through the veneer (El Haouzali et al. 2007). This technique is based on imposing a compressed air by exterior area ring of the head on the veneer face and then measuring the pressure of the air, which passed through the wood to the interior ring area. The difference between input and output pressure (pressure loss) gives quantitative knowledge of the air permeability of the veneer. This is influenced by: lathe checks, surface roughness, wood tissue density and porosity etc. Assuming that on both sides of the veneer the wood tissue is the same and the roughness is similar, the difference of pressure losses between both faces becomes highly correlated to lathe checks. The loss is lower on the open face (air passes more easily), compared to the closed face. Like in the case of the “stiffness” method, here again the result includes at once both depths and intervals of several checks. Additionally, the surface roughness and wood structure on both veneer faces might not be similar and therefore might influence the result.
Bearing in mind the mentioned disadvantages, researchers prefer to utilize single cross-section optical measurement (Wang et al. 2001; DeVallance et al. 2007). The image of the veneer side is usually obtained by using a microscope. However, to be able to see the checks clearly (improve contrast), it is necessary to use extra techniques, like for example covering the open face with an ink penetrating the checks, or bending the veneer in order to open checks. After improving the contrast between wood tissue and checks, they are often “manually” measured on a screen. Frequently, authors do not provide details of their measurement. For example, lathe checks were investigated by Nagatomi et al. 1999, but a detailed methodology was not given, except for the fact that a CCD camera with a magnification lens was used. It can be assumed that it was examined by manual image analysis.
Two other, very promising methods of lathe checks quantification were proposed by Denaud et al. 2007b. Instead of a strict, post factum measurement of the veneer geometry, an
3 4 5 6 7 8 9 10 11 12 13 14 15 16 17 18 19 20 21 22 23 24 25 26 27 28 29 30 31 32 33 34 35 36 37 38 39 40 41 42 43 44 45 46 47 48 49 50 51 52 53 54 55 56 57 58 59 60
For Peer Review
3
indirect, online “sensing” of veneer checking during peeling was performed. By using a microphone or an accelerometer mounted on the cutting knife and analyzing their signals in the frequency domain, it is possible to obtain the checks frequency and in some cases also an estimation of their depth. Denaud et al. 2007a have also developed a convenient method to identify lathe checks signatures on the temporal signal issued from the mentioned sensors: a local Root Mean Square (RMS) averaging and a peak detection algorithm which does not require any threshold. These methods, however, seem to be more suitable for laboratory than for industrial applications because of their sensitivity to background noise. No automated industrial solutions for the lathe check detection are known to the authors.Summarizing above considerations, there is need for a fast, effective method able to measure numerous lathe checks in order to provide statistically important results on check interval as well as on their depth.
Experimental stand
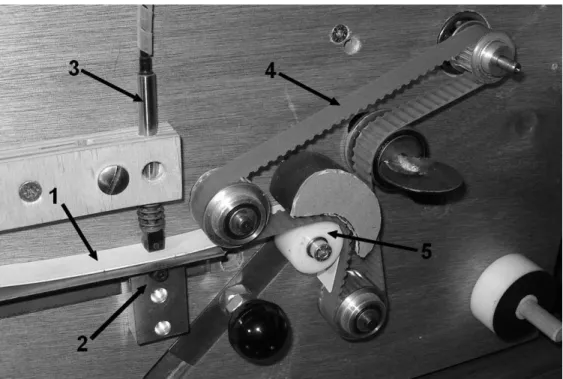
The SMOF device (Figure 2) dedicated for measuring the intervals and the depths of lathe checks present in the wood veneer has been developed for some time (Pałubicki et al. 2007). Contrary to the measurement of checks on the surface of wood pieces presented by Christy et al 2005, lathe checks are usually almost invisible on the flat veneer. The presented measuring technique is based on checks opening by bending the veneer on a pulley of a specific radius. Since the veneers are fragile, this operation has to be done with special care. It is essential to choose an appropriate bending pulley for the veneer being inspected, because success of the measurement depends on it. If the pulley diameter is too small, the measurement will provoke cracking and increasing lathe checks depth, so that the measurement is not reliable. On the other hand, if the pulley diameter is too big, the checks might not be opened and thereafter are poorly visible on the image and hard to detect. Latter, however, is less unwanted. Recommended pulley diameters for varying beech veneer thicknesses were found experimentally after numerous measurements and are given in Figure 3. Additionally, in the current setup, the flexible, inextensible belt, also acting as a conveyor (feeding system), fastens the veneer on the pulley and forces it to become evenly bent over the pulley. This decreases the stress concentration at the bottom of the check and the risk of the veneer breakage. It is advised to utilize wet veneers for the measurement, as they are more flexible than dry ones. Moreover, a perspective of the development of an on-line control of the peeling process requires the checks characterization of wet wood, as it is peeled. Dry wood measurement would differ because of heterogeneous wood shrinkage.
The SMOF system is designed to operate with veneer stripes 15 up to 40 mm wide either produced by wood disc peeling on laboratory micro-lathe (Butaud et al. 1995) or by regular bolt peeling (veneer stripe to be cut-off from the sheet in this case). The measuring speed (feed rate) is regulated between 0.5 and 7 m/min. The applicable veneer thickness to be measured may not exceed 4 mm.
For veneer measurement it is crucial to prepare its edge properly. It has to be flat in order to keep it always in the focus plane of the camera. Furthermore, it should be clean without fuzzy grains. High smoothness of the veneer side is advised in order to recognize the checks more easily. The best way to achieve all mentioned properties is – in the case of micro-peeling – planing of at least one of the faces of the wood disk. For cut-off veneer stripes, it is advised to sand their edges with special care in order to preserve the veneer structure (e.g., between wooden clamps).
Once the veneer is bent over the pulley (and the checks are opened) the line-scan camera starts scanning a veneer side.
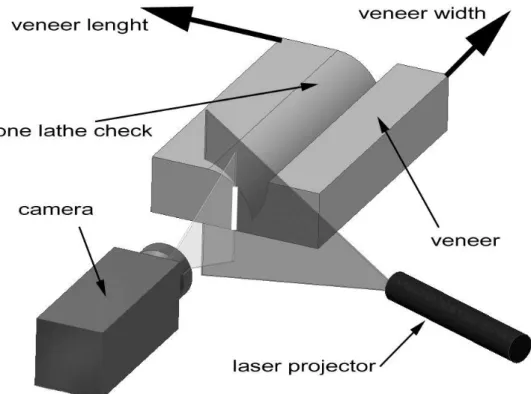
With a conventional bright field illumination, some small variations of brightness caused by the distance of the object from the camera would not provide sufficient contrast between checks and veneer. However, to assure successful and automatic lathe check analysis, the effect of such brightness variations should be minimized. A special illuminating system based on the laser line projector has been developed in order to ensure high contrast of the images (Figure 4). Both, the line-scan camera and the laser projector, have a linear field of view (projection). If their triangular beams (being inclined with respect to each other) cross in the same plane, all the objects located within such intersection will appear on the image as highly illuminated pixels. Contrary, all the surface valleys (such as checks) are not illuminated and represented as dark pixels on the image. The laser line fully covers the field of view of the camera; 10 µm and 5 mm width and height, respectively. 3 4 5 6 7 8 9 10 11 12 13 14 15 16 17 18 19 20 21 22 23 24 25 26 27 28 29 30 31 32 33 34 35 36 37 38 39 40 41 42 43 44 45 46 47 48 49 50 51 52 53 54 55 56 57 58 59 60
For Peer Review
The Dalsa Spyder III high-speed camera (max line frequency 36 kHz) with 1024 pixels equipped with a special NAVITAR PreciseEye macro-objective (magnification 3,6) ensuring low distortion was used. The camera is externally triggered, the encoder coupled with the veneer movement. After putting each linear frame next to each other, it is possible to create a quasi never-ending reproduction of the veneer edge, ready to be analyzed for checks determination. The resolution of the image is 0.01 mm.
Dedicated software was written in LabView® environment to maintain all necessary tasks:
1. start/stop veneer feeding,
2. continuous obtaining of veneer thickness,
3. continuous acquisition of single-line frames from camera and reconstructing the entire image of the veneer,
4. image analyzing toward automatic check detection.
The SMOF software runs under Microsoft Windows system on a standard PC equipped with Pentium III 2.0 GHz processor and 1024MB DDR-RAM memory. The PC communicates with SMOF in two ways: i) by ethernet connection (GigE network adapter 1000 Mb/s) to set up the camera and acquire images and ii) by USB 2.0. serial port (NI USB-6210 M series Data Acquisition Card) which is used in three ways:
• as a digital counter – to calculate the feed speed and length of veneer,
• as a A/D converter – to obtain veneer thickness values from the LVDT sensor and • as a steering unit – to start and stop the feeding system.
Lathe check detection algorithm
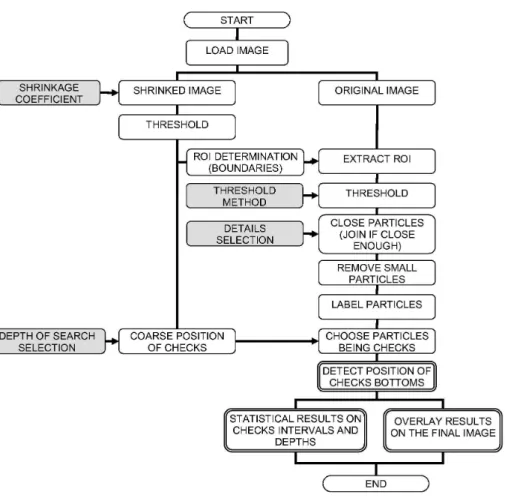
When a high resolution image of the veneer is acquired and saved, the check detection procedure starts. The SMOF system performs an analysis in fully automatic mode; it allows however some manual adjustments for semi-automatic check detection, especially useful when the inspected veneer has very dark or rough side surfaces. Figure 5 displays the block diagram of the algorithm used.
Since the image is high resolution in both X and Y direction (100 pix/mm) leading to high image size, the algorithm used is optimized to save the computation time. At the beginning, just after loading the image, its resolution shrunk by a rescale coefficient preset to s = 10. This operation has two advantages: it decreases CPU load for operations that do not require high resolution data and it works as a low pass filter removing the noise from the original picture. After automatic threshold, based on the image histogram, the Region Of Interest (ROI) is extracted by cutting off unused area under and above the veneer (depending on veneer thickness).
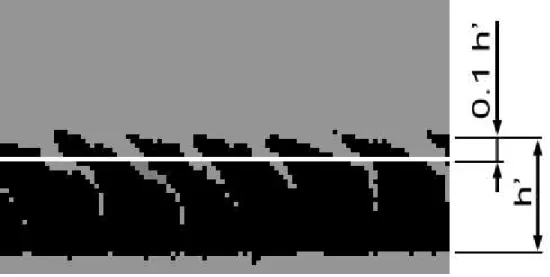
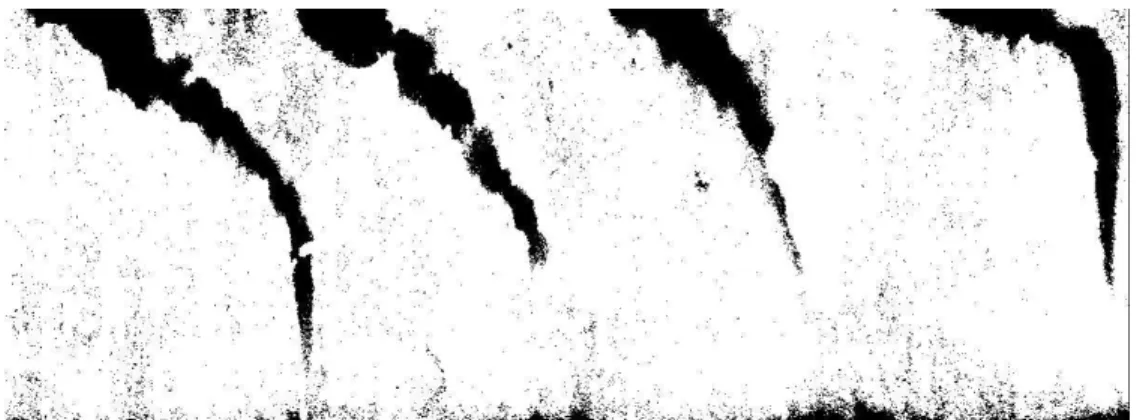
Then detection of coarse positions of the checks on a rescaled image is performed. As can be seen in Figure 6, one horizontal row of pixels is selected at a specified depth of the veneer profile
y’h’ = 0.1 h’ (10% of veneer thickness). Along this line the checks occurrences are examined and
the horizontal position x’h’ i of each check found at this (y’h’) level is memorized.
In the meantime, the original image is cropped according to rescaled ROI obtained before rescaled photo processing, in order to minimize the amount of data to be processed. Transforming the high resolution image into a binary one (Figure 8a) using automatic threshold is followed by a closing operation as described below.
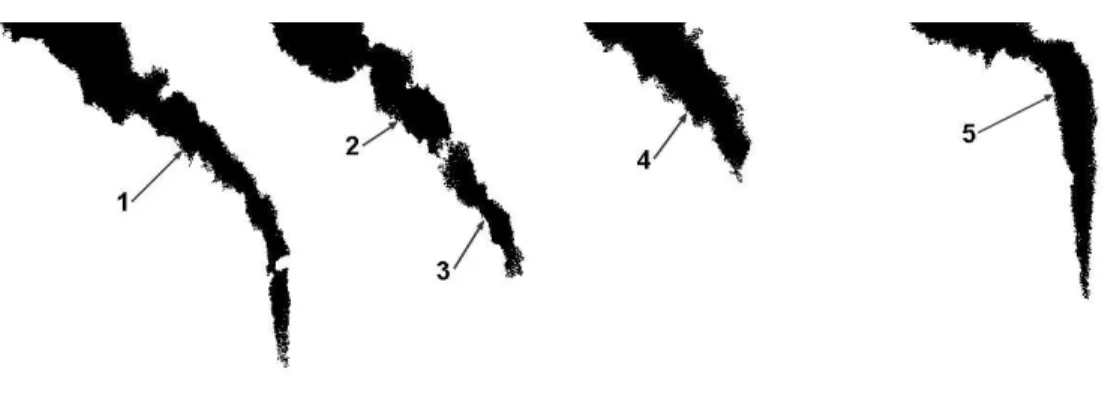
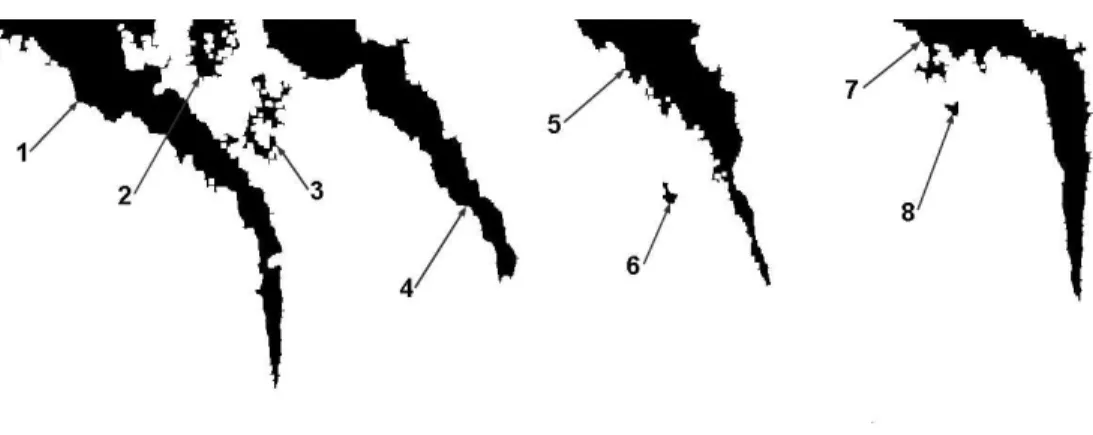
One of the problems in automatic lathe check detection is the occurrence of out-standing wood fibers, bridging (Figure 7) accompanying cracking of a wood tissue (Landis 2004). During the crack opening, not the entire material releases the constraints, some fibers (bridges) remain connected over the crack mouth opening. This results in similar problems like the one of not fully opened check: on the veneer images, they might appear as discontinuities of a check, therefore, a method to establish the real bottom of check, despite of bridging, is required. The closing operation performed on the image joins all the parts of one check by removing the narrow discontinuities (bridges), so that fragmented checks turn into continuous ones. The operation fills the space between two pixel “islands” and, in this way, joins them together when the distance between the two closest pixels of both “islands” is within the kernel size. The different resulting images are obtained when using 2x2 kernel (Figure 8b) and 5x5 kernel (Figure 8c). As can be seen, closing with too small kernel may cause the checks to be partially unnoticed (check no.4, Figure 8b is more shallow compared to check 5, Figure 8c) or partially qualified as another particle (object number 3, Figure 8b is considered separated from no. 2) and disqualified in the next
3 4 5 6 7 8 9 10 11 12 13 14 15 16 17 18 19 20 21 22 23 24 25 26 27 28 29 30 31 32 33 34 35 36 37 38 39 40 41 42 43 44 45 46 47 48 49 50 51 52 53 54 55 56 57 58 59 60
For Peer Review
5
processing steps. Closing operation does not cause any additional bi-directional growth of the “island” like e.g., the dilatation operation does.Next, the small and bottom touching objects are removed to “clean-up” the image and then, all resting objects are enumerated and labeled.
Now, to distinguish checks from the noise (e.g., objects 2, 3, 6, 8 of Figure 8c) the coarse positions of checks determined before on the small, rescaled image are used. These check positions (x’h’ i; y’h’) are transferred to the high resolution image using the rescale coefficient s
giving positions in the actual, high resolution image (xh i; yh) of pixels surely belonging to the
checks. The labels of the objects containing these pixels are memorized. Only these objects are considered as checks and subjected to further analysis.
With the coordinate system center (0, 0) located on the top left corner of the image and directed as shown in Figure 9, for each confirmed check two coordinates (ai, bi) of check’s bottom are
calculated. The vertical one bi given by its position is the lowest of all pixels belonging to the
check (equation. 1)
( )
j ii
y
b
=
max
, (1)
where yj is the vertical position of j-th pixel of i-th check
The horizontal coordinate ai of the check bottom is calculated as a center of all ni pixels belonging
to the bottom of the considered i-th check (equation. 2)
(
)
∑
==
i n k i k i ix
n
a
11
(2)
where xk is a horizontal position of k-th pixel of the i-th check with the pixel being located at the bi
level
In such a way, the set of all check bottoms are found and overlaid on the original picture (Figure 9). Afterwards, based on the thickness of the veneer as a function of its length and bi
values, the depth of each check is calculated. Intervals Ii between neighbor checks are calculated
by simple subtraction of x-positions of neighbor checks’ bottoms. These results are provided in form of raw data as well as a simple statistic summary containing: average, standard deviation and histograms of both depth and interval of the checks.
Results and discussion
The system was used for measuring lathe checks generated by beech wood peeling on the experimental peeling microlathe built in Arts et Metiers ParisTech Cluny, France (Butaud et al. 1995). Wood discs were peeled under laboratory conditions to veneers of different thicknesses ranging from 0.7 up to 3 mm (see legend of Figure 11 for more details) with a constant cutting speed of 0.5 m/s. The clearance angle of the newly sharpened cutting knife was set to 0.5° and no pressure bar was used during the experiments.
As can be seen in Figure 10, average depth of lathe checks as well as their average interval increase with veneer thickness. For 0.7 mm thick veneer no checks occurred. When the veneer thickness increases, checks start to appear, first shallow but close to each other (small interval) and then deeper and more distant. For 3 mm veneers, the depth of checks is around 70 % of their thickness and the mean distance between them reaches 3.5 mm. These results are in agreement with research work by Denaud 2007a.
A more detailed analysis of lathe checking of measured veneers contains histograms of depths and intervals. The graphs of Figure 11 show the scatter of results next to images of the veneers. The vertical axis of each graph represents the number of checks of a specific dimension (depth or interval) related to veneer of 1 m length. From Figure 11 it is evident that the number of checks decreases for thicker veneers. The gravity centers of the histogram plots move from the left
3 4 5 6 7 8 9 10 11 12 13 14 15 16 17 18 19 20 21 22 23 24 25 26 27 28 29 30 31 32 33 34 35 36 37 38 39 40 41 42 43 44 45 46 47 48 49 50 51 52 53 54 55 56 57 58 59 60
For Peer Review
hand side to the right with increasing thickness meaning that both average depth and interval increases. The type of scatter for all cases is natural Gaussian.
Conclusion
An effective, high yield and positively verified direct method of lathe checks detection and measurement by using the SMOF device has been developed and presented. The measurement speed is regulated and may go up to 7 m/min imagining veneers of up to 4 mm thickness, with high resolution of 0.01 mm.
The presented system, SMOF, is capable of automatically characterizing the quality, in terms of lathe checking, of long veneers produced on a microlathe at laboratory level.
A complete system containing the device, a PC and a special software may easily provide summarized information on veneer checks (number, average distance, average depth, standard deviations and histograms of both). The report may also include a detailed set of all check positions and depths and more advanced analyses of obtained data.
Acknowledgement
We wish to express our thanks to Conseil Régional de Bourgogne for its financial support given during presented research.
The first author wishes to thank LABOMAP team of ParisTech ENSAM Cluny for all the help provided during this project.
We all appreciate the help of Jakub Sandak from IVALSA Italy.
Part of this work was presented on 3rd International Symposium on Veneer Processing and Products, Shanghai, China, 23-26 Oct 2007 and on 2007 IUFRO All Division 5 Conference, Taipei: Forest Products and Environment - A Productive Symbiosis, October 29th ~ November 2nd, 2007.
Reference list
Butaud J-C, Deces-Petit C, Marchal R (1995), An experimental device for the study of wood cutting mechanisms: the microlathe. Poster Session Proceedings of the 12th International Wood Machining Seminar, October 2-4 1995, Kyoto, Japan: 479-485
Christy AG, Senden TJ, Evans PD (2005) Automated measurement of checks at wood surfaces. Measurement 37: 109–118
Denaud L-E (2006) Vibration and acoustic analyses of peeling (in French). PhD thesis, ENSAM Cluny, France
Denaud L-E, Bléron L, Ratle A, Marchal R (2007a) Online control of wood peeling process: Acoustical and vibratory measurements of lathe checks frequency. Ann For Sci 64: 569–575 Denaud L-E, Bléron L, Ratle A, Marchal R (2007b) On-line measurement of the average lathe checks frequency of peeled veneers. Proceedings of the 3rd International Symposium on Wood Machining, May 21-23 2007, Lausanne, Switzerland: 77-80
DeVallance DB, Funck JW, Reeb JE (2007) Douglas-Fir plywood gluebond quality as influenced by veneer roughness, lathe checks, and annual ring characteristics. Forest Prod J vol. 57 (1/2): 21-28
El Haouzali H, Pałubicki B, Marchal R, Bléron L, Butaud J-C, Cottin F, Diochon J (2007) Peeling of poplar: cultivars and forest stations effects on cutting forces and veneer quality. Proceedings of the 3rd International Symposium on Veneer Processing and Products, 23-26 Oct 2007, Shanghai, China: 65-74
Feihl O (1986) Veneer cutting manual. Forintek Canada Corp., Special publication SP 510, ISBN 0-86488-507-1 3 4 5 6 7 8 9 10 11 12 13 14 15 16 17 18 19 20 21 22 23 24 25 26 27 28 29 30 31 32 33 34 35 36 37 38 39 40 41 42 43 44 45 46 47 48 49 50 51 52 53 54 55 56 57 58 59 60
For Peer Review
7
Koch P (1964) Wood machining processes. The Ronald Press Company, New YorkLandis EN (2004) Toward bridging length scales in the fracture mechanics of wood. Proceedings of the 2nd International Symposium on Wood Machining, Properties of Wood and Wood
Composites Related to Machining, July 5 -7 2004, Vienna, Austria: 303-314
Leney L (1960a) Mechanism of veneer formation at the cellular level, Research Bulletin 744 College of Agriculture, University of Missouri, 111 p.
Leney L (1960b) A photographic study of veneer formation. Forest Prod. J. vol 10 no. 3:133-139 Lutz JF (1974) Techniques for peeling process, slicing, drying veneer. FPL, Forest Ser. U.S.D.A.: 228
Nagatomi K, Yoshida K, Banshoya K, Murase Y (1999) Relation between veneer quality and peeling sound in the peeling of Sugi. Proceedings of the 13th International Wood Machining Seminar, June 17-20, Vancouver, Canada: 681-690
Ohbayashi H, Momoi T, Tochigi T, Kobayashi J (2007) Observation of crack propagation in wood oa the cellular level considering the occurrence of lathe checks, J. Agric. Sci, Tokyo Univ. Agric., vol 52 no. 1: 39-44
Ohya S, Kitayama S, Kawaguchi M (1989) The effect of veneer quality on the bending strength of laminated wood. Mokuzai Gakkaishi vol. 35, No. 10: 905-911
Pałubicki B, Butaud J-C, Bléron L, Collet R, Marchal R (2007) Development of veneer quality measuring device – SMOF. 3rd International Symposium on Veneer Processing and Products, October 23-26 2007, Shanghai, China,: 161-169
Thibaut B (1988) Le processus de coupe du bois par déroulage, Phd Thesis (in french) Université des Sciences et Techniques du Languedoc, 386 p.
Thibaut B, Beauchene J (2001) Some considerations about energetical balance between friction fracture and strains during veneer cutting at different temperature, 15th International Wood Machining Seminar, July 30 - August 1, 2001, Loyola Marymount University, Los Angeles, California, USA: 305-308
Wang J, Biernacki JM, Lam F (2001) Nondestructive evaluation of veneer quality using acoustic wave measurements. Wood Sci Technol vol. 34: 505-516
Abb. 1
Seitenansicht von gerissenen Furnieren unter dem Mikroskop
Abb. 2
SMOF-Apparat
1 Furnier
2 Durchbiegungsmessung,
3 LVDT-Sensor zur Dickenmessung
4 Elastisches Vorschubband,
5 Biegerolle
Abb. 3
Empfohlene Rollendurchmesser zum Biegen von feuchten Buchenfurnieren
Abb. 4
Belichtungsanordnung. Seitlich projizierter Laserstrahl deckt das Bildfeld der
Zeilenkamera nur auf einer Fläche ab – nämlich der Seitenfläche des untersuchten
Furniers. Dies ergibt ein klares und sehr kontrastreiches Bild 324x240mm
Abb. 5
Blockdiagramm des Algorithmus zur automatischen Risserkennung; die grauen
Felder bezeichnen veränderbare Parameter bei halbautomatischer Betriebsart
159x144mm
Abb. 6
3 4 5 6 7 8 9 10 11 12 13 14 15 16 17 18 19 20 21 22 23 24 25 26 27 28 29 30 31 32 33 34 35 36 37 38 39 40 41 42 43 44 45 46 47 48 49 50 51 52 53 54 55 56 57 58 59 60For Peer Review
Bild mit verringerter Auflösung des Furniers zur Bestimmung des
interessierenden Bereichs (ROI) und der ungefähren Position der Risse in einer
vorgegebenen Furniertiefe (10% der Dicke h`)
Abb. 7
Holzgewebebrücken, die die Rissanalyse behindern
Abb. 8
Einfluss der abschließenden Auswertungsstufe; Bild a) vor dieser Stufe und b)
nach dieser Stufe mit einem Kern von 2x2 Pixeln und c) von 5x5 Pixeln (zur
Verdeutlichung sind bei b) und c) kleine Partikel und der untere Bereich entfernt)
Erklärung zu den Ziffern im Text
Abb. 9
Ausgewertetes Bild eines gerissenen Furniers mit Angabe der ermittelten
Rissenden
Abb. 10
a) Mittlere Tiefe und b) Abstand von Rissen in unterschiedlich dicken
Buchenfurnieren
Abb. 11
Risse in unterschiedlich dickem Buchenholzfurnier: a) 0,7mm, b) 1mm, c)
1,5mm, d) 2 mm, e) 2,5mm, f) 3mm und zugehörige Balkendiagramme (Risstiefe
und Rissabstände bezogen auf eine Furnierlänge von 1m) der Risstiefe (in % der
Dicke) und der Rissabstände
3 4 5 6 7 8 9 10 11 12 13 14 15 16 17 18 19 20 21 22 23 24 25 26 27 28 29 30 31 32 33 34 35 36 37 38 39 40 41 42 43 44 45 46 47 48 49 50 51 52 53 54 55 56 57 58 59 60
For Peer Review
Fig.1 Lateral view of checked veneers under the microscope 202x91mm (96 x 96 DPI) 3 4 5 6 7 8 9 10 11 12 13 14 15 16 17 18 19 20 21 22 23 24 25 26 27 28 29 30 31 32 33 34 35 36 37 38 39 40 41 42 43 44 45 46 47 48 49 50 51 52 53 54 55 56 57 58 59 60
For Peer Review
Fig. 2 SMOF device 361x241mm (72 x 72 DPI) 3 4 5 6 7 8 9 10 11 12 13 14 15 16 17 18 19 20 21 22 23 24 25 26 27 28 29 30 31 32 33 34 35 36 37 38 39 40 41 42 43 44 45 46 47 48 49 50 51 52 53 54 55 56 57 58 59 60
For Peer Review
Fig. 3 Recommended pulley diameters for wet beech veneer bending 74x59mm (600 x 600 DPI) 3 4 5 6 7 8 9 10 11 12 13 14 15 16 17 18 19 20 21 22 23 24 25 26 27 28 29 30 31 32 33 34 35 36 37 38 39 40 41 42 43 44 45 46 47 48 49 50 51 52 53 54 55 56 57 58 59 60
For Peer Review
Fig. 4 Illumination setup. Laterally projected laser line covers linear field of view of camera only at one plane – at the side surface of inspected veneer. It results in clear and highly contrasted image
324x240mm (74 x 74 DPI) 3 4 5 6 7 8 9 10 11 12 13 14 15 16 17 18 19 20 21 22 23 24 25 26 27 28 29 30 31 32 33 34 35 36 37 38 39 40 41 42 43 44 45 46 47 48 49 50 51 52 53 54 55 56 57 58 59 60
For Peer Review
Fig. 5 Block diagram of algorithm used for automatic lathe check detection; the gray blocks represent parameters adjustable in semi-automatic mode
159x144mm (600 x 600 DPI) 3 4 5 6 7 8 9 10 11 12 13 14 15 16 17 18 19 20 21 22 23 24 25 26 27 28 29 30 31 32 33 34 35 36 37 38 39 40 41 42 43 44 45 46 47 48 49 50 51 52 53 54 55 56 57 58 59 60
For Peer Review
Fig. 6 Rescaled image of veneer used for Region Of Interest (ROI) extraction and coarse positions of checks determination at the specified depth of veneer – 10% of its thickness (h’)
176x86mm (72 x 72 DPI) 3 4 5 6 7 8 9 10 11 12 13 14 15 16 17 18 19 20 21 22 23 24 25 26 27 28 29 30 31 32 33 34 35 36 37 38 39 40 41 42 43 44 45 46 47 48 49 50 51 52 53 54 55 56 57 58 59 60
For Peer Review
Fig. 7 Wood tissue bridges hampering check analysis 558x352mm (72 x 72 DPI) 3 4 5 6 7 8 9 10 11 12 13 14 15 16 17 18 19 20 21 22 23 24 25 26 27 28 29 30 31 32 33 34 35 36 37 38 39 40 41 42 43 44 45 46 47 48 49 50 51 52 53 54 55 56 57 58 59 60
For Peer Review
Fig. 8a The effect of closing operation: image before closing operation (a), after closing operation made by kernel of 2x2 pixels (b) and 5x5 pixels (c) (for clarity both (b) and (c) shown after
removing small and bottom particles) 422x156mm (72 x 72 DPI) 3 4 5 6 7 8 9 10 11 12 13 14 15 16 17 18 19 20 21 22 23 24 25 26 27 28 29 30 31 32 33 34 35 36 37 38 39 40 41 42 43 44 45 46 47 48 49 50 51 52 53 54 55 56 57 58 59 60
For Peer Review
Fig. 8b The effect of closing operation: image before closing operation (a), after closing operation made by kernel of 2x2 pixels (b) and 5x5 pixels (c) (for clarity both (b) and (c) shown after
removing small and bottom particles) 422x153mm (72 x 72 DPI) 3 4 5 6 7 8 9 10 11 12 13 14 15 16 17 18 19 20 21 22 23 24 25 26 27 28 29 30 31 32 33 34 35 36 37 38 39 40 41 42 43 44 45 46 47 48 49 50 51 52 53 54 55 56 57 58 59 60
For Peer Review
Fig. 8c The effect of closing operation: image before closing operation (a), after closing operation made by kernel of 2x2 pixels (b) and 5x5 pixels (c) (for clarity both (b) and (c) shown after
removing small and bottom particles) 422x155mm (72 x 72 DPI) 3 4 5 6 7 8 9 10 11 12 13 14 15 16 17 18 19 20 21 22 23 24 25 26 27 28 29 30 31 32 33 34 35 36 37 38 39 40 41 42 43 44 45 46 47 48 49 50 51 52 53 54 55 56 57 58 59 60
For Peer Review
Fig. 9 Resulting image of checked veneer with overlaid detected checks’ bottoms 197x94mm (300 x 300 DPI) 3 4 5 6 7 8 9 10 11 12 13 14 15 16 17 18 19 20 21 22 23 24 25 26 27 28 29 30 31 32 33 34 35 36 37 38 39 40 41 42 43 44 45 46 47 48 49 50 51 52 53 54 55 56 57 58 59 60
For Peer Review
Fig. 10a Average depth (a) and interval (b) of lathe checks occurred in beech veneers of different thickness 99x80mm (600 x 600 DPI) 3 4 5 6 7 8 9 10 11 12 13 14 15 16 17 18 19 20 21 22 23 24 25 26 27 28 29 30 31 32 33 34 35 36 37 38 39 40 41 42 43 44 45 46 47 48 49 50 51 52 53 54 55 56 57 58 59 60
For Peer Review
Fig. 10b Average depth (a) and interval (b) of lathe checks occurred in beech veneers of different thickness 99x80mm (600 x 600 DPI) 3 4 5 6 7 8 9 10 11 12 13 14 15 16 17 18 19 20 21 22 23 24 25 26 27 28 29 30 31 32 33 34 35 36 37 38 39 40 41 42 43 44 45 46 47 48 49 50 51 52 53 54 55 56 57 58 59 60
For Peer Review
Fig. 11 Lathe checks of the beech wood veneer of different thickness: 0.7 mm (a), 1 mm (b), 1.5
mm (c), 2 mm (d), 2.5 mm (e), 3 mm (f), presented together with histograms (number of check
occurrences on 1 m long veneer) of lathe checks depths (in % of thickness) and intervals
0 100 200 300 0,5 1 1,5 2 2,5 3 3,5 4 0 100 200 300 0,5 1 1,5 2 2,5 3 3,5 4 0 100 200 300 10 20 30 40 50 60 70 80 Check depth (%) 0 100 200 300 0,5 1 1,5 2 2,5 3 3,5 4 0 100 200 300 0,5 1 1,5 2 2,5 3 3,5 4 0 100 200 300 0,5 1 1,5 2 2,5 3 3,5 4 0 100 200 300 0,5 1 1,5 2 2,5 3 3,5 4 0 100 200 300 10 20 30 40 50 60 70 80 Check interval (mm) a) b) f) c) e) d) 0 100 200 300 10 20 30 40 50 60 70 80 0 100 200 300 10 20 30 40 50 60 70 80 0 100 200 300 10 20 30 40 50 60 70 80 0 100 200 300 10 20 30 40 50 60 70 80 3 4 5 6 7 8 9 10 11 12 13 14 15 16 17 18 19 20 21 22 23 24 25 26 27 28 29 30 31 32 33 34 35 36 37 38 39 40 41 42 43 44 45 46 47 48 49 50 51 52 53 54 55 56 57 58 59 60