HAL Id: hal-02433891
https://hal.archives-ouvertes.fr/hal-02433891
Submitted on 9 Jan 2020
HAL is a multi-disciplinary open access
archive for the deposit and dissemination of
sci-entific research documents, whether they are
pub-lished or not. The documents may come from
teaching and research institutions in France or
abroad, or from public or private research centers.
L’archive ouverte pluridisciplinaire HAL, est
destinée au dépôt et à la diffusion de documents
scientifiques de niveau recherche, publiés ou non,
émanant des établissements d’enseignement et de
recherche français ou étrangers, des laboratoires
publics ou privés.
V. Vallet, C. Vaglio-Gaudard, C. Carmouze
To cite this version:
V. Vallet, C. Vaglio-Gaudard, C. Carmouze. Application of the bias transposition method on PWR
decay heat calculations with the DARWIN2.3 package. GLOBAL 2017 International Nuclear Fuel
Cycle Conference, Sep 2017, Seoul, South Korea. �hal-02433891�
Application of the bias transposition method on PWR decay heat
calculations with the DARWIN2.3 package
V. Vallet, C. Vaglio-Gaudard, C. Carmouze
CEA, DEN
13108 Saint Paul Lez Durance, France Email: vanessa.vallet@cea.fr
Abstract – An accurate estimation of the decay heat associated with controlled bias and uncertainty is of paramount importance for the design and the operation of future and current reactors as well as for the back- end cycle. The DARWIN2.3 package, dedicated to the characterization of spent fuels from reactors, benefits from the Verification, Validation and Uncertainty Quantification process. The goal of this paper is to illustrate how to exploit the corpus of integral experimental values for the decay heat though the bias transposition method in order to improve the accuracy of the decay heat calculations for industrial PWR reactors. In particular, parametric studies are conducted on the decay heat time dependence and discharge burn-up.
I. INTRODUCTION
The DARWIN2.3 package is dedicated to the characterization of spent fuels from reactors in terms of decay heat, material balance, activity, radiotoxicity and neutron, α, β, γ sources and spectra [1]. The DARWIN2.3 package benefits from a Verification, Validation and Uncertainty Quantification process (V&V/UQ) [2]. Calculation scheme’s biases and uncertainties should be quantified at the validation stage. The experimental validation helps quantifying bias and uncertainties due to nuclear data in the experimental domain. The UQ consists in the estimation of biases and uncertainties associated to the parameters calculated by the DARWIN2.3 package on the whole field of applications needed for current and future fuels of industrial reactors. The field of application is often larger than the domain of experimental validation.
The UQ stage is based on transposition applications when experimental data are available and on uncertainty propagation of nuclear data covariances otherwise. It must be emphasized that the uncertainty propagation strongly depends on the disponibility and quality of the covariance matrices at our disposal. The quality of the covariances is a matter for debate.
The UQ for the decay heat calculations of pressurized water reactor (PWR) with the DARWIN2.3 package is a work in progress. The experimental validation report of the DARWIN2.3 package for the decay heat is currently restricted to PWR UOX fuels and very limited in terms of
cooling times. The French experiment MERCI [3] (3.7%
235U, 3500 MWd/t) provides decay heat measurements
from 45 minutes up to 42 days and the Swedish CLAB
experiments [4] (235U enrichment from 2.1% to 3.4%,
burn-up from 20 to 47 GWd/t) provide experimental measures from 4700 days up to 8500 days of cooling. These measures do not cover short cooling times (time range of less than about 30 minutes after fission). Within this time range, the decay heat is of paramount importance for postulated loss-of-coolant accidents and emergency core cooling systems.
The goal of this paper is to make preliminary studies about the way to exploit the actual corpus of integral experimental data through the representativity factor and transposition method in order to improve the accuracy of the decay heat calculation for industrial reactors on the
whole field of application needed.
In this paper, the method implemented in the DARWIN2.3 package to provide a priori uncertainties associated with nuclear data is detailed, followed by the description of the bias transposition method. Then, an illustration of the bias transposition method of the CLAB C/E-1 values is shown in order to assess the bias and uncertainty on the decay heat calculation of a PWR UOX
fuel (3.7% 235U). The limitations of this method with the
CLAB C/E-1 values in terms of cooling times and burn-up is also discussed in the paper.
II. DETERMINATION OF THE A PRIORI UNCERTAINTIES
Recently, a deterministic uncertainty propagation method has been implemented in the DARWIN2.3 package. This method is based on a Taylor series expansion at first order of the integral quantity of interest (Y). The variance of a linear function of uncertain parameters can be written in a matrix form according to the formula (1).
Δ𝑌 = √ 𝑆𝑡 𝑌/𝐷𝐷𝑆𝑌/𝐷 (1)
In this formulation, 𝐷 is the covariance matrix of the uncertain parameters, i.e. the nuclear data (ND) and 𝑆𝑌/𝐷 is the sensitivity matrix of 𝑌 to ND. The ND uncertainties taken into account are the decay data (mean decay energies, decay periods and branching ratios), the independent fission yields and the 1-group cross-sections and their branching ratios. Covariance data are read from the European JEFF-3.1.1 library [5] (for decay data and fission yields) and from the CEA COMAC library [6] (for cross-sections).
The sensitivity profiles are evaluated by direct perturbation of the uncertain input parameters [7]. Currently, the responses of interest are the decay heat, the delayed neutron power, the isotopic concentrations, masses and activities.
II. PRESENTATION OF THE BIAS TRANSPOSITION METHOD
II.A. Description of the bias transposition method
The bias transposition method is based on the nuclear data adjustment theory [7]. The bias transposition method is used in order to transpose an experiment-over-calculation discrepancy (mainly due to nuclear data uncertainties) into a calculation bias. This method also gives the a posteriori uncertainty for an integral response knowing the a priori uncertainty due to nuclear data covariances, the experimental uncertainty and a correlation factor called the representativity [8]. The representativity factor is a correlation factor comparing the sensitivity profiles of two applications regarding to the nuclear data covariances. Its value ranges from 0 to 1. Both the estimation of the repsentativity factor and the a priori uncertainties strongly depends on the quality of the covariance matrices.
Let 𝑅 and 𝐸 be the subscripts referring to a reactor and an experiment. Let 𝑌 be the calculation of an integral quantity (the decay heat in this paper).
𝑆𝑅 is the sensitivity profile of 𝑌 to ND for the reactor
case (2) and 𝑆𝐸 is the sensitivity profile of 𝑌 to ND for the
experimental case (3). 𝑑 refers to an uncertain nuclear data, D is the covariance matrix of ND.
𝑆𝑅= 𝜕𝑌𝜕𝑑𝑅𝑌𝑑 𝑅 (2) 𝑆𝐸= 𝜕𝑌𝐸 𝜕𝑑 𝑑 𝑌𝐸 (3)
The a priori uncertainty due to nuclear data for 𝑌𝑅
(respectively 𝑌𝐸) are given by (4) and (5).
𝐼𝑅= √ 𝑆𝑅𝑡 𝐷𝑆𝑅 (4)
𝐼𝐸= √ 𝑆𝐸𝑡 𝐷𝑆𝐸 (5)
The representativity factor is given by the formula (6).
𝑟𝑅,𝐸= 𝑆𝑅 𝑡 𝐷𝑆 𝐸 √ 𝑆𝑡 𝑅𝐷𝑆𝑅√ 𝑆𝑡 𝐸𝐷𝑆𝐸 (6)
Let 𝑌𝑅∗ be the a posteriori value of 𝑌𝑅.
(𝑌𝑅∗⁄𝑌𝑅− 1) is the calculation’s bias due to nuclear
data covariances, as a function of the experiment over
calculation ratio (𝐸/𝑌𝐸− 1) and its uncertainty 𝜎𝐸, the
representativity 𝑟𝑅,𝐸, and the a priori uncertainties 𝐼𝑅 and
𝐼𝐸 (7). (𝑌𝑅∗−𝑌𝑅 𝑌𝑅 ) = 𝑟𝑅,𝐸 1+𝜎𝐸2 𝐼𝐸2 𝐼𝑅 𝐼𝐸( 𝐸−𝑌𝐸 𝑌𝐸 ) (7)
If the experimental data is accurate with a very small uncertainty and the representativity factor is close to unity,
therefore 𝐼𝑅≅ 𝐼𝐸 and the experiment-over-calculation
discrepancy is directly the calculation bias due to nuclear
data uncertainties of the 𝑌𝑅 calculation.
The a posteriori uncertainty due to nuclear data is given by (8). (𝐼𝑅∗)2= (1 − 𝑟𝑅,𝐸2 1+𝜎𝐸2 𝐼𝐸2 ) (𝐼𝑅2) (8)
The maximum reduction of a priori uncertainty occurs
when 𝑟𝑅,𝐸 = 1 and the experimental uncertainty is small
compared to the a priori uncertainty (𝜎𝐸< 𝐼𝐸).
When the experimental uncertainty and the a priori uncertainty are quite similar, the expected reduction is a factor 0.7.
II.B. Condensation of the covariance matrices of the cross-sections
The tool at our disposal for the calculation of the sensitivity profiles inherits from the DARWIN2.3 package way of dealing with the Boltzmann/Bateman coupling. First, a precise neutronic calculation on a 2D fuel assembly is performed with the APOLLO2 lattice transport code [10]. At the end, an archive file (called SAPHYB) containing all the multigroup cross-sections and neutronic spectra is created. This file is an input data for the precise depletion calculation performed with PEPIN2. Extended filiation chains _ up to 3800 isotopes _ and associated reactions are taken into account [1]. At the beginning of the depletion calculation with the PEPIN2 code, neutronic reation rates are collapsed to 1 group and interpolated according to the irradiation history described in the data set.
The determination of the sensitivity profiles of the decay heat to cross-sections is performed by direct perturbation of the collapsed reaction rates. Therefore the Boltzmann/Bateman coupling is not accurately taken into account in the evaluation of the sensitivity coefficients of the decay heat to the cross-sections. A parallel study has been conducted in order to quantify this approximation. The results show that in the cooling time range of 0.1 second to 30 years, the effect of the coupling can be neglected on the uncertainty propagation process for the
decay heat. Very few isotopes are concerned (235,239U and
239,240,241Pu) and the impact on the decay heat uncertainty is less than 0.3% at one standard-deviation.
This point quantified, the collapsing of the multigroup covariance matrices into 1-group variance is going to be described. The principle is to conserve the reaction rate’s variance. To do so, the formula (1) is applied and results in the formula (9). 𝑐𝑜𝑣(𝜎𝑎, 𝜎𝑏)1𝑔= (𝜏𝑎,𝑖 𝜏𝑎)1≤𝑖≤𝑛𝑔𝑐𝑜𝑣(𝜎𝑎, 𝜎𝑏)𝑛𝑔 𝑡 (𝜏𝑎,𝑖 𝜏𝑎)1≤𝑖≤𝑛𝑔 (9) In (9), the subscripts a and b refer to a neutronic reaction (radiative capture, fission …), σ refers to a cross-section and τ to a reaction rate, n is the number of groups of the multigroup covariance matrix (26 in our particular case). This formula allows conserving the physical information of inter-energy-groups correlations, as well as inter-reactions correlations (for example capture-fission).
It can be understood here that the 1-group covariance matrix of cross-sections depends on the studied case because of the collapsing with the multigroup reactions rates. In order to estimate accurately the representativity
factor, the formula (9) has to be modified into the formula (10) where the collapsing is done with both reaction rates of the experimental case (superscript E) and the reactor case (superscript R). 𝑐𝑜𝑣(𝜎𝑎, 𝜎𝑏)1𝑔= (𝜏𝑎,𝑖 𝜏𝑎) 𝑅 1≤𝑖≤𝑛𝑔𝑐𝑜𝑣(𝜎𝑎, 𝜎𝑏)𝑛𝑔 𝑡 (𝜏𝑎,𝑖 𝜏𝑎) 𝐸 1≤𝑖≤𝑛𝑔 (9)
III. PRESENTATION OF THE CLAB EXPERIMENTS AND THE PWR UOX FUEL
APPLICATION
III.A. Description of the reactor case
The reactor case of interest would be a 17x17 square
lattice assembly with an UOX fuel. The 235U enrichment is
3.7% and the discharge burn-up is 46.5 GWd/t.
III.B. Description of the CLAB experiments
Calorimetric measurements on entire Pressurized Water Reactors (PWR) and Boiling Water Reactors (BWR) assemblies have been done by the SCK society [4]. The PWR assemblies come from the Ringhals 2 (21 measures of 15x15 square lattice assemblies) and Ringhals 3 (15 measures of 17x17 square lattice assemblies) reactor plants.
The measures have been made at long cooling times, between 13 years and 23 years, for the PWR assemblies.
The 235U enrichment ranges from 2.0 to 3.5% and the
burn-up from 33 to 47 GWd/t for the PWR assemblies.
Considering this reactor case, two CLAB measures have been selected: the 5F2 and the 4C4 (see TABLE I).
Among the available measures of 17x17 assemblies
with a 235U enrichment close to 3.7%, the 5F2 assembly is
the one with the shortest cooling time. Therefore the 5F2 will be used for the parametric study of the representativity factor as a function of the cooling time of the PWR application.
The 4C4 is the one with the smallest burn-up among
the 17x17 assemblies with a 235U enrichment close to
3.7%. The 4C4 measure will be used for the parametric study of the representativity factor as a function of the discharge burn-up.
TABLE I
Main characteristics of the 4C4 and 5F2 assemblies Assembly Name 4C4 5F2 235U enrichment [%m HNi] 3.1 3.4 Bore [ppm] 173 430 Burn-up [GWd/t] 33.3 47.3 Cooling time [d] 6572 4724 Power [W] 422.0 714.0
III.B. Evaluation of the uncertainty of (𝐸 𝑌⁄ 𝐸− 1) The measurement uncertainty of the calorimeter is
𝜎𝑀= 2.0% at one standard-deviation.
The other sources of uncertainties in the calculation
are: the fuel temperature (𝜎𝐹𝑇= ±50°𝐶), the moderator
temperature (𝜎𝑀𝑇= ±2°𝐶) and the burn-up of the fuel
(𝜎𝐵𝑈= ±2% ). These three uncertain parameters are
responsible for 𝜎𝐶 = 3.4% of uncertainty at one
standard-deviation on the decay heat estimation with the DARWIN2.3 package.
The quadratic combination of 𝜎𝑀 and 𝜎𝐶 results in the
global uncertainty 𝝈𝑬= 𝟑. 𝟗% at one standard-deviation.
IV. RESULTS AND ANALYSIS
IV.A. Bias transposition of the CLAB-5F2 to the UOX assembly as a function of the cooling time
The main issue with decay heat experiments is that it is difficult to obtain valuable experimental values at short cooling times (before 30 minutes). Therefore one of the questions underlying this study is: will it be possible to have a strong representativity at shorter cooling times than 4724 days?
The study of the main contributors to the decay heat at 4724 days shows that a very few number of isotopes are involved in the decay power of the fuel. At 4724 days of cooling, 13 isotopes are responsible for 99.4% of the total decay heat of the fuel (see TABLE II).
TABLE II
Total contribution of the 13 isotopes to the decay heat of the CLAB-5F2 fuel
Cooling time [days] % of the total decay heat
4724 99.40
4000 99.10
3000 97.70
2000 88.60
1000 64.90
These isotopes are 238,239,240,241Pu, 241Am, 244Cm, 154Eu,
137mBa, 134,137Cs, 90Y, 90Sr and 85Kr. At 1000 days of cooling, these 13 isotopes are responsible for only 65% of the total decay heat. At even shorter cooling times, the number of contributors increases significantly (see Fig. 1).
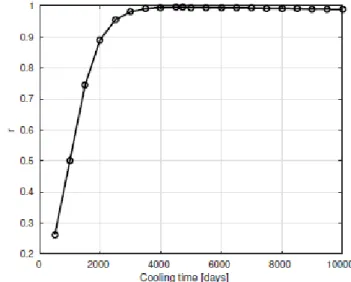
The Fig. 2 shows that the representativity factor drops fastly under 2000 days of cooling, as expected from the study of the main contributors to the decay heat. Therefore it is not consistent to do the transposition at these cooling
times. On the contrary, 𝑟𝑅,𝐸 is close to unity from about
3000 days to 10000 days of cooling. Results are summarized in TABLE III.
At cooling times with 𝒓𝑹,𝑬 ≈ 𝟏 , the a posteriori
uncertainty due to nuclear data covariances is reduced from 3.3% to 2.4% and the bias is assessed to 1.3%.
Fig. 1. Nuimber of decay heat contributors to explain 99% of the total decay heat.
Fig. 2. Representativity factor between the decay heat of the CLAB-5F2 assembly and the UOX fuel assembly.
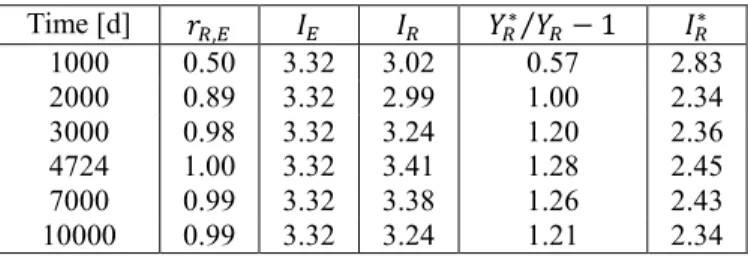
TABLE III
Results of the bias transposition of the UOX assembly as a function of the cooling time
Time [d] 𝑟𝑅,𝐸 𝐼𝐸 𝐼𝑅 𝑌𝑅∗⁄𝑌𝑅− 1 𝐼𝑅∗ 1000 0.50 3.32 3.02 0.57 2.83 2000 0.89 3.32 2.99 1.00 2.34 3000 0.98 3.32 3.24 1.20 2.36 4724 1.00 3.32 3.41 1.28 2.45 7000 0.99 3.32 3.38 1.26 2.43 10000 0.99 3.32 3.24 1.21 2.34
IV.B. Bias transposition of the CLAB-4C4 to the UOX assembly as a function of the burn-up
The representativity as a function of the cooling time has been discussed. The next question up to discussion is the study of the representativity factor as a function of the discharge burn-up of a reactor case.
For this study, the CLAB-4C4 fuel assembly has been chosen because of its small burn-up. The reactor case is still a PWR UOX fuel irradiated from one to four cycles in reactor. The cooling time for the calculations is the one of the experimental measurement, i.e. 6572 days (about 18 years).
Results are summarized in TABLE IV. For the CLAB-4C4 fuel assembly, the experiment-over-calculation
discrepancy of the decay heat 𝐸 𝑌⁄ 𝐸− 1 = 2.4% and the
associated uncertainty is 𝜎𝐸= 3.9%.
The TABLE IV shows that the representativity factor is very high for the four burn-up, even at 12 GWd/t.
Therefore the transposition of the𝐸 𝑌⁄ 𝐸− 1 value to the
different reactor cases helps reducing strongly the a priori uncertainty due to nuclear data. In particular at 12 GWd/t, the a priori uncertainty is about 5% at one standard-deviation. This is a favorable situation, as described in II.A: before the transposition, the bias and uncertainty associated to the reactor case PWR UOX 12GWd/t is 𝟎. 𝟎% ± 𝟓. 𝟎% . After the transposition, the bias and uncertainty are assessed to 𝟏. 𝟒% ± 𝟑. 𝟗%.
TABLE IV
Results of the bias transposition of the UOX assembly as a function of the burn-up of the reactor application
Burn-up [GWd/t] 𝑟𝑅,𝐸 𝐼𝐸 𝐼𝑅 𝑌𝑅 ∗ 𝑌 𝑅 ⁄ − 1 𝐼𝑅∗ 12 0.94 3.63 5.01 1.40 3.86 26 0.98 3.63 4.13 1.20 3.09 38 0.99 3.63 3.63 1.07 2.69 46 0.98 3.63 3.41 0.99 2.55
The Fig. 3 compares the sensitivity profiles of the decay heat to the nuclear data at t=6572 days of cooling for the different discharge burn-up. The sensitivity profiles are quite similar for the four cases. The exceptions are: the
sensitivity coefficients of the fission cross-section of 235U
and the radiative capture cross-section of 238U. As the
discharge burn-up increases, the sensitivity of the decay
heat to the 235U fissions decreases (as well as the
contribution of the 235U fission yields), whereas the
importance of the 238U capture increases (through the
build-up of 239Pu). -0.3 -0.2 -0.1 0 0.1 0.2 0.3 0.4 0.5 0.6 0.7 (Yield ,th )( U2 3 5 ,I 1 3 7 ) (Yield ,th )( U2 3 5 ,Kr 9 0 ) (Yield ,th )( U2 3 5 ,Xe1 3 7 ) ran ch in g (C s1 3 7 ,B a1 3 7 m ) b ran ch in g (I 1 3 7 ,Xe1 3 7 ) b ran ch in g (Kr 9 0 ,R b 9 0 ) b ran ch in g (R b 9 0 m ,S r9 0 ) E n er g y (B a1 3 7 m ) E n er g y (P u 2 3 8 ) En er g y (Y 9 0 ) Per io d (C s1 3 7 ) Per io d (S r9 0 ) XS (n ,f )( U2 3 5 ) XS (n ,g )P u 2 3 9 XS (n ,g )U2 3 8 R elativ e sen sitiv ity co ef ficien t 12 GWd/t 26 GWd/t 38 GWd/t 46 GWd/t
V. CONCLUSIONS
This paper is part of V&V/UQ process of the DARWIN2.3 package for the decay heat calculation of industrial reactors. An illustration of the application of the bias transposition method of two of the CLAB experiments to the decay heat calculation of PWR UOX fuel has been made. The field of application of this method as a function of the burn-up and the cooling time has been assessed through a parametric study of the representativity factor.
As a result, it is consistent to transpose an experiment-over-calculation bias at longer cooling times. Nevertheless it is difficult to apply this method to shorter cooling times because of the strong differences in the decay heat contributors. At 4724 days of cooling (time of the measurement), the prioi bias and uncertainty of the PWR UOX fuel due to nuclear data covariances is 0%±3.4%.
The transposition of the (𝐸 𝑌⁄ 𝐸− 1) value leads to a
posterior bias and uncertainty due to nuclear data: it
reaches 1.3%±2.4%.
For PWR UOX fuels, it is also consistent to transpose an experiment-over-calculation bias at different discharge burn-ups given the cooling times considered here.
Therefore with the (𝐸 𝑌⁄ 𝐸− 1) and 𝜎𝐸 values of the 4C4
fuel assembly, a quantification of the bias due to nuclear data has been made, and the a posteriori uncertainty due to nuclear data covariances has been reduced. At 6572 days of cooling, the prioi bias and uncertainty of the PWR UOX fuel at 12 GWd/t due to nuclear data covariances is
0%±5.0%. The transposition of the (𝐸 𝑌⁄ 𝐸− 1) value of the 4C4 fuel assembly at 33 GWd/t leads to a posterior bias and uncertainty due to nuclear data: it reaches
1.4%±3.9%.
The next step is to extend this study to other parameters of interest for decay heat application, such as the fissile content, the isotopic composition of the fuel, etc. Then, the whole corpus of the CLAB PWR 17x17 data should be used in order to strengthen the a priori uncertainties taking into account the experimental information. Another question for debate would then be which experimental correlations should be considered between experimental data when they come from the same facility with the same experimental protocol?
ACKNOWLEDGMENTS
The authors are indebted to EdF for its financial support.
REFERENCES
[1] L. San Felice, R. Eschbach et P. Bourdot, «Experimental validation of the DARWIN2.3 package for fuel cycle applications,» Nuclear Technology, vol. 184, pp. 217-232, 2013.
[2] C. De Saint Jean, B. Roque, G. Rimpault, P. Archier, J. Vidal, J. Palau, J. Tommasi, Y. Peneliau, B. Fontaine et F. Varaine, «Verification, validation and uncertainty quantification for neutronic calculation for ASTRID fast reactor detailed design,» PHYSOR, Sun Valley, Idaho, USA, 2016.
[3] J. Jaboulay et S. Bourganel, «Analysis of MERCI decay heat measurement for PWR UO2 fuel rod,»
Nuclear Technology, vol. 177 No. 1, pp. 73-82, 2012.
[4] F. Sturek et L. Agrenius, «Measurements of decay heat in spent nuclear fuel at the Swedish interim storage facility CLAB,» SKB report R-05-62, 2006.
[5] A. Santamarina, D. Bernard, P. Blaise, M. Coste, A. Courcelle, T. Huynh, C. Jouanne, P. Leconte, O. Litaize, S. Mengelle, G. Noguere, J. Ruggieri, O. Serot, J. Tommasi, C. Vaglio et J. Vidal, «The JEFF-3.1.1 nuclear data library,» JEFF Report 22, NEA/OECD, 2009.
[6] P. Archier, C. De Saint Jean, G. Noguere, P. Leconte, O. Litaize et C. Bouret, «COMAC: nuclear data covariance matrice library for reactor applications,» PHYSOR, Kyoto, Japan, 2014.
[7] V. Vallet, S. Lahaye, A. Tsilanizara, L. San Felice et R. Eschbach, «Deterministic approach of the decay heat uncertainty due to JEFF-3.1.1 nuclear data uncertainties with the CYRUS tool and the DARWIN-2.3 depletion code,» PHYSOR2014, Kyoto, Japan, 2014.
[8] A. Gandini, «On transposition of experimental reactor data to reference design,» Comitato nazionale per la ricerca e per lo sviluppo dell energia nucleare e delle energie alternative, 1983.
[9] V. Orlov, A. Van'Kov, V. Voropaev, Y. Kazansky, V. Matveev et V. Murogov, «Problems of fast reactor physics related to breeding,» Energy Review, vol. 4, pp. 991-1075, 1980.