Design of a Stable Nanocrystalline Alloy
By
Heather A. Murdoch
B.S. Materials Science and Engineering Purdue University, 2008
SUBMITTED TO THE DEPARTMENT OF MATERIALS SCIENCE AND ENGINEERING IN PARTIAL FULLFILLMENT OF THE REQUIREMENTS FOR THE DEGREE OF
DOCTOR OF PHILOSOPHY IN MATERIALS SCIENCE AND ENGINEERING
AT THE
MASSACHUSETTS INSTITUTE OF TECHNOLOGY
June 2013
C Massachusetts Institute of Technology. All rights reserved Ag
Signature of Author:_________________________
Department of Materials Science and Engineering
FebruaAyl, 2013 Certified by:
Christopher A. Schuh Department Head, Danae and Vasilis Salapatas Professor of Metallurgy
Accepted by:
Gerbrand Ceder Chair, Departmental Committee on Graduate Students
MASSACHUSETTS INSMEifU OF TECHNOLOGY
JUN 0
5 2013
LIBRARIES
Design of a Stable Nanocrystalline Alloy
By Heather A. Murdoch
Submitted to the Department of Materials Science and Engineering on February 21, 2013, in partial fulfillment of the requirements for the degree of Doctor of Philosophy in Materials
Science and Engineering
ABSTRACT
Nanocrystalline materials are inherently unstable due to their high material fraction of grain boundaries, preventing their improved properties from being used in application. To stabilize the nanoscale grain size against rampant growth, past literature has proposed lowering the grain boundary energy through solute segregation to the boundaries. This approach has seen
varied experimental success, using a metric of segregation strength to select an alloying element. In those alloys were some measure of stabilization is gained through alloying, precipitation of a second phase disrupts the necessary segregation state and triggers grain growth. This work considers the total stability of a nanocrystalline alloy - both stability against grain growth and stability against second phase precipitation - by examining the changes in free energy associated
with segregation and nanostructuring. It is discovered that the relationship of segregation and mixing enthalpies for a particular system dictates the nanocrystalline stability of the alloy. Nanocrystalline stability maps are constructed for several conditions that can be used to predict an alloy's ability to support a nanostructure. Also revealed by the generation of stability maps are new types of stable nanocrystalline phases - in addition to the expected nano-phase stabilized by solute decoration of the grain boundary, a solute-rich nanocrystalline phase is expected to be stable under some conditions, as is an amorphous phase. To connect material systems to the results predicted by this work, a new model for the enthalpy of segregation was derived.
Thesis supervisor: Christopher A. Schuh
Acknowledgements
Thanks, first and foremost to my advisor, Chris Schuh, who in addition to improving my skills as a researcher, contributed greatly to my growth as a presenter and writer. Thanks to my
committee, Professor Ceder and Professor Tuller for good advice and challenging questions. Thanks to the members of the Schuh research group for both serious and fun office discussions and support. Thanks to my boyfriend, Matthew D. Haberland, for unwavering support and encouragement. Thanks to all my friends who have enriched my life greatly while at MIT
including my tea and gym partner Sophie, my yoga host Liz, my pen-pal Cynthia, my roommates and baking partners Caroline and Sarah, my companion in running and other adventures
Charlotte, and my wings buddy Mike. And lastly thanks to the steadfast love and support from my family.
Table of Contents
I
ABSTRACT ... 2
Acknowledgem ents...3
List of Abbreviations and Sym bols ... 6
List of Figures ... 7
List of Tables ... 11
1. Introduction ... 12
1.1 Grain growth in pure nanocrystalline m aterials ... 12
1.2 Possible Stabilization...16
1.3 Therm odynam ic approach to stabilization... 17
1.3.1 Atom istic m odeling ... 19
1.3.2 Experim ental application of this approach ... 22
1.3.3 Observations based on existing experim ental and m odeled system s... 41
1.4 Research problem ... 46
2. Regular Nanocrystalline Solution M odel ... 47
2.1 Construction of Free Energy function ... ... ... 47
2.2 The Free Energ y Surface ... 51
2.3 Com parison of Nanocrystalline Free Energies... 53
2.4 Com plete Free Energy Picture ... 57
2.5 Conclusions of this Chapter ... 60
3. Conditions for Com plete Nanocrystalline Stability ... 61
3.1 Positive Enthal py System s ... 61
3.1.1 Sym m etric system s (Equal Oty/t) ... 61
3.1.2 Recastin g of axes ... 63
3.1.3 Delineations of Stability Regions...65
3.1.4 Tem perature ... 66
3.1.5 Non-sym m etric (Unequal f2y/t)... ... ... 68
3.2 Negative Enthalpy of M ixing ... 70
3.3 Types of Stable Nanostructures Predicted ... 74
3.3.1 "Classical" Stable Nanocrystalline ... 74
3.3.2 Am orphous Lim it...78
3.3.4 Amorphous and Dual-phase ... 82
3.3.5 Discussion of stability...83
3.4 M etastable structures ... 88
3.4.1 M etastability when AHmi>0 ... 88
3.4.2 Locally m etastable ... 90
3.4.3 Locally dual-phase m etastable ... 90
3.5 Conclusions of this chapter...91
4. Placem ent of Alloys on M aps: Enthalpy Calculations ... 92
4.1 Enthalpy of M ixing ... 93
4.2 Enthalpy of Segregation...98
4.2.1 Critical examination of existing segregation models ... 98
4.2.2 New m odelfor grain boundary segregation enthalpy...101
4.3 Comparison to existing segregation data and m odels...107
4.4 Populating nanocrystalline stability m aps ... 109
4.6 Conclusions of this Chapter ... 111
5. Connections to M aterials Systems...112
5.1' Previous experimental binary alloys...112
5.2 Tungsten based alloys ... 117
5.2.1 Tungsten alloy nanocrystalline stability m ap ... 118
5.2.2 Dual-phase analysis ... 120
5.3 Conclusions of this Chapter ... 124
6. Conclusions ... 125 6.1 Summ ary ... 125 6.2 Contributions...127 6.3 Future Directions ... 127 References ... 129 Appendix A...139 Appendix B...200
List of Abbreviations and Symbols
APFIM Atom probe field ion microscopy
BCC Body centered cubic
DSC Differential scanning calorimetry
ECAE Equal channel angular extrusion
EDS Energy-dispersive X-ray spectroscopy
EELS Electron energy loss spectroscopy
FCC Face centered cubic
GB Grain boundary
GFR Glass forming range
HCP Hexagonal closest packed
MA Mechanical alloying
NC Nanocrystalline
NM Nanometer
RNS Regular nanocrystalline solution
TEM Transmission electron microscopy
XRD X-ray diffraction
fgb Fraction of grain boundary region
y Grain boundary energy
s S Surface energy k Boltzmann's constant Q Atomic volume R Gas constant T Temperature
Tcr Critical temperature - apex of miscibility gap
Tm Melting temperature
t Grain boundary thickness
v Transitional bond fraction
awe Grain interior/crystal interaction parameter (0gb Grain boundary interaction parameter
X Global solute composition
Xc Solute composition in the grain interior, or crystal
Xgb Solute composition in the grain boundary
List of Figures
Figure 1.1 Grain growth for pure nc-metals Ni [11], Cu [13], Fe [14], Pd [15], Cr [16]. Figure 1.2 Rampant grain growth in electrodeposited nanocrystalline nickel - significant grain growth after only 10 minutes of annealing at 0.2Tm and out of the nanocrystalline regime
by 30 minutes (not pictured).
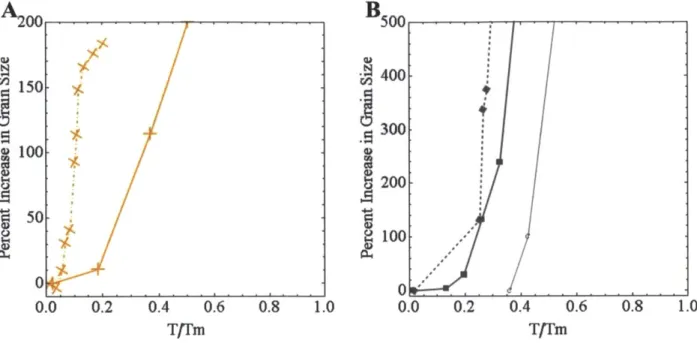
Figure 1.3 Differences in grain growth due to processing methods in nc-Cu (A) and nc-Fe (B). Dashed lines were electrodeposited [17] [19], solid lines were mechanically alloyed [13] [14]. Points indicated by "C" were cryo-milled [26].
Figure 1.4 Illustration of thermodynamic approach to grain size stabilization, with the red curve showing the increase in free energy due to increased GB area (decrease in grain size). The blue curve shows the potential of solute segregation to lower the free energy, creating a local minimum stable with respect to variations in grain size.
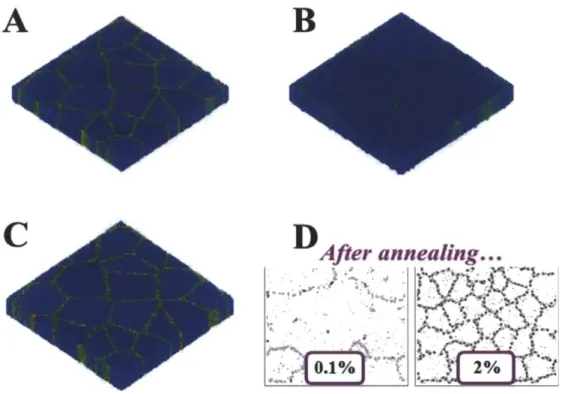
Figure 1.5 MD simulations of nanocrystalline copper without dopants (A) and subject to an annealing process resulting in grain growth (B). The addition of dopants - red atoms in (C) results in no appreciable grain growth after the same anneal. From [33]. (D) Molecular Dynamics simulations of varied concentrations of dopants (black atoms) in copper after the same annealing treatment. Image adapted from [32].
Figure 1.6 Grain growth curves for experimentally studied iron-based nanocrystalline alloys. Data is taken from Fe-Al [26], Fe-Zr [49], Fe-Ta [49], Fe-Cu [50], Fe-Ni: electrodeposited[51] MA [52], Fe-Ag[53], Fe-Cr [54].
Figure 1.7 Grain growth curves for Fe-based systems re-plotted to show grain growth relative to initial grain size of the particular system. The data sources are the same as Fig. 1.6. Figure 1.8 Grain growth in experimental copper-based nanocrystalline alloys. Data is from: Cu-Zr [48], Cu-Fe [50], Cu-W [60], Cu-Ag [61], Cu-Nb [62], Cu-Bi electrodeposited [63] and gas-deposited [18].
Figure 1.9 Grain growth in nc-nickel-based alloys. Data is presented from: Ni-Co [69], Ni-W
[70], Ni-Fe - 20% [71], 45% [72], Ni-Mn [73], Ni-Cu [12], Ni-P [74], pure Ni [11].
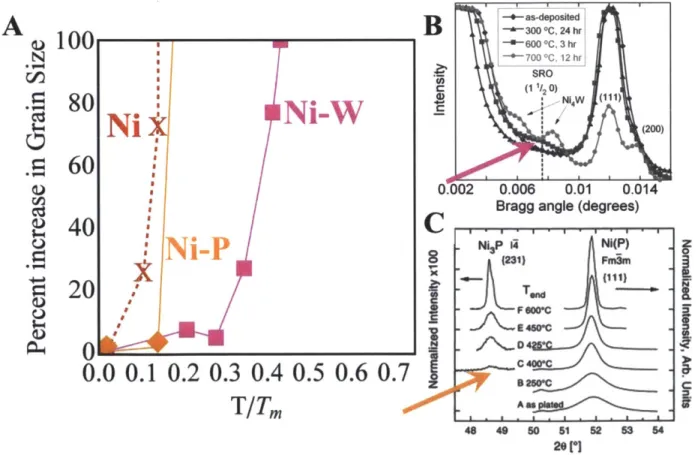
Figure 1.10 Grain growth in Pd alloys: pure nc-Pd [15], Pd-Fe [87], Pd-Y [84], Pd-Zr [47]. Figure 1.11 Second phase precipitation connected directly to grain growth in two example ne-Ni systems; (B) Appearance of short range order in ne-Ni-W heralding rapid grain growth. Figure from [78] (C) Appearance of Ni3P phase triggering rapid grain growth, figure from [79]
Figure 2.1 Schematic of two nanocrystalline grains with GB segregation, viewed
equivalently as an array of atoms (left) or as a continuum (right). On the left, solvent atoms are in gray; solute, red. GB thickness, t, and characteristic size, d, are depicted on the left, as are the interaction parameters associated with the various bonds. Figure from [112].
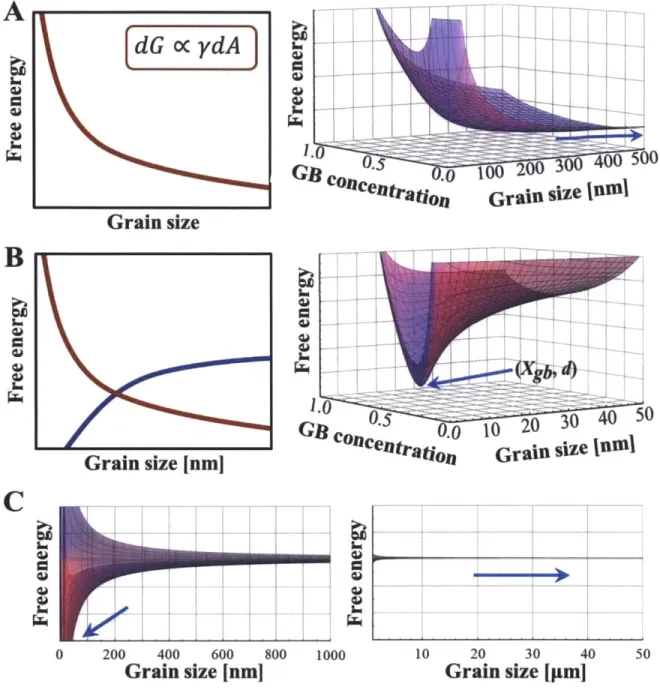
Figure 2.2 (A) A schematic of the increase in free energy caused by a decrease in grain size,
followed at right by a free energy surface reflecting the same; the free energy surface has a trivial minimum that falls back to the free energy of a regular solution (blue arrow), showing that segregation is not effective at lowering GB energy or total energy in this case. (B) Segregation can mitigate the effect of grain size on free energy via the schematic on the left, blue curve. This creates a minimum in the free energy surface, as seen at right, at a particular grain size and segregation distribution where the GB energy is zero.
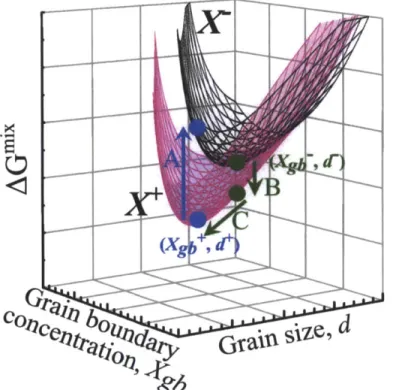
Figure 2.3 Minima in the free energy surface for two global solute concentrations, X+ (magenta curve) and X- (black curve). Arrow A (blue) describes the rapid increase in free energy from holding the minimum Xgb+ and d+ values constant, while decreasing global composition
X+ -+ X-. In the other direction, arrow B (green) shows the decrease in free energy from holding
Xgb- and d- constant while increasing global composition X- -+ X+; however, the free energy can be reduced further (arrow C) by falling to the (Xgb+,d+) minimum. Figure from [112].
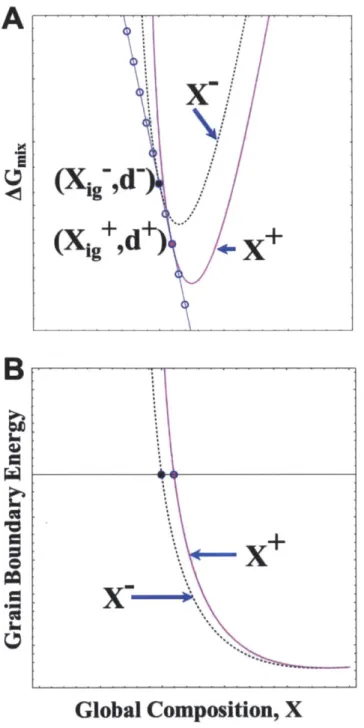
Figure 2.4 (A) The minimum (Xgb, d) points from the two compositions presented in Fig. 2.3
are presented by black (X-) and magenta (X+) points; minima of other compositions are presented by blue points. The variation in free energy with respect to changes in composition while maintaining (Xgb, d) of the minima are plotted as a black, dashed curve for X- and magenta curve for X+. The GB energy as a function of this variation is shown in (B).The GB energy is zero at the minimum (Xg, d) pair. Figure from [112].
Figure 2.5 The free energy of the nanocrystalline phases, as represented by their minimum point and the U-shaped curve, can be stable (green), metastable (yellow), or not stable (red) compared to the free energy of the bulk phase. In this case, that of a system with a miscibility gap, the stable phases are denoted by the common tangent (dashed black line) of the regular solid
solution (solid black line).
Figure 2.6 The free energy of the nanocrystalline phases, as represented by their minimum point and the U-shaped curve, can be stable (green), metastable (yellow), or not stable (red) compared to the free energy of the bulk phase. In the case of a system with an ordered compound (denoted A3B, and by a solid black point), the stable phases are those whose free
energy falls below the common tangent (dashed black line) of the regular solid solution (solid black line) and the line compound.
Figure 3.1 Example map of parameter combinations in the (oc , ogb) space - each point represents the full composition range for that parameter set, an example shown on the far right
for each of three possibilities - not stable (red) , metastable (yellow), and stable (green). Each blue point is the minimum for that composition's free energy surface, shown to the left of the
free energy - composition plot. For metastable cases, the minimum falls above the common tangent of the regular solution (represented by black dashed line); stable, below it.
Figure 3.2 Design map for the fraction 0.35 of critical temperature (absolute temperature shown across top) with enthalpic axes. Regions of stability are denoted by color (green: stable, yellow: metastable, red: not stable) and label.
Figure 3.3 Nanocrystalline stability maps and their accompanying figure of merits for five fractions of the critical temperature.
Figure 3.4 Free energy function of regular solution at different temperatures showing diminishing region of metastability.
Figure 3.5 Stability map for 1000K, AH"nx>0.
Figure 3.6 Stability maps for MAyA # BYB . (A) the GB energy - atomic volume constant for the solvent is lower than that of the solute (B) the GB energy - atomic volume constant for the solute is lower
Figure 3.7 Comparison of free energy for stability conditions in a compound forming system. Both plots have a A3B compound in the system in addition to a solid solution (thick black curve),
but in the schematic (A), the compound has a free energy of -30 kJ/mol, as compared to -50 kJ/mol in (B). A NC phase that is stable in (A), as depicted by green dot, is no longer stable in (B) due to the lower free energy of the A3B compound.
Figure 3.8 Stability map for Negative mixing enthalpy systems at 1000K. The region of metastability is defined by the free energy of the A3B intermetallic compound, listed on the right
of the stability map.
Figure 3.9 "Classical" stability - the nanocrystalline phases in blue are lower in free energy than the common tangent of the regular solution (black curve). (A) presents the whole
composition range, (B) the lower composition limit of stabilized nanostructures, starting at the solubility limit of the regular solution. (C) the upper limit of composition, characterized by the
limit Of Xgb-d space(see text). Image adapted from [112].
Figure 3.10 Grain size versus global composition for the stable "classical" nanocrystalline system shown in Figure 3.9. Image adapted from [112].
Figure 3.11 Free energy plot of a system in which the amorphous limit is the lowest energy phase. Amorphous Limit is depicted by the green dashed line, nanocrystalline compounds in blue, and bulk regular solution in black. Image from [112].
Figure 3.12 Dual-phase stable nanostructure: (A) free energy plot (B) free energy surface, showing two minima (C) schematic of the grain structure. Image adapted from [112].
Figure 3.13 Dual-phase (solvent-rich points in blue and solute-rich points in open red squares) and Amorphous (green dot-dashed line) stable. Thin black common tangent lines represent the equilibrium phase fields. Image from [112].
Figure 3.14 Nanocrystalline stability map for T=0.35Tcr; the stable nanocrystalline region is divided into subsections describing the various types of possible stable nanocorystallline structures. Image from [112].
Figure 3.15 Nanocrystalline stability map for 1000K for compound forming systems with A3B
compound. The stable region is subdivided into stable amorphous and stable dual-phase.
tangent (dashed purple line). (B) Grain size as a function of composition in this example system.
(C) Free energy curves if the minimum values of (Xgb, d) and held constant for two different composition free energy surfaces. (D) GB energy as a function of composition for two
compositions, holding their minimum values of Xgb and d constant. Minimum values have a GB
energy of zero. Image adapted from [112].
Figure 3.17 Local Metastability in AH"ix <0 systems: (A) an example free energy surface with a local minimum (B) The relationship of the local minimum to other phases.
Figure 4.1 Calculated enthalpies of mixing for a wide range of binary systems
Figure 4.2 Enthalpies calculated using Miedema model inputs to Eq. (4.9) and AH'"ix Eq (4.1).
Figure 4.3 Segregation enthalpies for a wide range of binary alloys
Figure 4.4 A comparison of our segregation model, AIHe , with the Hondros-Seah model
(AH s ) and elastic-only enthalpy (AH ye).
Figure 4.5 Predictions of nanocrystalline stability for a wide range of binary alloys using the models for segregation and mixing enthalpy discussed in this chapter.
Figure 5.1 Tungsten alloy nanocrystalline stability map at 1 100 C. Figure from [136]. Figure 5.2 Free energy surface and free energy plot for W-Ti at 400K
Figure 5.3 Free energy plot and common tangent construction for W-Ti at 1 100 C
Figure 5.4 Phase diagram for W-Ti taking into account the nanocrystalline phases; the bulk two phase region is in hatched red/blue. Nanocrystalline two-phase region is delineated by black lines. (A) pure W after anneal (B)W-5%Ti after anneal (C) W-20%Ti after anneal. Micrographs courtesy Tongjai Chookajom.
List of Tables
Table 1.1 Iron-based alloys ranked in order of experimentally observed thermal stability, from most delay in grain growth to least. Traditional metrics for predicting efficacy of solute for stabilization (elastic mismatch, radius difference, segregation strength via solubility) are shown for comparison to actual experimental stability. Thermal stability of alloys in italics are those not depicted on the grain size versus temperature curves.
Table 1.2 Copper-based alloys ranked in order of experimentally observed thermal stability, from most delay in grain growth to least. Traditional metrics for predicting efficacy of solute for stabilization (elastic mismatch, radius difference, segregation strength via solubility) are shown for comparison to actual experimental stability. Thermal stability of alloys in italics are those not depicted on the grain size versus temperature curves.
Table 1.3 Nickel-based alloys ranked in order of experimentally observed thermal stability, from most delay in grain growth to least. Traditional metrics for predicting efficacy of solute for
stabilization (elastic mismatch, radius difference, segregation strength via solubility) are shown for comparison to actual experimental stability. Thermal stability of alloys in italics are those not depicted on the grain size versus temperature curves.
Table 2.1 Bonds in the RNS model
Table 3.1 Constants for the Stability Figure of Merit when 2AyA # BYB
Table 3.2 Example concentration distribution, grain size, and free energy for an example classical stable nanostructure with AHmix>O
Table 3.3 Example concentration distribution, grain size, and free energy for an example
Dual-phase nanostructure: AHmX>O
Table 3.4 Example concentration distribution, grain size, and free energy for an example Dual-phase nanostructure: AHmiX<O
Table 3.5 Example concentration distribution, grain size, and free energy for example classical nanostructure: AHmx<O where the nanocrystalline structures are higher in free energy than the Amorphous Limit
Table 4.1 Miedema Model Enthalpy of Mixing Terms
Table 4.2 Quantitative Literature Segregation Enthalpy Values Table 5.1 Experimental Nanocrystalline Alloys (AH"ix>O) Table 5.2 Experimental Nanocrystalline Alloys (AHI'x<O)
Table 5.3 Summary of values for W-Ti calculations, including the enthalpy of segregation range. Table adapted from [136].
1.
Introduction
1.1 Grain growth in pure nanocrystalline materials
Nanocrystalline (nc) metals promise unique and improved properties, such as high wear strength [1, 2], corrosion resistance[3, 4], and enhanced thermoelectric performance [5]. These gains are unfortunately mitigated by their inherent instability which is due to the excess energy associated with their high volume fraction of grain boundaries (GBs). There is, therefore, a significant driving force for grain growth, even at relatively low temperatures. Nanocrystalline copper [6-8], silver [8], palladium [9], and aluminum [10] have all presented grain growth out of the nanoscale regime while at ambient conditions; this room-temperature growth was observed despite differences in processing methods. For example, nc-copper prepared by
gas-condensation showed an increase of 20nm in grain size over a period of two weeks, and micron sized grains were observed (amidst nanocrystalline regions) after one month in all nc-Cu samples regardless of processing conditions [6]. A second study of nc-Cu using the gas-condensation method also observed abnormal grain growth leading to several micron-sized grains after a few days at room temperature [7]. Additionally, electrodeposited copper with differing initial grain sizes (-10 or ~40nm) both grew to exceed 100nm in size after 30 hours at room temperature [8]. In this same study, electrodeposited nc-Ag also exhibited grain growth past 1 00nm from an initial grain size of-25nm after a day at room temperature [8]. Gas-condensed nc-Pd doubled in grain size after 12 hours at ambient conditions, and many micron-sized grains were observed after 2 months [9]. The grain size of nc-Al produced by chemical synthesis also doubled at room temperature, and after only 1 hour [10].
Moving beyond problematic room temperature performance, the behavior of several pure nanocrystalline metals with respect to annealing treatments of approximately one hour
(represented as a fraction of material melting temperature) is shown in Fig. 1.1. By a
homologous temperature of 0.2Tm (if not earlier), only one hour of heat treatment leads to a
sharp increase in grain size. While room temperature grain growth is observed in [8] for Al and Cu, a similar electrodeposited nickel film was found to be stable under ambient conditions. In another study, electrodeposited nc-Ni was found to be stable at room temperature for over one year, and at 370K (0.07Tm) for over one week [11] .However, at higher temperatures, grains
showed significant growth; the response of the deposited nc-Ni to one hour anneals at several temperatures is shown in Fig. 1.1. A similar trend of rapid growth is observed after three hour
anneals in another electrodeposited study [12].
200
150
100
50
0
0.0
0.2
0.4
*
Ni
+
Cu
Fe
Cr
*Pd
0.6
T/Tm
Figure 1.1 Grain growth for pure nc-metals Ni [11], Cu [131, Fe [141, Pd [151, Cr [16].
N C(2 '-S
s-S
U Us-S
0.8
1.0
In the case of pure copper, a mechanically alloyed (MA) sample is annealed for one hour
[13], with a slightly better response than nc-Ni (Fig. 1.1), but still a very poor response. Ramped DSC anneals in electrodeposited nc-Cu [17] (shown in Fig. 1.3) and four hour anneals in
gas-deposited nc-Cu [18] also show poor resistance to grain growth. Mechanically alloyed nc-Fe doubles in grain size after an eighty minute anneal at just ~20% of the melting temperature
(300'C) [14]. Electrodeposited iron [19] (annealed for 150 minutes) and other mechanical
alloying studies [20] annealed for varying times do not demonstrate any improvement in
stability. Exhibiting very poor nanocrystalline stability is electrodeposited palladium [15] which had been annealed for one hour. The growth of nc-Cr produced via electrodeposition and
annealed for one hour [16] is in line with instability in other pure metals; a 30 min anneal in another deposition study [21], observed very similar growth.
For an alternative visual representation of this rampant grain growth, observe the
microstructure of electrodeposited nanocrystalline nickel is presented in Fig. 1.2 - grain growth is clearly visible after only 10 minutes of annealing at 0.2Tm (300'C).
Electrodeposited nc-Ni
As deposited
10 min. at 300*C
Figure 1.2 Rampant grain growth in electrodeposited nanocrystalline nickel - significant grain growth after only 10 minutes of annealing at 0.2T, and out of the nanocrystalline regime by 30
minutes (not pictured).
In addition to the metals presented in Fig. 1.1, the thermal stability of pure
nanocrystalline cobalt [22], aluminum [23], and gold [24] has been investigated. The grain growth in electrodeposited nc-Co [22] was examined thorough the maximum temperature of
DSC peaks associated with the growth process. The effect of various parameters involved with
the starting microstructure on this peak temperature was evaluated; the microstructural evolution after two minutes of annealing at 573K presented abnormal grain growth, with a few grains reaching micron-size. Mechanical alloying of aluminum resulted in a grain size of 96 nm after 25 hours of milling [23], difficult to compare with other nc-metals which are solidly in the
nanocrystalline regime (<I00nm); additionally, the lowest temperature at which heat treatments were performed was 0.68Tm (450*C). The grain size almost doubled after 30 minutes at this treatment. Nanocrystalline Au was prepared by gas deposition [24] and annealed for one hour, with the lowest temperature being -O.4Tm (425"C). The substrate was reported to have reached a
temperature of 400K (0.12Tm.) during the deposition, and it is unclear how this would affect grain size and its evolution.
The instability exhibited in these studies of pure nanocrystalline metals would seem to disqualify them from useful application, despite promising properties conferred by the
nanocrystalline grain size.
1.2 Possible Stabilization
In searching for possible solutions to stabilize this rampant grain growth, we first look at how the different processing routes for the same pure nanocrystalline metal affect the minor differences in thermal stability of pure nc-metals. In nc-Al [10], of two chemical synthesis processes, that which had less impurities grew more rapidly and was reported to be far more unstable than mechanically alloyed aluminum [23]. Fig. 1.3 presents the thermal stability of pure nc-Cu (Fig. 1.3A) and pure nc-Fe (Fig. 1.3B) with respect to processing methods. Mechanically alloyed metals show some improvement over electrodeposited in terms of the onset of rampant growth; there is a more marked difference in copper. Cryo-milling (MA below room
temperature) is better still, in the case of iron [25], possibly attributable to the different impurities (and their compounds with iron) present in the different atmosphere used. These impurities may generate slight improvements, but only represent minor kinetic barriers to grain growth (via a pinning process). Additionally, the time scales over which these minor gains affect the onset of growth (Fig. 1.3) do not exceed two hours; examinations of isothermal grain size
0.2 0.4 0.6 Tfm 400 300 1 200 100
A
2 00, 0.8 1.0 0.0 0.2 0.4 0.6 T/TmFigure 1.3 Differences in grain growth due to processing methods in nc-Cu (A) and nc-Fe (B). Dashed lines were electrodeposited [17] [191, solid lines were mechanically alloyed [13] [14]. Points
indicated by "C" were cryo-milled [26].
Since the instability of nc-metals is an inherent property of the nanostructure, an approach to lower the energy associated with the large fraction of grain boundaries will be more useful.
1.3 Thermodynamic approach to stabilization
The free energy of a polycrystalline system is affected by the energy and area of its boundaries:
dG oc ydA (1.1)
Starting from the Gibbs adsorption equation, Weissmuller [27, 28] noted that the segregation of
solute atoms to the grain boundaries in a dilute system reduces the grain boundary energy, 7:
y = yo - '(AH S" + kTInX) 150-100[ -N
-501 0. 0.0 0.8 1.0 (1.2) 01 It it Iwhere the reduction in grain boundary energy from the unalloyed condition, yo, is a function of the enthalpy of segregation for the binary system (AHgse) and the solute excess (F) at the grain boundary for a particular global solute concentration (X) and temperature (T), with k the
Boltzmann constant. Weismuller proposed a metastable state, where y -+0 through appropriate solute segregation, and the grain size (or grain boundary area) would be stable with respect to variations. This approach was derived with the assumption of a strongly segregating system and in the dilute limit of solute. Kirchheim used a different starting point to derive the relation in Eq. (1.2) [29, 30], also assuming an ideal dilute solution.
The general approach of this method is illustrated in Fig. 1.4. The red curve represents the increase in free energy generated by the increasing fraction of grain boundaries and their attendant boundary energy, dG oc ydA. The blue curve demonstrates the effect on the free energy of adding solute to the grain boundaries. Ideally, the cusp represents a metastable state where the segregation state creates a local minimum in the free energy, and the system is insulated against variations in grain size.
C
LO
Grain size
Figure 1.4 Illustration of thermodynamic approach to grain size stabilization, with the red curve showing the increase in free energy due to increased GB area (decrease in grain size). The blue curve shows the potential of solute segregation to lower the free energy, creating a local minimum stable with
respect to variations in grain size.
1.3.1 Atomistic modeling
Several atomistic modeling studies have attempted to examine the possibilities and conditions of this thermodynamic approach. Using the general, adjustable Lennard-Jones potential, Millet and co-workers have used atomistic simulations to show that decorating grain boundaries with solute can reduce GB energy to zero and inhibit grain growth [31-33]. In particular, their simulations have revealed that the atomic size mismatch correlates with the magnitude of GB energy reduction through segregation [31], and a critical concentration is necessary to reduce the grain boundary energy to zero [32]. In a simulated polycrystalline
system, grain growth was not observed following an annealing step when grain boundaries were appropriately saturated with solute [33].
A
DAfter
annealing...
Figure 1.5 MD simulations of nanocrystalline copper without dopants (A) and subject to an annealing process resulting in grain growth (B). The addition of dopants - red atoms in (C) results in no appreciable grain growth after the same anneal. From [33]. (D) Molecular Dynamics simulations of varied concentrations of dopants (black atoms) in copper after the same annealing treatment. Image
adapted from [32].
In studies in which realistic potentials for specific alloy systems are used, grain boundary behavior is more varied and nuanced:
In simulated copper, bismuth [34, 35] lowered the enthalpy at the grain boundaries when it was placed on some specific sites (even reaching negative local enthalpy), but the overall grain boundary energy remained positive. It was concluded that these locally negative regions of grain boundaries could retard the overall growth of grains. In this same study, silver solute in copper
was found to be insufficient for grain boundary stabilization [34, 35]. Additionally in [36, 37],
Cu-Ag was found to have a minor effect on the grain boundary energy; similarly Fe in copper had a negligible effect. However, Nb solutes at a global concentration of 1.9%Nb were found to
bring the GB energy to zero [36, 37]. This correlates to a grain boundary composition of
8.3%Nb [38].
In the case of tantalum in copper, tantalum segregation had a stabilizing effect, but agglomerated at higher temperatures [39]. Antimony atoms placed randomly at copper grain boundaries lowered their energy, with a stronger effect seen at higher concentrations [40, 41] to a level at which grain size no longer increased after an annealing treatment. (The effect of the dopants on deformation was also studied). Modeling of lead solute in aluminum showed that segregation on some sites can lead to locally negative grain boundary enthalpies at 300 K (0.04Tm) [42-44].
In the above discussed specific alloy simulations, only in some of the cases [39] [40, 41] was the thermal response evaluated. Additionally, in many atomistic simulations on this topic, the segregation state is achieved via manual decoration of solute atoms, which likely represent artificial segregation states. There have been fewer simulations where the segregation is
thermodynamic. For example, in [45] a nanocrystalline system of nickel with tungsten solute was equilibrated by a Monte Carlo method, and found that while addition of tungsten reduced the grain boundary energy, there was not an equilibrium solute segregation configuration that brought the grain boundary energy to zero; the GB energy was reduced by 60%.
This molecular scale modeling has focused on adding varying concentrations of a solute atom dopant to a nanocrystalline matrix whose grain size is initially set. For the limited number of systems studied via molecular dynamics simulations, the use of dopants to stabilize
nanocrystalline grain size has been shown to have varying levels of success, but there is not enough information to be able to extrapolate the utility of other alloying elements in additional
In an alternative, and more generalizable modeling approach, Trelewicz [46] derived a free energy function that encapsulates the thermodynamic stabilization of Eq. (1.2) and Fig. 1.4. However, it improves upon the ideas of Weismuller and Kirchheim by accessing the whole composition range (not just the dilute limit) and explicitly defining the total energy of a segregated system as opposed to simply the energy of the grain boundary. Differences in the grain sizes and composition ranges of stabilized states with respect to general materials parameters were studied in [46] and will be discussed in more detail in Chapter 2.
Through the findings of these theoretical and atomistic model approaches, alloying has emerged as a critical component for the development and deployment of nanocrystalline
materials, although our basic understanding of thermodynamic stability in nanocrystalline alloys remains incomplete.
I1.3.2
Experimental application of this approachWhile many more nanocrystalline alloys have been experimentally studied than atomistically modeled, the great variety in approach also precludes generalizable conclusions about the efficacy of the thermodynamic approach. For example, annealing times range from seconds to days, with most on the shorter end of that scale. Temperature ranges for annealing treatments are often selected with an eye to service temperatures, so even the lowest
temperatures tested show immediate grain growth. Additionally, most grain size measurements are taken from XRD; however, concurrent TEM observations often indicate large discrepancies either in average grain size [47-49] or grain size distribution, revealing the appearance of a few abnormally large grains. And, as mentioned above, different processing methods lead to varying degrees and sources of contamination (impurities).
Nonetheless, as will be detailed in the following section, alloyed nanocrystalline materials are more stable than their pure counterparts. (While scores of alloys have been produced with a nanocrystalline structure, we focus only on those whose thermal stability has been evaluated.)
1.3.2.1 Iron-based nanocrystalline alloys
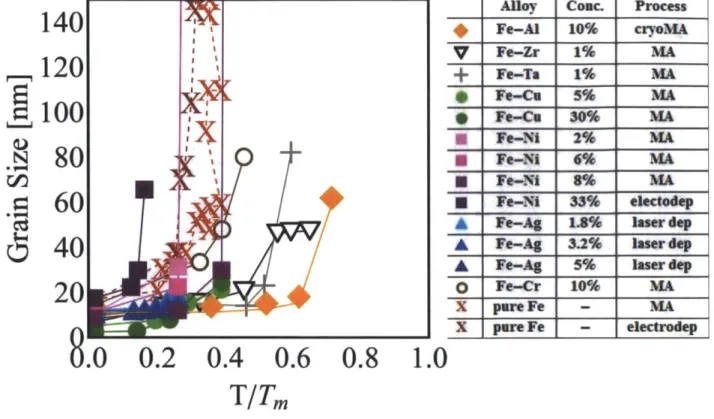
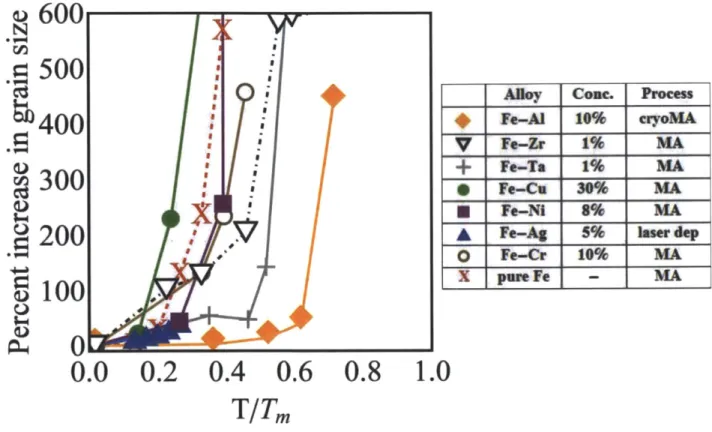
The grain growth as a function of annealing temperature for iron-based alloys in presented in Fig. 1.6. As starting grain sizes differed between alloys and within alloys with differing compositions, we re-plot the experimental data as a percentage increase in grain size relative to the initial size (Fig. 1.7), rather than absolute dimensions to allow for comparison across alloys. Grain growth in pure iron [14, 26] is also represented for comparison.
140
120
6=100
80
60
c340
20
q -. L0.2
0.4 0.6
0.8
1.
Alloy Coac. Process
* Fe-Al 10% cryoMA V Fe-Zr 1% MA + Fe-Ta 1% MA * Fe-Ce 5% MA * Fe-Cu 30% MA Fe-Ni 2% MA U Fe-NI 6% MA Fe-Ni 8% MA - Fe-Ni 33% e1ectodep Fe-Ag 1.% laserdep A Fe-Ag 3.2% laser dep A Fe-Ag 5% laser dep
o Fe-Cr 10% MA
X pure Fe - MA
X pure Fe - electrodep
)
TITm
Figure 1.6 Grain growth curves for experimentally studied iron-based nanocrystalline alloys. Data is taken from Al [261, Zr [50], Ta [50], Cu [51], Ni: electrodeposited[52] MA [53],
Fe-Ag[54], Fe-Cr [551. "I
04 NE
600
500
400
300
200
100
0
0.
0.8
1.0
Figure 1.7 Grain growth curves for Fe-based systems re-plotted to show grain growth relative to initial grain size of the particular system. The data sources are the same as Fig. 1.6.
The majority of nanocrystalline iron-based alloys are created via mechanical alloying; it is noted in many of these studies that additional impurities are present that may also contribute to the stabilization of the nanocrystalline microstructure through either kinetic pinning or segregation stabilization, as for the case of pure nc-Fe produced via MA. It can be noted, for example, that the electrodeposited Fe-Ni alloy [52] has more rapid grain growth than the mechanically alloyed Fe-Ni alloys [53] in the same anneal period (one hour), despite having a higher concentration of nickel available for solute segregation (from the MA study, increasing composition delayed onset of grain growth [53]). Both studies exceed the solubility limit of nickel in iron (-3.5% for processing temperature, as reported in [53]), but there is no explicit evidence presented for grain
0.2 0.4 0.6
TITm
I * I -* a I * I * * B I * * I * a UAloy Cone. Process
Fe-Al 10% crMA
V Fe-Zr 1% MA
+
Fe-Ta 1% MAFe-Ce 30% MA
U Fe-Nt 8% MA
A Fe-Ag 5% laser dep
0 Fe-Cr 10% MA
X pure Fe - MA
studies is measured by XRD, but additional TEM observations observe a bimodal grain size distribution with several large (>100nm) abnormally grown grains [52]. This abnormal grain growth was also observed after one year of room temperature aging, in addition to phase separation [52]. Neither the electrodeposited or mechanically alloyed Fe-Ni alloys show significant improvement over pure nanocrystalline alloys (produced by mechanical alloying) (See Fig. 1.7).
Also showing little improvement with respect to pure iron was the Fe-Ag alloy system, produced via laser deposition [54, 56]. Alloys of three compositions, 1.8, 3.2, and 5% Ag, were annealed for one hour at temperatures up to 673 K [54], after which the silver-rich solid solution precipitates [56]. In fact, the iron solid solution phase separates at room temperature after four weeks.
The highly immiscible Fe-Cu system was mechanically alloyed at compositions of 5% and 30% copper [51]; the 30%Cu alloy remained entirely two phase despite the highly energetic ball-milling. The lower concentration alloy exhibits some grain growth at 570 K (0.19Tm), and
at 720K (0.29Tm) significant grain growth has occurred; additionally, there is evidence of phase separation. At 870K (0.39Tm), the precipitating FCC phase is distinct. This study cites the difference in cohesive energies of iron and copper and some previous microcrystalline observations as expectations for solute segregation to the grain boundaries. In a more recent work [57], EDS profiles of microcrystalline Fe-4%Cu show clear and extensive grain boundary segregation (up to 60%Cu).
Mechanically alloyed Fe- 10% Cr showed grain growth after thirty minutes of annealing at 500, 600, and 700'C (0.33, 0.39 ,and 0.46Tm) [55], but the material remains nanocrystalline, a
helpful result for the end goal of a nc-product after a powder compaction process. Most of the grain growth occurred within the first 15 minutes at 500'C, and then plateaued; growth
continued with time for annealing at 600'C and 700'C, with the grain size appearing to be >100nm after an hour of annealing at 700'C [55].
The relationship of solute concentration to grain growth was evaluated in the Fe-Zr system [20, 58]: a mechanically-alloyed system with 1/3% Zr exhibited grain growth resulting in a bimodal distribution of micron- and nano-sized grains at 700'C (0.4 6Tm) for one hour, whereas this result was not observed until 870'C (0.57Tm) for 4% Zr. The microstructure of the 4%Zr
system was composed of micron-sized grains after an hour anneal at 11 73'C (0.7 6Tm) with some
large nano-precipitates (-400nm) of 42%Zr (the micron grains were 3% Zr). Increasing the solute content to 10% resulted in precipitation of Fe2Zr at 700'C [58]. Surface EDS of the milled particles shows strong segregation of Zr to the particle surface and an examination of lattice behavior via XRD shows Zr leaving the lattice after a short anneal, both supporting the hypothesis of solute segregation to the grain boundary [20].
Iron alloyed with either titanium or molybdenum retained nanoscale grains until -900'C
(0.59Tm), where the transition of a->y iron coincides with a loss of thermal stability [59]. An FCC (y-Fe) peak appeared in Fe-2%Ti samples heated at 91 PC (0.59Tm) for less than 15
minutes, and continued to grow, exhibiting peak widths too narrow to be nano-scaled. The grain size of the initial BCC-Fe(Ti) doubled in an hour. The 2%Ti concentration falls in the Fe(Ti) region of the phase diagram which does not predict the a->y phase transition; however, XRD lattice analysis showed that the composition of Ti in the grain lattice is much lower (-0.23%, within the region of a-y) potentially as a result of grain boundary segregation and some
titanium in the lattice to bypass the region in which the a-*y transition would occur (at -900 0C),
and an anneal at 9300C (0.6Tm.) for 30 minutes maintained a nanostructure in the 5% alloy
whereas the 2%Ti alloy produced the bimodal large-grained FCC-Fe and growing nano-BCC-Fe [59]. Similar results were indicated for Fe-Mo alloys, but not described [59].
Fe-10% Al alloys were produced via cryo-milling; hour anneals at 1073 and 1223K (0.52 and 0.6 2Tm) resulted in minute increases in grain size (within error of the measurement method).
Significant grain growth occurred after annealing at 1373K (0.72Tm) [26]. APFIM studies showed an inhomogeneous distribution of Al in Fe-Al (this time a 5% Al alloy) with segregation of aluminum, oxygen, nitrogen and the compounds AlN and A1203 at the grain boundaries [25].
Cryo-milling in argon versus nitrogen atmosphere shows lower stability (growth at 1273K vis a vis 1373K), which showed that the AlN grain boundary precipitates (which are only present when milled in nitrogen) are important in thermal stability [60].
1.3.2.2 Copper-based nanocrystalline alloys
Relative grain growth in experimentally produced copper alloys is presented in Fig. 1.8. Pure copper grain growth is represented for two processing methods, electrodeposited nc-Cu [17]
by red "X"s, and gas-deposited [18] by dark red "X"s .
I I I I I * I I I woo 0
()
0.8
1.0
Figure 1.8 Grain growth in experimental copper-based nanocrystalline alloys. Data is from:
Cu-Zr [481, Cu-Fe [511, Cu-W [61, Cu-Ag [62], Cu-Nb [631, Cu-Bi electrodeposited [491 and
gas-deposited [18].
Mechanically alloyed Cu-Zr showed high thermal stability up to ~0.5Tm according to grain size measurements derived from XRD [48] [64]; however, TEM observations of the nanostructure revealed higher grain sizes (and therefore higher growth) than the XRD
measurements (about 20nm higher). Additionally, precipitates of ZrO2 and Cu5Zr were observed
only through microscopy due to their small size (<5nm). Thermal stability at high temperatures
F
200
150
100
50
0.2 0.4 0.6
TITm
Alloy Couc. Process
Cu-Zr 1% cryoMA Cu-Zr 5% cryoMA + Cu-Fe 30% MA Cu-W 5% cryoMA Cu-W 10% cryoMA V Cu-Ag 20% MA A Cu-Nb 5% MA A Cu-Nb 10% MA * Cu-Bi 0.42% electrodep * Cu-Bi 04% gas-dep * Cu-Bl 5.4% gas-dep * Cu-Bi 10.4% gas-dep X pure Cu - electropdep x pure Cu gas-de, ofl
0.0
(900*C, 0.83Tm) was therefore attributed to Zener pinning based on stabilization requirements
-only a volume fraction of 2.4% is needed for a 2nd phase to stabilize the 30nm grain size is only
2.4% (if particles are assumed to be 3.5nm, which is reasonable based on the experimental observations). Modeled contributions of 2nd phase particles to hardness also agree well with
experimental measurements. Zirconium is proposed to lower the grain boundary energy only at lower temperatures due to assumptions made in the segregation model [48].
Atomistic modeling found that 1.9%Nb in copper was capable of reducing the grain boundary energy to zero [36]; all experimentally assessed alloys have larger concentrations of
Nb, but do exhibit good stability. For several compositions of Cu-Nb alloy prepared through
MA [13], it was found that >5%Nb content was necessary for stability up to 400'C (0.37Tm) (one hour anneal). The appearance of Nb-rich phase peaks in the XRD for Cu-7.5%Nb at 600'C
(0.55Tm) coincides with the start of significant grain growth. In both this study [13], and another [63, 65], the thermal stability of Cu-10%Nb is evaluated. The lowest temperature at which the
10%Nb alloy is annealed in [63] is 500'C (0.46Tm), and at this temperature, the nanostructure is
observed to be composed of nc-Cu (50nm, grown from an initial size of 6nm) and a Nb phase (of size <5nm) which comprises ~14% of the material. Impurity phases are also observed: NbO,
Cu20, and Fe7Nb6 [65].
The precipitation of an iron-rich phase observed via XRD at 720K (0.41 Tm) coincides with a jump in grain growth in mechanically alloyed Cu-30%Fe [51]; grain boundary segregation of iron is not anticipated due to differences in cohesive energies. Indeed, atomistic modeling shows a very shallow decrease in grain boundary energy with addition of iron to the grain boundaries [36].
Additionally, in Cu-20%Ag, the formation of an Ag-rich second phase was concurrent with significant grain growth; shifts in the copper XRD peaks at 473K (0.18Tm) indicated silver
leaving the matrix, and visible Ag peaks were observed at 673K (0.37Tm). Both the Cu and Ag phases exhibit growth upon further annealing [62].
Copper-bismuth alloys have been both gas-deposited [18] and electrodeposited [49], with the electrodeposited alloy of the same composition (~0.4%Bi) showing better stability.
However, after only 10 minutes annealing at 200'C (0.18Tm), several large grains (>1 00nm) were observed via TEM. Regarding the gas-deposited samples, the bismuth alloy showed
improvement over pure copper produced in the same method for the three compositions tested (0.4, 5.4, 10.4% Bi) [18]. The 10.4%Bi alloys showed second phase precipitation via XRD, but little difference in the grain growth pattern from the solid solution samples.
The stability of Cu-0.2% and 0.5%Sb alloys produced via ECAE was evaluated based on microhardness measurements, assuming the correlation of microhardness with grain size [40]. The microhardness dropped after annealing at -200'C (0.1 8Tm) for pure Cu, compared to
~400'C (0.37Tm) for Cu-0.2% and -0.5%Sb, after which the hardness returned to bulk (micro-crystalline) values. Microscopy observed an initial grain size of 350nm; after one hour at 250'C (0.2 3Tm), the grain size grew to two microns.
1.3.2.2.1 Two-phase nanocrystalline copper alloys
During the course of evaluating thermal stability for several copper alloys, it was
observed that the nanostructures likely initially consisted of two phases, not simply the expected solid solution. In mechanically alloyed Cu-36%Pb [66], the onset of grain growth was delayed with respect to pure nc-Cu (starting at 100'C, 0.09Tm), but a full solid solution was not achieved
An initial structure of nc-Cu and nc-Ta grains of size <1 Onm in an MA Cu-i 0%Ta alloy evolved to a copper grain size of 111 nm and bimodal distribution of Ta consisting of 49nm grains and ~7nm clusters at copper grain boundaries after a four hour annealing treatment at
1173K (0.83Tm) [39].
Cryo-milling in the immiscible Cu-W system did not achieve complete nano-scaling of tungsten [61] - at 1 %W, nano-W particles dispersed in -40nm grains of copper stabilized this grain size up to one hour at 400'C (0.37Tm); however, some tungsten phase regions were found to be >1 micron in size. In the 10%W alloy, the grain size of copper was stabilized up to an annealing temperature of 600*C (0.55Tm); again, the W was present as both -10nm and >1tm precipitates. Upon further annealing, the grain size of the copper matrix grew while the
nanoscale W phases remained approximately the same size. Conversely, in magnetron sputtered Cu-10%W, a tungsten phase was not observed until 550 C (0.5 ITm), a temperature consistent with diffusion calculations in this alloy [67]. In this study, both CulO%Mo and Cu-10%W saw second phase precipitation (400'C for Mo) and the stability of this second phase was evaluated with respect to both heat treatments and irradiation.
In mechanically alloyed Cu-5%Y [68], a heat treatment at 5000C (0.46Tm) for 2 hours
produced grain growth from 46 to 59 nm, observed via TEM. Diffraction patterns revealed either
Cu5Y or Cu4Y present before and after the heat treatment.
1.3.2.5 Nickel-based nanocrystalline alloys
Electrodeposition is the processing method of choice for nanocrystalline nickel-based alloys. The response of several alloys and their varying compositions to annealing treatments is
shown with respect to annealing temperature in Fig. 1.9; pure electrodeposited nickel is presented in red for reference.
a)
-0
a)400
300
200
100
A
I I I I I I I I I I I I I I I I I I I I IS
*
0.0 0.1 0.2 0.3 0.4
0.5
0.6 0.7
TITm
Figure 1.9 Grain growth in nc-nickel-based alloys. Data is presented from: Ni-Co [69], Ni-W [701,
Ni-Fe - 20% [71], 45% [72], Ni-Mn [731, Ni-Cu [12], Ni-P [74], pure Ni [11].
An electrodeposited Ni-20%Co alloy showed good thermal stability as reported in [69]; however, the annealing time at temperature is not reported - annealing was performed via DSC, but neither the heating rate nor hold time was reported. Conversely, in another study of
Ni-37%Co [75], abnormal grain growth was observed after only 10 seconds at 573K (0.2Tm), while the nc-matrix was entirely consumed after 120 seconds (the grain size grew from 15nm -+
400nm). Alloy Cmc. Process S Nt-Co 20% electrodep U NM.. 6% eleode, * Nt-W 21% electrodep A NI-Fe 20% electrodep A NI-Fe 45% electrodep
A Nt-Muf 0&43% _AcrmlP
Ni-Cu 12% electrodep ie Nt-Cu 30% eletd NI-.Cu 40% electode N-P 12% electrodp x pureNi - electrodep i
A Ni-2 1 %Fe electrodeposited alloy showed no change in grain size up to 373K (0.07Tm)
for a 90 minute anneal [76, 77] and good stability up to 573K (0.2Tm), after which the grain size increased rapidly. Alloys of compositions 15%Fe [76] and 20%Fe [71] showed similar results, while a 45%Fe electrodeposited alloy [72] showed c-phase precipitation at 573K after 20 hours
or 673K (0.28Tm) after 0.5 hr. Grain growth began at a lower temperature than in the lower iron content alloys where second phase precipitation was not observed.
Ni-W alloys of three compositions (6, 13, 21 %W) showed good thermal stability to
~500'C (0.34Tm) for 24 hour anneals [70]. Around this temperature, short range ordering began
to be observed, culminating in precipitation of the Ni4W phase at 700'C (0.48Tm). In support of
the stabilization of grain size via boundary solute segregation, atom probe observations quantify tungsten segregation to the grain boundaries [78]. Additionally, atomistic modeling showed that tungsten segregation can reduce the grain boundary energy by -60% in a system with a starting grain size corresponding to that of the experimental 21 %W sample [45].
Evidence of segregation was also quantified in electrodeposited Ni-Cu using EELS (electron energy loss spectroscopy) [12]; in a 44%Cu deposit, the grain boundary concentration of Cu was measured as high as 82%. For alloy compositions of 30 and 44%Cu, the grain size was stable to 573K (0.2Tm) after a three hour anneal; for 12%Cu, only 473K (0.14Tm). A Cu-rich phase precipitated when annealing temperatures exceeded 525K (0.17Tm) - in the Ni-30%Cu alloy, 15% of the material was Cu phase at 573K and 25% Cu phase at 625K (0.24Tm).
Segregation of phosphorous to grain boundaries in nickel was observed via atom probe in Ni-3.6%P (1 1%P in GB) and Ni-1%P [79]. The 1%P alloy was mostly stable to 250'C (0.17Tm), and substantial grain growth immediately preceded the observation of Ni3P precipitation in grain
boundaries at 450'C (0.3 1Tm). Similarly, in a Ni-1.2%P alloy [74], the average grain size
doubled from 10nm at 300'C (0.2 1Tm), with more extensive grain growth occurring after 360'C (0.25Tm), when Ni3P precipitation is first observed. At 480'C (0.33Tm), the average grain size
had surpassed 1 00nm. The annealing in this study was performed in the DSC in steps of 20'C with 10 minute holds to 'allow the microstructure to stabilize'.
Ni-Mn alloys were prepared by both direct current (0. 12%Mn) and pulsed current (0.43%Mn) electrodeposition [73]. Following anneals of 1 hour, substantial grain growth was reported to start at 500'C (0.34Tm). At 600'C (0.4lTm) precipitation of tiny Mn clusters was observed using both atom probe and TEM. Atom probe studies found evidence of Mn, 0, and C segregation to grain boundaries at annealing temperatures of 600 and 700'C (0.48Tm).
In contrast to the stability gained by many of the above alloying elements in nickel, grain growth was observed in electrodeposited Ni-45%Zn by 'simply exposing the sample to the electron beam' for 5 minutes [80].
1.3.2.6 Cobalt-based nanocrystalline alloys
In electrodeposited Co-1. 1 %P [81], the allotropic hcp-+fcc Co phase transformation was observed between 673-733K (0.27-0.3 lTm),followed by abnormal grain growth. Precipitates of
Co2P and CoP appeared between 733-753K (0.31-0.32Tm). Grain boundary segregation of P was
confirmed via atom probe. In a second study [82], rapid grain growth began at 733K for 1.1 %P and 713K for 3.2%P. Growth occurred earlier for the 3.2%P alloy due to earlier precipitation of
Co2P in the grain boundaries - the as deposited alloy contained 25%P in the GB as measured by
The cobalt phase transition (HCP-+FCC ) also triggered grain growth in an
electrodeposited Co-5.5%Ni alloy [69], from an initial grain size of 20nm to 50nm. The 20nm initial grain size was observed to be stable up to 623K (0.23Tm). The allotropic transition occurred at 701K (0.29Tm), which agrees with the bulk phase diagram (695K). For much higher concentrations of nickel (47%)[75] the alloy was initially FCC, and abnormal grain growth was observed starting at 573K (0.2Tm); the nanocrystalline matrix was consumed after 6000s at that temperature. A two-phase (FCC and HCP) Co-26%Ni alloy also produced abnormal growth. Only the HCP-Co-Ni alloy [69] exhibited stability.
No cobalt transition was observed in electrodeposited Co-W alloys [83], but Co3W
appeared at 400'C (0.27Tm) for a 24.5%W alloy and 600'C (0.4Tm) for a 34.4%W alloy.
However, difficulty in differentiating Co(W) solid solution and Co3W XRD peaks cannot rule
out its presence in the as deposited specimens. Grain growth observations (as measured by XRD peak broadening) were erratic, perhaps due to the aforementioned XRD resolution challenges.
11.3.2.7 Palladium-based nanocrystalline alloys
All three palladium alloys and their attendant compositions show marked improvement in
thermal stability when compared to pure nc-Pd (Fig. 1.10).
I
I S S I B S I I I S I I I I I I I I I I I I I S9. .5 I, .5 I. .5 , I. N ~1)0.0 0.1 0.2 0.3 0.4 0.5 0.6 0.7
TITm
Alay COW. Proces
Pd-Fe 8%
ghtim-E Pd-Fe 411% .hcrdqi
T
T
1HF W 71A NdZrYT 1TW- ~mem
I Pam - leaod
Figure 1.10 Grain growth in Pd alloys: pure nc-Pd [15], Pd-Fe [84, 851, Pd-Y [86], Pd-Zr [47.
Pd-Zr was mechanically alloyed [87] to produce several compositions, 10, 15, 19, and 20%Zr - thermal stability increased with zirconium composition. For the 20%Zr alloy, the grain size was maintained to 800'C (0.5 lTm). Assuming some geometrical assumptions about the grain boundaries, a segregation enthalpy equal to elastic mismatch, and GB concentrations related to the lattice parameters, the authors showed a decrease in GB energy due to assumed Zr segregation. To test other reasons for stability, the authors deliberately increased the impurity contents (by increasing the sample's exposure to oxygen), creating observable ZrO phase.
![Figure 1.9 Grain growth in nc-nickel-based alloys. Data is presented from: Ni-Co [69], Ni-W [701, Ni-Fe - 20% [71], 45% [72], Ni-Mn [731, Ni-Cu [12], Ni-P [74], pure Ni [11].](https://thumb-eu.123doks.com/thumbv2/123doknet/14685429.560136/34.918.79.783.223.657/figure-grain-growth-nickel-based-alloys-data-presented.webp)
![Figure 1.10 Grain growth in Pd alloys: pure nc-Pd [15], Pd-Fe [84, 851, Pd-Y [86], Pd-Zr [47.](https://thumb-eu.123doks.com/thumbv2/123doknet/14685429.560136/38.918.86.786.250.696/figure-grain-growth-pd-alloys-pure-pd-pd.webp)