HAL Id: hal-01965606
https://hal-amu.archives-ouvertes.fr/hal-01965606
Submitted on 26 Dec 2018
HAL is a multi-disciplinary open access
archive for the deposit and dissemination of sci-entific research documents, whether they are pub-lished or not. The documents may come from teaching and research institutions in France or abroad, or from public or private research centers.
L’archive ouverte pluridisciplinaire HAL, est destinée au dépôt et à la diffusion de documents scientifiques de niveau recherche, publiés ou non, émanant des établissements d’enseignement et de recherche français ou étrangers, des laboratoires publics ou privés.
Depolarizing γ-aminobutyric acid contributes to
glutamatergic network rewiring in epilepsy
Nazim Kourdougli, Christophe Pellegrino, Juho-Matti Renko, Stanislav
Khirug, Geneviève Chazal, Tiina-Kaisa Kukko-Lukjanov, Sari Lauri, Jean-Luc
Gaiarsa, Liang Zhou, Angélique Peret, et al.
To cite this version:
Nazim Kourdougli, Christophe Pellegrino, Juho-Matti Renko, Stanislav Khirug, Geneviève Chazal, et al.. Depolarizing γ-aminobutyric acid contributes to glutamatergic network rewiring in epilepsy. Annals of Neurology, Wiley, 2017, 81 (2), pp.251-265. �10.1002/ana.24870�. �hal-01965606�
HAL Id: hal-01965606
https://hal-amu.archives-ouvertes.fr/hal-01965606
Submitted on 26 Dec 2018
HAL is a multi-disciplinary open access
archive for the deposit and dissemination of sci-entific research documents, whether they are pub-lished or not. The documents may come from teaching and research institutions in France or abroad, or from public or private research centers.
L’archive ouverte pluridisciplinaire HAL, est destinée au dépôt et à la diffusion de documents scientifiques de niveau recherche, publiés ou non, émanant des établissements d’enseignement et de recherche français ou étrangers, des laboratoires publics ou privés.
Depolarizing γ-aminobutyric acid contributes to
glutamatergic network rewiring in epilepsy
Nazim Kourdougli, Christophe Pellegrino, Juho-Matti Renko, Stanislav
Khirug, Geneviève Chazal, Tiina-Kaisa Kukko-Lukjanov, Sari Lauri, Jean-Luc
Gaiarsa, Liang Zhou, Angélique Peret, et al.
To cite this version:
Nazim Kourdougli, Christophe Pellegrino, Juho-Matti Renko, Stanislav Khirug, Geneviève Chazal, et al.. Depolarizing γ-aminobutyric acid contributes to glutamatergic network rewiring in epilepsy. Annals of Neurology, Wiley, 2017, 81 (2), pp.251-265. <10.1002/ana.24870>. <hal-01965606>
Depolarizing GABA contributes to glutamatergic network rewiring in epilepsy
Running head: GABA fosters glutamatergic rewiring
Nazim Kourdougli1,2 PhD, Christophe Pellegrino1,2 PhD, Juho-Matti Renko3# PhD, Stanislav Khirug4# PhD, Geneviève Chazal1,2 PhD, Tiina-Kaisa Kukko-Lukjanov4, Sari E. Lauri4 PhD, Jean-Luc Gaiarsa1,2 PhD,
Liang Zhou4 PhD, Angélique Peret1 PhD, Eero Castrén 4 Prof., Raimo Kalevi Tuominen3 Prof., Valérie Crépel1,2 PhD, Claudio Rivera*1,2,4 Prof.
Affiliation
1
Inserm Unité 901, INMED, Marseille, 13009, France.
2
Aix-Marseille Université, UMR S901, Marseille, 13009, France.
3
Division ofPharmacology and Pharmacotherapy, P. O. Box 56, 00014 University of Helsinki, Finland.
4
Neuroscience center, P. O. Box 56, 00014 University of Helsinki, Finland.
# These authors equally contributed to this work.
Corresponding author: claudio.rivera@helsinki.fi; Neuroscience center, P. O. Box 56, 00014 University of Helsinki, Finland.
Number of characters: title (75), running head (35).
Word count: abstract (243), introduction (434), discussion (739), and body of manuscript (4634) Number of figures: 6
Number of color figures: 6 Number of table: 1
This article has been accepted for publication and undergone full peer review but has not been through the copyediting, typesetting, pagination and proofreading process which may lead to differences between this version and the Version of Record. Please cite this article as an
Abstract
Objective: Rewiring of excitatory glutamatergic neuronal circuits is a major abnormality in epilepsy. Besides the rewiring of excitatory circuit, an abnormal depolarizing GABAergic drive has been hypothesized to participate in the epileptogenic processes. However, a remaining clinically relevant question is whether early post Status Epilepticus (SE) evoked chloride dysregulation is important for the remodeling of aberrant glutamatergic neuronal circuit.
Methods: Osmotic mini-pumps were used to infuse intracerebrally a specific inhibitor of depolarizing GABAergic transmission as well as a functionally blocking antibody towards the pan-neurotrophin receptor p75 (p75NTR). The compounds were infused between 2 and 5 days after pilocarpine-induced SE. Immunohistochemistry for NKCC1, KCC2 and ectopic recurrent mossy fiber (rMF) sprouting as well as telemetric EEG and electrophysiological recordings were performed at day 5 and 2 months post-SE.
Results: Blockade of NKCC1 after SE with the specific inhibitor bumetanide restored NKCC1 and KCC2 expression, normalized chloride homeostasis and significantly reduced the glutamatergic recurrent mossy fiber sprouting (rMF) within the dentate gyrus. This mechanism partially involves p75NTR signaling as bumetanide application reduced SE-induced p75NTR expression and functional blockade of p75NTR decreased rMF sprouting. The early transient (3days) post-SE infusion of bumetanide reduced rMF sprouting and recurrent seizures in the chronic epileptic phase.
Interpretation: Our findings show that early post-SE abnormal depolarizing GABA and p75NTR signalings foster a long lasting rearrangement of glutamatergic network that contributes to the epileptogenic process. This finding defines promising and novel targets to constrain reactive glutamatergic network rewiring in adult epilepsy.
Keywords: mossy fiber sprouting, epilepsy, pan-neurotrophin receptor p75NTR, GABAergic signaling, NKCC1, KCC2, bumetanide.
Abbreviations: TLE: temporal lobe epilepsy; SE: status epilepticus; DG: dentate gyrus; DGC: dentate
gyrus granule cell; rMF: recurrent mossy fiber; p75NTR: pan neurotrophin receptor p75; KCC2: K+-Cl -co-transporter; NKCC1: Na+-K+-2Cl- co-transporter.
Introduction
Plastic remodeling of glutamatergic neuronal networks is one of the major pathophysiological processes observed in epileptic tissue and post-traumatic brain injuries (TBI) both in humans and animal models1,2. The understanding of the molecular mechanisms involved in this plastic remodeling is of particular importance since it creates a powerful hyperexcitable cerebral focus that drives recurrent disabling seizures3-5. This phenomenon, called reactive plasticity, is well documented in the dentate gyrus (DG), where ectopic dentate granule cell (DGC) axons (the recurrent mossy fibers [rMFs]) sprout and create a reverberant excitatory circuit between DGCs. This is involved in the formation of epileptiform bursts in patients with temporal lobe epilepsy (TLE) and TBI, as well as in animal models6-13. Although the molecular mechanisms are unclear, there is evidence supporting an active role of neurotrophin signaling15-18. However, the early post-SE molecular events that activate neurotrophin pathways and trigger the ectopic rMF growth remain elusive. Besides the rewiring of excitatory circuits, an abnormal depolarizing GABAergic drive has been hypothesized to participate in epileptogenic processes in adult brain. This includes the dysregulation of the neuronal specific K+-Cl -co-transporter KCC2 and the Na+-K+-2Cl- co-transporter NKCC1 as reported in resected tissues from human TLE patients19,20 and animal models21-23. Indeed, bumetanide, a specific blocker of NKCC1, has been shown to have acute anticonvulsant action on chronic epileptic activity25. We have also previously shown that depolarizing GABAergic transmission triggers the upregulation of the pan-neurotrophin receptor, p75NTR, in an acute injury model24.
Here we have tested the hypothesis whereby the early alteration of chloride homeostasis following SE is a precipitating event involved in rMF sprouting establishment via the activation of p75NTR. We examined a novel therapeutic strategy based on the transitory blockade of NKCC1, early after SE (i.e. before the appearance of ictal activities), to reduce the ectopic sprouting and recurrent seizures in the chronic epileptic phase (i.e. several months after SE).
We found that a functional establishment of ectopic rMF sprouting takes place concomitantly with altered expression of NKCC1 and KCC2 as early as day 5 post-SE in the rat pilocarpine model of TLE. Moreover, we were able to demonstrate that p75NTR is upregulated and is involved in the formation of ectopic rMF sprouting. In turn, NKCC1 inhibition resulted in the decrease of post-SE p75NTR upregulation and the reduction of rMF sprouting. Finally, transitory blockade of NKCC1 few days after SE resulted in a significant reduction of rMF growth and recurrent seizures at the chronic stage. In conclusion, our findings pave a way to identify novel therapeutic strategies targeting cation-chlorideco-transporters and p75NTR signaling pathways to constrain abnormal glutamatergic network rewiring and chronic adult epilepsy.
Experimental procedures
Animals. All experiments were approved by the Institute National de la Santé et de la Recherche
Médicale (INSERM) through the local ethic committee (project number 66-15112012) and the European community council directive (2010/63/UE). Adult male Wistar rats had access to food and water ad libitum and were housed under a 12 h light/dark cycle at 22–24°C.
Rat model of temporal lobe epilepsy. An animal model of temporal lobe epilepsy was obtained using
adult male Wistar, as previously described26. Briefly, six weeks old male rats (Charles River and Janvier Laboratories) were treated with pilocarpine hydrochloride (360 mg/kg, i.p.; Sigma-Aldrich) 30 minutes after scopolamine methyl nitrate (0,5 mg/kg, i.p.; Sigma-Aldrich). After 3h of Status Epilepticus (Stage V on Racine’s scale), convulsions were suppressed with diazepam (8 mg/kg, i.p.; Roche) and saline solution (0,9% NaCl; Sigma-Aldrich) was administrated subcutaneously. The success rate of the pilocarpine sessions was 67%, which is in accordance with other studies using adult rats, similar dose, and SE duration27-28.
Bumetanide and p75NTR antibody infusion. Osmotic minipumps and cannulae were implanted to
continuously deliver bumetanide (B3023, Sigma-Aldrich). Rats were anaesthetized with 4.5% isoflurane and maintained with 2.5% isoflurane for surgery and placed on a heating pad to control body temperature. Rats were placed in a stereotaxic apparatus, a scalp incision was made, and a 0,8 mm diameter hole was drilled through the skull (A/P -3.8; L/M +2.5; D/V 3.0) and a 3.0 mm long 28 gauge cannula (Alzet brain infusion kit, Charles River) was inserted and secured to the skull with dental cement (Paladur, Hereaus). An osmotic mini-pump (Alzet mini-pumps 2002, Charles River) and tubing connected to the cannula were implanted subcutaneously over the back. Mini-pumps were filled with vehicle solution containing 0.3% of ethanol in 1M PBS with or without bumetanide (20μM). After surgery, rats were kept warm, received saline (0.9% NaCl, s.c.), and analgesic buprenorphine (0.03 mg/kg, s.c.) was administrated to minimize animal pain after surgery. In all experiments, infusions began at two days post-status Epilepticus and last for 3 days with a delivery rate of 0.5μl/hour ± 0.05 μl at body temperature, resulting into a quantity of bumetanide injected of 86ng/24h during 3 days. For p75NTR antibody infusion, mini-pumps contained vehicle solution (1M PBS), control rabbit IgG (dilution 1:300 in 1M PBS; sc-2027, Santa Cruz Biotechnology), or p75NTR antibody (dilution 1:300 in 1M PBS of 2mg/ml; final concentration of 6.67µg/ml; AB1554; Millipore). The mortality rate was 5-8% at 24h post-surgery.
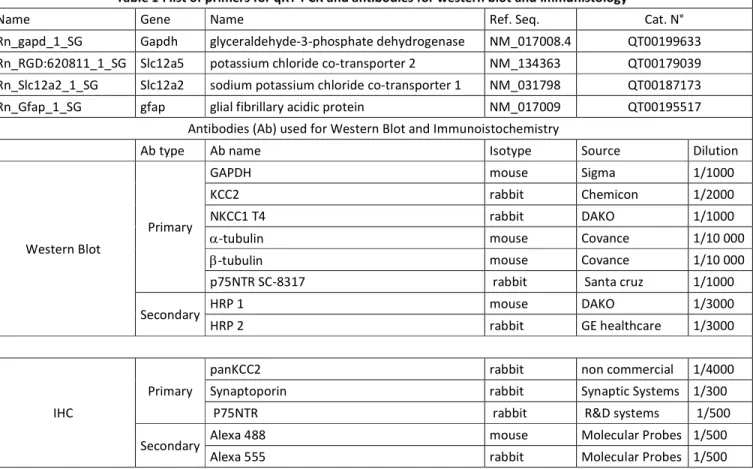
qRT-PCR. Expressions of NKCC1 and KCC2 mRNA were detected by real-time quantitative PCR. Total
RNAs were isolated from in toto hippocampi using Mini RNeasy kit (Qiagen). First strand cDNA was synthetized from 1mg of total cellular RNA Reverse Transcription QuantiTect kit (Qiagen) at 42°C for 15min then 95°C for 3min in solution containing RNAases inhibitors, oligo-DTs, primers and dNTPs. Real-time PCR cycles were carried out for amplification of NKCC1, KCC2, and GAPDH using termal cycles (Eppendorf). Primers were designed and synthetized by Qiagen. RT-PCR was then carried out using 5mL of cDNA in a final reaction volume of 30mL using SYBER Green Real-time PCR Master Mix. Primers sequences are listed in Table 1. The relative copies are expressed in arbitrary unit.
Western Blots. Animals were killed by decapitation after isoflurane anaesthesia and the hippocampi
were quickly dissected out and flash-frozen in liquid nitrogen and stored at -80°C until processed. Brain tissue was homogenized in RIPA buffer (50mM Tris-HCl pH: 8; 150mM NaCl; SDS 0,1%; Deoxycholic Acid 0,5%; 1% triton X-100), containing 1 Complete Protease/Phosphatase Inhibitor Tablet (Thermofisher) and loaded with Laemmli 3X loading buffer. The samples were separated in 7,5-20% SDS–PAGE gel (Criterion gel, Bio-Rad) and transferred to nitrocellulose membrane (Whatman). After blockade in Tris-buffered saline plus 5% BSA, we exposed membranes overnight at 4°C to polyclonal rabbit KCC2-specific antibody diluted 1:2000 in blocking solution. Chemiluminescent detection was performed using horseradish peroxidase-conjugated rabbit-specific antibody diluted 1:3000 in blocking solution for 2h at room temperature and revealed using ECL-plus western blotting reagents (ECL-plus kit, Pierce Biotech). We measured signal intensities with the image analysis software G box (Syngene). Then, membranes were stripped using DTT/SDS in Tris-HCl, pH 7.0, and probed with rabbit anti-β3-tubulin or α-tubulin (Sigma, 1:20000) for normalization and signal detection and revelation following the same procedure. Quantification is performed using Get Plot Analyser plugin (Fiji). The antibodies are listed in Table 1. The relative expression levels are expressed in arbitrary unit.
Immunohistochemstry. Rats were anaesthetized with isoflurane followed by pentobarbital
(65mg/kg) and transcardiacally perfused with cold PBS (1M) prior to cold 4% paraformaldehyde in phosphate buffer saline (PBS). Brains were post-fixed overnight in 4% paraformaldehyde in PBS at 4°C and then coronaly cut with a Leica VT1200S vibratome (60μm thick-sections). Sections (6 slices per condition) were then permeabilized and blocked in PBS with 0.3% Triton X-100 and 5% normal goat serum (NGS) for 1h at room temperature. Incubation with primary antibodies diluted in PBS with 5% NGS and 0.1% Triton X-100 was carried out at 4°C overnight (SPO was incubated additional 24h at 4°C) using different primary antibodies (Table 1). After rinsing 3 times in PBS, slices were incubated with the corresponding Alexa Fluor-conjugated secondary antibodies diluted in PBS
(1:1000, Invitrogen) for 1h (SPO was incubated additional 2h) at room temperature and finally counterstained for 5 min with Hoechst 33258 (10μg/ml in PBS, Sigma-Aldrich).
Quantification of KCC2 analysis was performed in blind. For plot analysis of KCC2 the intensity and distribution associated with the membrane or cytosolic regions in control, pilocarpine rats, pilocarpine vehicle-treated rats and pilocarpine bumetanide-treated rats were performed using 20X objective and Plot analysis using Fiji software. The same straight-line length (10µm) was applied from the nucleus to the external cell compartment of 50 cells from each condition. The plot profile values were analyzed and calculated the S.E.M. (error bars). The total fluorescence intensity analysis of KCC2 has been normalized to the number of NeuN-positive cells contained in the ROIs. The 3D object counter pluggin from Fiji software was used to count the number of cells.
Acute slices preparation. Animals were deeply anaesthetized with chloral hyadrate (350 mg/kg, i.p.)
and decapitated. The brain was removed rapidly, the hippocampi were dissected, and transverse 400μm slices were cut in oxygenated (95% O2 and 5% CO2) modified artificial cerebrospinal fluid (mACSF) containing the following (in mM): 132 choline, 2.5 KCl, 1.25 NaH2PO4, 25 NaHCO3, 7 MgCl2, 0.5 CaCl2, and 8 D-glucose; using a Leica VT1000S tissue slicer (Leica VTS1200S, Germany). Slices were then transferred for rest at room temperature (1-3h) or 34°C (1h) for electrophysiological recordings in oxygenated (95% O2 and 5% CO2) normal artificial CSF (ACSF) containing the following (in mM): 126 NaCl, 3.5 KCl, 1.2 NaH2PO4, 26 NaHCO3, 1.3 MgCl2, 2.0 CaCl2, and 10 D-glucose, pH 7.4.
In vitro electrophysiological recordings. Hippocampal slices were individually transferred to a
recording chamber maintained at 30–32°C and continuously perfused (2 ml/min) with oxygenated normal or adapted ACSF containing 5 μM gabazine. Synchronized burst discharges were evoked by antidromic stimulation of the mossy fiber pathway in the CA3b area while recording local field potentials in the dentate granular layer using a DAM-80 amplifier (lowfilter, 0.1 Hz; highpass filter, 3 KHz; World Precision Instruments, Sarasota, FL). Signals were analyzed off-line usingClampfit 9.2 (PClamp) and MiniAnalysis 6.0.1 (Synaptosoft, Decatur, GA). Whole-cell patch-clamp recordings were done using a MultiClamp 700B amplifier (Molecular Devices, USA). The patch pipette solution contained the following (in mM): 18 KCl-, 111 K-gluconate, 0.5 CaCl2, 2NaOH, 10 glucose, 10 HEPES, 2
Mg-ATP, and 5 BAPTA, (pH adjusted to 7.3 with KOH). Patch pipettes were fabricated from borosilicate glass (Harvard Apparatus, Edenbridge, UK), and their resistance ranged from 6.5 to 7.5 MΩ. Only cells with access resistances between 10 and 20 MΩ were accepted for analysis. Membrane potential was clamped at 60 mV. All membrane potential values were corrected for a liquid-junction potential of 10 mV. The reversal potential of GABAergic currents (EGABA) was
membrane at different voltage levels. GABA was photolyzed from the α-carboxy-2-nitrobenzyl (DPNI)-caged GABA compound (Tocris) using local uncaging as described previously29. Briefly, caged GABA (2.5 mM) was dissolved in the physiological solution and delivered at a flow rate of 1-3 μl/min to the vicinity of the patch-clamped cell using an Aladdin Programmable syringe pump (WPI, Sarasota, FL) and a syringe with an inner tip diameter of 100 μm. For local photolysis of caged GABA, the 405 nm output of a IQ Series laser diode module (Power Technology Inc.) was delivered to the slice via a multimode optical fiber through an Leica LUMPlanFl 40X water-immersion objective. The UV beam yielded an uncaging spot of 10 μm in diameter that was focused either at the soma or at dendrite at a distance of 100 μm from the soma28. At each location, current–voltage relationship was determined by varying the holding potential from −90 to −40 mV (10 mV steps). Duration of UV light stimuli was 50 ms.
In vivo electrophysiological recordings. Scalp electroencephalographic (EEG) recordings were
performed in freely-moving rats. To implant recording electrodes, rats were anaesthetized with 4.5% isoflurane and maintained at 2.5%, placed in stereotaxic frame, placed on a heating pad to control body temperature and prepared for aseptic surgery. A hole was drilled 2 mm posterior and 1.5 mm right to bregma. A screw connected to EEG transmitter was placed in the skull, and reference electrode was placed rostrally in the cerebellum. The screws were attached to the skull with dental cement and scalp closed. After surgery, rats were kept warm and received saline (0.9% NaCl, s.c.), and analgesic buprenorphine (0.03 mg/kg, s.c.) was administrated to minimize animal pain after surgery. After a 24h recovery, EEG (amplified (1000X), filtered at 0.16–97 Hz pass, acquired at 500 Hz) was monitored using a telemetric system (Data Sciences International, St. Paul, MN) for 5 days, 24 h per day; food and water were given ad libitum.
Recordings were analyzed offline using Spike2 8.0. Tonic seizures were defined on the EEG as single or multiple 5-30Hz poly-spike of 5 fold SD amplitude and 10-30 s duration13.
Statistical analysis. Data were expressed as means +/- S.E.M. Statistical analyses were performed
using GraphpadPrism (GraphPad software 6.01). For comparison between groups with normal distribution, the two-sample unpaired or paired Student’s t test was used for two groups. When data were not normally distributed, the Mann–Whitney rank-sum test (for unpaired data) or the two sample Kolmogorov–Smirnov rank-sum test (for paired data) was used. The one-way ANOVA all-Tukey test was used to compare multiples groups.
Results
NKCC1 and KCC2 expression is altered at day 5 post-SE
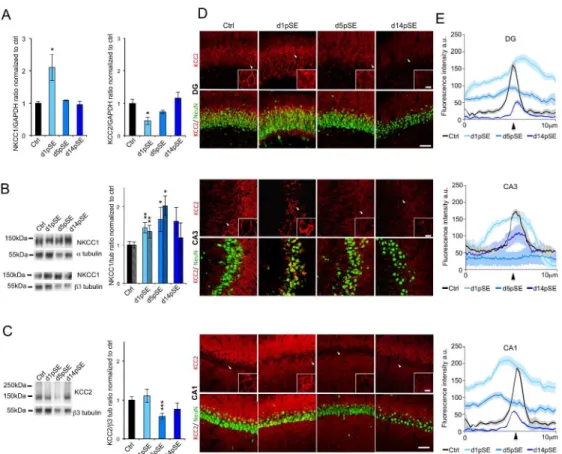
The expression of NKCC1 and KCC2 is known to be altered in TLE19-23. However, the temporal changes of these chloride transporters at early stages after SE remain elusive. We found that mRNA transcripts extracted from in toto hippocampi display an initial upregulation of NKCC1 and downregulation of KCC2 at day 1 post-SE (d1pSE) that returns to control levels 14 days post-SE (d14pSE) (Figure 1A; NKCC1; ctrl: 1 ± 0.11; d1: 2.10± 0.41; p<0.05; d5: 1.09± 0.02; d14: 0.95± 0.2; KCC2; ctrl: 1 ± 0.28; d1: 0.46 ± 0.02; p<0.05; d5: 0.73 ± 0.10; d14: 1.16± 0.35).
Using western blotting we found that the NKCC1 protein levels were significantly increased by 45% and 70% of control levels at d1pSE and d5pSE respectively with no significant alteration at d14pSE (Figure 1B; ctrl: 1 ± 0.08; d1: 1.45± 0.13; p<0.01; d5: 1.70± 0.24; p<0.05; d14: 1.62± 0.36, when normalized to 3-tubulin and ctrl: 1 ± 0.13; d1: 1.29± 0.12; p<0.01; d5: 2.07± 0.22; p<0.05; d14: 1.23± 0.41, when normalized to 〈-tubulin) when normalized to either 〈-tubulin or 3-tubulin. In contrast, the neuron-specific KCC2 protein was significantly reduced to 60% of the control levels at d5pSE with a tendency to a partial recovery at d14pSE (Figure 1C; ctrl: 1 ± 0.09; d1: 1.10± 0.17; d5: 0.58± 0,08; p<0.01; d14: 0.77± 0.16).
Immunohistochemistry towards KCC2 in pilocarpine-treated rats sections showed a preferential cytoplasmic immunoreactivity pattern at d1pSE with a tendency to return to control conditions at d14pSE but with lower fluorescence intensity (Figure 1D,E). This is in contrast to control conditions where KCC2 immunolabeling showed a strong perisomatic pattern. At d5pSE, KCC2 staining was very low and diffuse within the neuron cell bodies. These findings, showing an overall change in KCC2 neuronal distribution, were consistent within the DG, CA3, and CA1 regions (Figure 1D,E).
Taken together, our qRT-PCR, immunoblot and immunofluorescence results demonstrate that the most drastic dysregulation of both NKCC1 and KCC2 expressions occurred at d5pSE.
Bumetanide functionally reduces early established ectopic MF sprouting
A major reorganization of hippocampal network observed in both human patients and animal models of TLE is the ectopic MF sprouting7,30-32, a phenomenon partly responsible for the generation of epileptiform activities in human patients and animal models11,31 of TLE. However, although extensively studied during the chronic phase19,33, it has been poorly assessed during the early stages after SE29,30. Thus, we asked whether ectopic MF sprouting occurs in parallel to the robust changes in
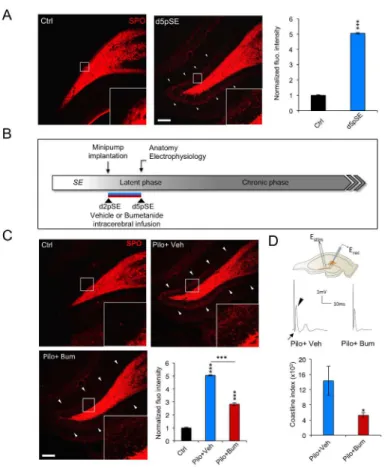
KCC2 and NKCC1 expression observed at d5pSE (Figure 1). Immunohistochemical visualization of rMF using synaptoporin (SPO) staining13,34 revealed a marked ectopic band in the molecular layer of DG and strong staining in the granular cell layer in pilocarpine-treated rats at d5pSE, while we found no ectopic band stained in control rats (Figure 2A; arrowheads ctrl: 1 ± 0.05; d5pSE: 5.05 ± 0.04, p<0.001). Thus, these results demonstrate that the ectopic MF sprouting is established at d5pSE, correlating with the pathological KCC2 and NKCC1 expression pattern.
We next asked whether abnormal chloride homeostasis might be involved in the early establishment of the ectopic MF sprouting. In order to achieve this, we use bumetanide to functionally block NKCC1. Because its blood-brain-barrier penetration has been challenged35,36, we infused bumetanide at a dose of 20μM, in accordance with previous pharmacokinetic studies37,38 intracerebrally and continuously from d2 to d5pSE, using osmotic minipumps (Figure 2B).
Interestingly, at d5pSE, we observed a 45% decrease in SPO fluorescence intensity in bumetanide-treated rats as compared to the vehicle-bumetanide-treated rats (Figure 2C; vehicle-bumetanide-treated rats: 5.03 ± 0.04 vs bumetanide-treated: 2.83 ± 0.049; p<0.001, normalized to control). In order to find out whether this rMF sprouting is functional as early as d5pSE, we performed the antidromic stimulation of the mossy fibers pathway in the CA3b area while recording local field potentials in the DG cell layer(Figure 2D). Importantly, we found that the evoked population burst was strongly reduced in bumetanide-treated rats as compared to vehicle-treated pilocarpine rats (Figure 2D; vehicle-treated vs bumetanide-treated: 14326.31± 3853 vs 5252.66 ± 1608; p<0.05).
Together these results demonstrate that a functional recurrent MF network is already in place at d5pSE. Strikingly, the use of bumetanide in vivo functionally reduced this ectopic MF sprouting.
Bumetanide blocked NKCC1 upregulation and rescued KCC2 function at d5pSE.
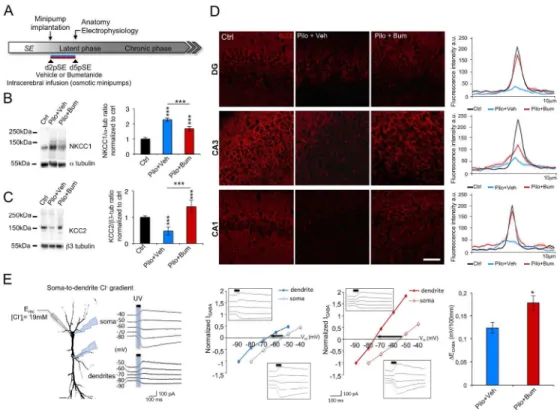
Several in vitro and in vivo studies have shown that bumetanide can affect the functional expression of NKCC121,22. To better understand the mechanism by which bumetanide reduced the ectopic MF sprouting and its aberrant network activity, we examined the effect of bumetanide on NKCC1 and KCC2 expression and function. Here, we show that intracerebral infusion of bumetanide partially blocked NKCC1 upregulation. Surprisingly, total KCC2 expression levels were fully restored in bumetanide-treated pilocarpine rats as compared to treated rats (Figure 3B; NKCC1: vehicle-treated rats: 2.28 ± 0.10 vs 1.68 ± 0.14; p<0.05, normalized to control. KCC2: vehicle-vehicle-treated vs bumetanide-treated rats: 0.47 ± 0.15 vs 1.40 ± 0.23; p<0.05, normalized to control). Using histological analysis, we show that KCC2 displays a preferentially perisomatic staining in bumetanide-treated rat similar to vehicle-bumetanide-treated rats at d5pSE in the DG, CA3 and CA1 regions (Figure 3D).
We next investigated whether bumetanide also restored KCC2 function. To investigate KCC2 ability to extrude Cl- we used the whole-cell patch-clamp approach coupled to GABA uncaging in hippocampal slices in the CA1 region (Figure 3E). The approach consists of inducing a somatic load of chloride through the patch pipette followed by uncaging of GABA at the soma and at a distance of 100μm in the apical dendrite. In vehicle-treated rats, we observed that the EGABA gradient was significantly
smaller (Figure 3E, 0.12 ± 0.005mV/100μm) than in bumetanidetreated rats at d5pSE (Figure 3E, -0.17 ± 0.007mV/100μm). The later was almost identical to the levels previously measured for this age28.
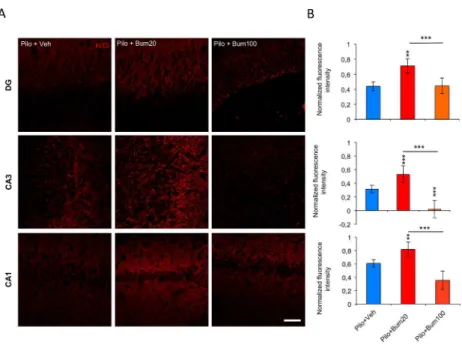
Although there is ample evidence for the specificity of bumetanide as inhibitor of NKCC1 uptake activity, when used at low concentration, the effect observed could be derived from nonspecific action of this compound due to tissue accumulation. Interestingly, high concentration of bumetanide (100µM) exacerbated the KCC2 downregulation observed at d5pSE (Figure 4; DG: vehicle-treated rats: 0,44 ± 0,09 vs bumetanide 20-treated: 0,71 ± 0,1; p<0.01 vs bumetanide 100-treated: 0,44 ± 0,08; p<0.001; CA3: vehicle-treated rats: 0,31 ± 0,12 vs bumetanide 20-treated: 0,53 ± 0,12; p<0.001 vs bumetanide 100-treated: 0,01 ± 0,11; p<0.001 and CA1: vehicle-treated rats: 0,60 ± 0,10 vs bumetanide 20-treated: 0,81 ± 0,13; p<0.01 vs bumetanide 100-treated: 0,35 ± 0,11; p<0.001). This result shows that nonspecific effects due to either accumulation of bumetanide and derived inhibition of KCC2, would result in opposite effects. Our findings show that intracerebral bumetanide infusion from d2 to d5pSE rats at low concentration is specific, able to partially block NKCC1 expression, and restored not only KCC2 protein expression but also its function at d5pSE within the hippocampus.
p75NTR upregulation drives the ectopic MF sprouting and is blocked by bumetanide
We have previously shown that, in axotomized organotypic hippocampal slices, altered NKCC1/KCC2 balance induced p75NTR upregulation that could be prevented by bumetanide26. P75NTR is also known to play a key role in neurite outgrowth39,40 and is crucial for axon formation in the DG under physiological conditions40. Therefore, we asked whether bumetanide could regulate p75NTR expression to mediate the effects observed on the ectopic MF sprouting at d5pSE (Figure 5A). Using western blot from in toto hippocampi, we found that p75NTR expression level was reduced in bumetanide-treated rats as compared to vehicle-treated rats at d5pSE (Figure 5B, vehicle-treated vs bumetanide-treated rats: 1.42 ± 0.13 vs 0.90 ± 0.13; p<0.05, normalized to control 1 ± 0.09). Then, using immunohistochemistry, we showed that as previously described41,42, p75NTR was expressed at low level in DGCs in control conditions. Interestingly, bumetanide application strongly reduced the
SE-induced abnormal p75NTR expression within the granule cells at d5pSE (Figure 5C, vehicle-treated vs bumetanide-treated rats: 1.64 ± 0.04 vs 1.14 ± 0.02; p<0.001, normalized to control).
Finally, in order to establish if p75NTR upregulation is involved in the formation of ectopic MF sprouting, we decided to infuse intracerebrally a previously validated24 p75NTR functionally blocking
antibody (p75NTR-Ab) from d2 to d5pSE (Figure 5D for the experimental design). Interestingly, SPO staining revealed significantly decreased fluorescence intensity in p75NTR Ab-treated as compared to vehicle- or IgG-treated rats at d5pSE (Figure 5D, IgG-treated rats: 6,27 ± 0,57; vehicle-treated vs p75NTR Ab-treated rats: 5.06 ± 0.5 vs 3.17 ± 0.24; p<0.001, normalized to control).
Altogether these results suggest that bumetanide-mediated functional reduction of ectopic MF sprouting is, at least partly, mediated by p75NTR upregulation blockade in vivo at d5pSE in the pilocarpine model of TLE.
Early bumetanide infusion reduced seizure frequency during the chronic phase of TLE
The transient application of bumetanide had profound positive effects on morphological and functional reorganization as well as on functional expression of chloride homeostasis regulatory proteins within the hippocampal formation during the early post-SE window.
To examine whether transitory application of bumetanide early after SE had a long-lasting effects, we used a similar approach to the one use above with the difference that sprouting is analyzed during the chronic and not the early phase of TLE (Figure 6A). The examination of the cortical EEG (24h/d) from d2 to d5 post-SE did not reveal interictal and ictal activities under the present experimental conditions in vehicle nor bumetanide infused animals (data not shown). However, following bumetanide infusion from d2 to d5 post-SE, SPO staining revealed a reduction of the ectopic band in the molecular layer of DG in bumetanide-treated rats as compared to vehicle-treated rats at 2 months post-SE (Figure 6B; vehicle-treated vs bumetanide treated: 7.34 ± 0,35 vs 6.11 ± 0,41; p<0.05, normalized to control). This interesting long-lasting effect of bumetanide on ectopic MF sprouting prompted us to analyze the seizure activity with telemetric scalp EEG recordings at 2 months post-SE after the rats underwent the same experimental paradigm as in the previous experiments (Figure 6A). In this chronic condition, we observed that the number of ictal events was reduced by 50% in the bumetanide-treated group as compared to the vehicle-treated group (Figure
6C-E: vehicle-treated vs bumetanide treated: 13.94 ± 0,74 vs 7.05 ± 0,39; p<0.05, normalized to
control), without a significant change in their duration (Figure 6D; vehicle-treated vs bumetanide treated: 18.59 ± 0,71 vs 17.65 ± 1.04; p>0.05).
Discussion
Studies on TLE show that a major glutamatergic circuit reorganization within the DG, the ectopic rMF, is responsible for an increase in hippocampal excitability and recurrent seizures1,43. Equally strong evidence has been found showing that adult seizures are generated in a circuit in which GABAAR-mediated inhibition is impaired21,44. Within this context, compromised GABAergic
inhibition resulting from chloride homeostasis dysregulation in epileptic-like conditions has been extensively studied both in animal models and human resections in TLE19-23. In these studies, acute use of bumetanide, leading to restoration of chloride homeostasis, has been shown to have potent anticonvulsant effects in the adult brain. However, whether GABAergic depolarization plays a role in the precipitating events of epileptogenesis and could exert long-term effect on morphological and functional features of glutamatergic network rewiring and subsequently affect seizure activity has not been assessed. Here, we have addressed these issues by using a pilocarpine model of TLE. First, we found that early ectopic rMF sprouting and subsequent rMF-driven network aberrant activity was established as early as 5 days after the SE. This time point coincided with NKCC1 upregulation and KCC2 downregulation. Importantly, we showed that functional inhibition of NKCC1 with the loop durietic bumetanide from d2 to d5 post-SE resulted in restoration of chloride homeostasis and robust attenuation of rMF-driven network activity during early epileptogenesis. These effects extended to the chronic epileptic phase and resulted in strongly reduced seizure frequency. The mechanism appears to involve upregulation of the pan neurotrophin receptor p75NTR as inhibition of
NKCC1 activity significantly reduced the SE-induced upregulation of this receptor. Previous studies have suggested the involvement of NGF/TrkA/p75NTR signaling on MF sprouting in a kindling animal model17. We now also demonstrate that p75NTR is a key factor in the early establishment of the ectopic rMF sprouting in TLE as: i) in accordance to previous studies45,46 p75NTR is upregulated at d5pSE, ii) while bumetanide strongly reduced the ectopic rMF sprouting it also blocked p75NTR upregulation, iii) a functionally blocking p75NTR antibody reduced the ectopic rMF sprouting. Furthermore, previous reports suggest a role of GABAAR-mediated depolarization on axonal
elongation during development and adult neurogenesis47. Our results show that early post-SE bumetanide application reduces ectopic rMF, p75NTR expression, and chronic seizures. These effects are associated with impairment of GABAAR-mediated depolarization by bumetanide through its
specific inhibitory action on the chloride co-transporter NKCC1. Future investigations are required to elucidate the causal relationship between altered GABAergic transmission and aberrant neurotrophin signaling under pathological conditions.
The reported results also suggest that the ectopic MF sprouting, promoted by chloride homeostasis dysregulation and p75NTR signaling pathway during early epileptogenesis, plays a key role for the
development of chronic seizures since post-SE application of bumetanide reduced the number of spontaneous and recurrent seizures in chronic epileptic rats.
It is plausible that the effects exerted by bumetanide are mediated through an effect on post-SE remnant seizure activity. Indeed, bumetanide has been shown to have anticonvulsant action in numerous seizure models25. Within the early period following SE (2-3 days post-SE), sporadic remnant interictal and ictal activities can occur48,49. However, in the present experimental paradigm, the pilocarpine-treated rats exhibit a seizure-free period from day 2 to day 5 post-SE (data not shown). Nonetheless, we cannot exclude an effect of bumetanide on sporadic hippocampal inter-ictal events that could not be reliably detected from cortical EEG recordings in contrast to seizure activity. Further studies are necessary to dissect if and how GABA depolarization is involved in post SE network activity during early epileptogenesis.
Altogether, the present study suggests that SE-induced depolarizing GABAergic signaling could play a mechanistic role in the early and long lasting rewiring of glutamatergic networks that is implicated in the severity of chronic seizures. These results also prompt to investigate optimal conditions for better and more efficient restriction of seizures in the chronic phase using this approach.
In the clinical setting of symptomatic and unprovoked epilepsy the use of anti-epileptic drug prophylaxis during the acute period following SE is recommended50,51. In addition, symptomatic epilepsy specially involving the temporal lobe often displays pharmaco-resistance to available antiepileptic drugs. Thus, the results presented here prompt us to conclude that normalizing chloride homeostasis with the FDA-approved drug bumetanide during the acute posttraumatic period could be able to sustainably reduce the pathological glutamatergic network rewiring and subsequent chronic adult epilepsy. Moreover, prophylactic approaches to correct dysregulation of GABAergic transmission and p75NTR signalling are novel clinically relevant targets that could complement the current therapy following acute symptomatic seizures.
Acknowledgments
This work was supported by the Institut National de la Santé et de la Recherhce Médicale (INSERM), Aix-Marseille Université, University of Helsinki, the Agence Nationale de la Recherche (ANR) (TRAUMEP ANR 13-BSV4-0012-02 to C.R. and V.C.), Academy of Finland (SA 259799 to CR) the Ministère de l’Enseignement Supérieur et de la Recherche (MESR to N.K.), and the Ligue Française Contre l’Epilepsie (LFCE to N.K.). We thank Dr Rosa Cossart for implanting the EEG system at INMED, the imaging plateform InMagic headed by Dr. François Michel and animal house facility headed by Séverine Corby-Pellegrino. We thank Ms Marjo Vaha for technical help. We are grateful to Drs. Rosa Cossart and Ingrid Bureau for critical reading of the manuscript.
Author contributions
Study concept and design: N.K., C.P. and C.R.. Data acquisition and analysis: N.K., C.P., C.R., S.K. (patch-clamp experiments), N.K., J-L.G. V.C., C.R. and S.K. (additional electrophysiological experiments), J-M. R., R.K.T., N.K. and C.R. (design of intracerebral infusion), Z.L. and E.C. (part of western blot experiment). Drafting the manuscript and figures: N.K., V.C. and C.R.
Potential conflict of interest
A patent (EPI15306384) has been filled by INSERM Transfert “Methods and pharmaceutical composition for the treatment of post-traumatic epilepsies”.
References
1. Dudek, F.E., and Sutula, T.P. (2007). Epileptogenesis in the dentate gyrus: a critical perspective. Prog. Brain Res. 163, 755–773.
2. Kharatishvili, I., and Pitkänen, A. (2010). Posttraumatic epilepsy. Current Opinion in Neurology 23, 183–188.
3. Morimoto, K., Fahnestock, M., and Racine, R.J. (2004). Kindling and status epilepticus models of epilepsy: rewiring the brain. Progress in Neurobiology. 73, 1–60.
4. Jefferys, J.G.R., 2010. Advances in understanding basic mechanisms of epilepsy and seizures. Seizure: European Journal of Epilepsy, 19(10), pp.638–646.
5. Paz, J.T., and Huguenard, J.R. (2015). Microcircuits and their interactions in epilepsy: is the focus out of focus? Nature Neuroscience 18, 351–359.
6. Tauck, D.L., and Nadler, J.V. (1985). Evidence of functional mossy fiber sprouting in hippocampal formation of kainic acid-treated rats. Journal of Neuroscience 5, 1016–1022. 7. Represa, A., Le Gall La Salle, G., and Ben-Ari, Y. (1989). Hippocampal plasticity in the kindling
model of epilepsy in rats. Neuroscience Letters 99, 345–350.
8. Frotscher, M. (1989). Mossy fiber synapses on glutamate decarboxylase-immunoreactive neurons: evidence for feed-forward inhibition in the CA3 region of the hippocampus. Exp Brain Res 75, 441–445.
9. Sutula, T., Cascino, G., Cavazos, J., Parada, I., and Ramirez, L. (1989). Mossy fiber synaptic reorganization in the epileptic human temporal lobe. Annals of Neurology. 26, 321–330. 10. Golarai, G., Greenwood, A.C., Feeney, D.M., and Connor, J.A. (2001). Physiological and
structural evidence for hippocampal involvement in persistent seizure susceptibility after traumatic brain injury. Journal of Neuroscience 21, 8523–8537.
11. Gabriel, S., Njunting, M., Pomper, J.K., Merschhemke, M., Sanabria, E.R.G., Eilers, A., Kivi, A., Zeller, M., Meencke, H.-J., Cavalheiro, E.A., et al. (2004). Stimulus and potassium-induced epileptiform activity in the human dentate gyrus from patients with and without hippocampal sclerosis. Journal of Neuroscience 24, 10416–10430.
12. de Lanerolle, N.C., Lee, T.-S., and Spencer, D.D. (2012). Histopathology of Human Epilepsy. 13. Peret, A., Christie, L.A., Ouedraogo, D.W., Gorlewicz, A., Epsztein, J., Mulle, C., and Crépel, V.
(2014). Contribution of aberrant GluK2-containing kainate receptors to chronic seizures in temporal lobe epilepsy. Cell Reports 8, 347–354.
14. Guilhem, D., Dreyfus, P.A., Makiura, Y., Suzuki, F., and Onteniente, B. (1996). Short increase of BDNF messenger RNA triggers kainic acid-induced neuronal hypertrophy in adult mice. Nsc 72, 923–931.
15. Danzer, S.C., Crooks, K.R.C., Lo, D.C., and McNamara, J.O. (2002). Increased expression of brain-derived neurotrophic factor induces formation of basal dendrites and axonal branching in dentate granule cells in hippocampal explant cultures. Journal of Neuroscience 22, 9754– 9763.
16. Scharfman HE, Goodman JH, Sollas AL, Croll SD. Spontaneous limbic seizures afterintrahippocampal infusion of brain-derived neurotrophic factor. Exp Neurol 2002;174:201–214.
17. Li, S., Uri Saragovi, H., Racine, R.J., and Fahnestock, M. (2003). A ligand of the p65/p95 receptor suppresses perforant path kindling, kindling-induced mossy fiber sprouting, and hilar area changes in adult rats. Neuroscience 119, 1147–1156.
18. Koyama, R., Yamada, M. K., Fujisawa, S., Katoh-Semba, R., Matsuki, N., and Ikegaya, Y. (2004). Brain-derived neurotrophic factor induces hyperexcitable reentrant circuits in the dentate gyrus. Journal of Neuroscience 24, 7215–7224. doi:10.1523/JNEUROSCI.2045-04.2004.
19. Palma, E., Amici, M., Sobrero, F., Spinelli, G., Di Angelantonio, S., Ragozzino, D., Mascia, A., Scoppetta, C., Esposito, V., Miledi, R., et al. (2006). Anomalous levels of Cl- transporters in the hippocampal subiculum from temporal lobe epilepsy patients make GABA excitatory. Proc. Natl. Acad. Sci. U.S.a. 103, 8465–8468.
20. Huberfeld, G., Wittner, L., Clemenceau, S., Baulac, M., Kaila, K., Miles, R., and Rivera, C. (2007). Perturbed Chloride Homeostasis and GABAergic Signaling in Human Temporal Lobe Epilepsy. Journal of Neuroscience 27, 9866–9873.
21. Pathak, H.R., Weissinger, F., Terunuma, M., Carlson, G.C., Hsu, F.-C., Moss, S.J., and Coulter, D.A. (2007). Disrupted dentate granule cell chloride regulation enhances synaptic excitability during development of temporal lobe epilepsy. Journal of Neuroscience 27, 14012–14022.
22. Bragin, D.E., Sanderson, J.L., Peterson, S., Connor, J.A., and Müller, W.S. (2009). Development of epileptiform excitability in the deep entorhinal cortex after status epilepticus. European Journal of Neuroscience 30, 611–624.
23. Barmashenko, G., Hefft, S., Aertsen, A., Kirschstein, T., and Köhling, R. (2011). Positive shifts of the GABAA receptor reversal potential due to altered chloride homeostasis is widespread after status epilepticus. Epilepsia 52, 1570–1578.
24. Shulga, A., Magalhaes, A.C., Autio, H., Plantman, S., di Lieto, A., Nykjaer, A., Carlstedt, T., Risling, M., Arumae, U., Castren, E., et al. (2012). The Loop Diuretic Bumetanide Blocks Posttraumatic p75NTR Upregulation and Rescues Injured Neurons. Journal of Neuroscience 32, 1757–1770.
25. Puskarjov M, Kahle KT, Ruusuvuori E, Kaila K. (2014) Pharmacotherapeutic targeting of cation-chloride cotransporters in neonatal seizures. Epilepsia. 2014 Jun;55(6):806-18. doi: 10.1111/epi.12620.
26. Artinian, J., Peret, A., Marti, G., Epsztein, J., and Crépel, V. (2011). Synaptic kainate receptors in interplay with INaP shift the sparse firing of dentate granule cells to a sustained rhythmic mode in temporal lobe epilepsy. Journal of Neuroscience 31, 10811–10818.
27. Curia, G., Longo, D., Biagini, G., Jones, R. S. G., and Avoli, M. (2008). The pilocarpine model of temporal lobe epilepsy. J Neurosci Method 172, 143–157.
doi:10.1016/j.jneumeth.2008.04.019.
28. Scharfman, H. E. and MacLusky, N. J. (2014). Sex differences in the neurobiology of epilepsy: A preclinical perspective. Neurobiol Dis 72, Part B IS , 180–192.
29. Khirug, S., Huttu, K., Ludwig, A., Smirnov, S., Voipio, J., Rivera, C., Kaila, K., and Khiroug, L. (2005). Distinct properties of functional KCC2 expression in immature mouse hippocampal neurons in culture and in acute slices. European Journal of Neuroscience 21, 899–904. 30. Mathern, G.W., Pretorius, J.K., Mendoza, D., Lozada, A., and Kornblum, H.I. (1998).
Hippocampal AMPA and NMDA mRNA levels correlate with aberrant fascia dentata mossy fiber sprouting in the pilocarpine model of spontaneous limbic epilepsy. Journal of Neuroscience Research 54, 734–753.
31. Harvey, B.D., and Sloviter, R.S. (2005). Hippocampal granule cell activity and c-Fos expression during spontaneous seizures in awake, chronically epileptic, pilocarpine-treated rats: implications for hippocampal epileptogenesis. Journal of Comparative Neurology 488, 442– 463.
32. Scharfman, H.E., and McCloskey, D.P. (2009). Postnatal neurogenesis as a therapeutic target in temporal lobe epilepsy. Epilepsy Research 85, 150–161.
33. Epsztein, J., Represa, A., Jorquera, I., Ben-Ari, Y., and Crépel, V. (2005). Recurrent mossy fibers establish aberrant kainate receptor-operated synapses on granule cells from epileptic rats. Journal of Neuroscience 25, 8229–8239.
Stereologic estimation of hippocampal GluR2/3- and calretinin-immunoreactive hilar neurons (presumptive mossy cells) in two mouse models of temporal lobe epilepsy. Epilepsia 52, 1579–1589.
35. Javaheri, S., Davis, C., and Rogers, D.H. (1993). Ionic composition of cisternal CSF in acute respiratory acidosis: lack of effect of large dose bumetanide. Journal of Neurochemistry 61, 1525–1529.
36. Brandt, C., Nozadze, M., Heuchert, N., Rattka, M., and Loscher, W. (2010). Disease-Modifying Effects of Phenobarbital and the NKCC1 Inhibitor Bumetanide in the Pilocarpine Model of Temporal Lobe Epilepsy. Journal of Neuroscience 30, 8602–8612.
37. Töllner K, Brandt C, Töpfer M, Brunhofer G, Erker T, Gabriel M, Feit PW, Lindfors J, Kaila K, Löscher W (2014) A novel prodrug-based strategy to increase effects of bumetanide in epilepsy. Ann Neurol 75:550–562.
38. Töpfer M, Töllner K, Brandt C, Twele F, Bröer S, Löscher W (2013) Consequences of inhibition of bumetanide metabolism in rodents on brain penetration and effects of bumetanide in chronic models of epilepsy. Eur J Neurosci.
39. Cheng, P.-L., and Poo, M.-M. (2012). Early Events in Axon/Dendrite Polarization. Annu. Rev. Neurosci. 35, 181–201.
40. Howard, L., Wyatt, S., Nagappan, G., and Davies, A.M. (2013). ProNGF promotes neurite growth from a subset of NGF-dependent neurons by a p75NTR-dependent mechanism. Development 140, 2108–2117.
41. Zuccaro, E., Bergami, M., Vignoli, B., Bony, G., Pierchala, B.A., Santi, S., Cancedda, L., and Canossa, M. (2014). Polarized Expression of p75NTR Specifies Axons during Development and Adult Neurogenesis. Cell Reports 1–15.
42. Dougherty, K.D., and Milner, T.A. (1999). p75NTR immunoreactivity in the rat dentate gyrus is mostly within presynaptic profiles but is also found in some astrocytic and postsynaptic profiles. Journal of Comparative Neurology. 407, 77–91.
43. Crépel, V., and Mulle, C. (2015). Physiopathology of kainate receptors in epilepsy. Curr Opin Pharmacol 20, 83–88.
44. Coulter, D.A., and Carlson, G.C. (2007). Functional regulation of the dentate gyrus by GABA-mediated inhibition. Prog. Brain Res. 163, 235–243.
45. Volosin, M., Trotter, C., Cragnolini, A., Kenchappa, R.S., Light, M., Hempstead, B.L., Carter, B.D., and Friedman, W.J. (2008). Induction of proneurotrophins and activation of p75NTR-mediated apoptosis via neurotrophin receptor-interacting factor in hippocampal neurons after seizures. Journal of Neuroscience 28, 9870–9879.
46. VonDran, M.W., LaFrancois, J., Padow, V.A., Friedman, W.J., Scharfman, H.E., Milner, T.A., and Hempstead, B.L. (2014). p75NTR, but Not proNGF, Is Upregulated Following Status Epilepticus in Mice. ASN Neuro 6, 1–19.
47. Sernagor, E., Chabrol, F., Bony, G., and Cancedda, L. (2010). GABAergic control of neurite outgrowth and remodeling during development and adult neurogenesis: general rules and differences in diverse systems. Frontiers in Cellular Neuroscience 4, 11.
48. André V, Ferrandon A, Marescaux C, Nehlig A. (2001) Vigabatrin protects against hippocampal damage but is not antiepileptogenic in the lithium-pilocarpine model of temporal lobe epilepsy. Epilepsy Res. 2001 Nov;47(1-2):99-117.
49. Curia G, Longo D, Biagini G, Jones RSG, Avoli M. (2008) The pilocarpine model of temporal lobe epilepsy. J of Neurosci Meth 172:143–157.
50. Hesdorffer, D.C., Logroscino, G., Cascino, G., Annegers, J.F., and Hauser, W.A. (1998). Risk of unprovoked seizure after acute symptomatic seizure: effect of status epilepticus. Ann Neurol. 44, 908–912.
51. Rowland, L.P., and Pedley, T.A. (2010). Merritt's Neurology (Lippincott Williams & Wilkins).
Figure legends
Figure 1. Altered NKCC1 and KCC2 expression in hippocampus after Status Epilepticus. (A) Relative
expression of NKCC1 and KCC2 mRNA transcripts by qRT-PCR of in toto hippocampi as function of GAPDH expression. Values are normalized to control rats (n=3 per group). (B) Representative immunoblot for NKCC1 protein extracts from in toto hippocampi. Corresponding quantification are normalized to ctrl and expressed relative to a-tubulin (dashed bars) and b3-tubulin (empty bars) as shown by the bar graph (n=6-7 per group). (C). Representative immunoblot for KCC2 protein extracts from in toto hippocampi. Corresponding quantification normalized to ctrl and expressed relative to b3-tubulin levels (n=6-7 per group). (D) Representative images of KCC2 (red) and NeuN (green) staining in DG (top), CA3 (middle) and CA1 (bottom) regions in control and at d1, d5 and d14 post-SE. Insets show a higher magnification of cells pointed by the arrowheads. While in control condition KCC2 staining is preferentially perisomatic, following SE the staining is diffuse within the NeuN-poistive cell bodies. Note that the KCC2 staining is very low at d5pSE. DG: dentate gyrus; CA: Cornu Ammonis; a.u.: arbitrary unit.(E) Average curve profile of KCC2 staining in DG, CA3, and CA1 regions at day 1, 5, and 14 post-SE (n=3-4 per group). The curves represent the plot profile of KCC2 staining along 10µm from the nucleus to the external neuropil of the neurons analyzed. Notice that in control condition but not following SE, peak of KCC2 immunofluorescence occurs at the putative membrane location (arrowhead). Data are means ± SEM; p value obtained using t test analysis; * p<0.05; ** p<0.01, *** p<0.001. Scale bars are 10µm for insets and 100µm for full pictures.
Figure 2. In vivo bumetanide functionally reduces ectopic MFs sprouting at d5pSE. (A) Left,
Immunolabelling of synaptoporin (SPO) of mossy fibers. Ectopic rMF sprouting is observed in the molecular layer of both ventral and dorsal DG in pilocarpine-treated rats and is absent in control rats
(arrowheads). Insets show higher magnification of the region depicted by the white squares. DG: dentate gyrus. Right, corresponding quantification of the fluorescence intensity normalized to control condition. Data are mean ± SEM (n=3 control rats and n=6 pilocarpine-treated for d5pSE); *** p<0.001, p value are obtained using t test analysis. Scale bar represents 150µm. (B) Experimental paradigm design. Bumetanide or vehicle solutions are infused intracerebrally from d2 to d5pSE using osmotic minipumps and experiments are performed at d5pSE. SE: status epilepticus. (C) SPO staining revealed an ectopic rMF band in the molecular layer of the DG in vehicle-treated rats that was strongly reduced in bumetanide-treated rats and absent under control condition (arrowheads). Insets show higher magnification of the region depicted by the white squares. DG: dentate gyrus. Corresponding quantification of the fluorescence intensity of synaptoporin in vehicle- and bumetanide-treated d5pSE rats normalized to control condition. (n=3 for control rats; n=5-6 vehicle- and bumetanide-treated rats). Scale bar represents 150µm; *** p<0.001, using Tukey multiple-comparison test two-way ANOVA analysis. (D) Top, scheme of hippocampal slice with the CA3c-DG antidromic stimulation protocol. Traces are average of 100 sweeps in both conditions. The arrow shows an antidromic population spike followed by a burst (arrowhead). Estim: stimulation electrode in
CA3c region; Erec: recording electrode in DG cell layer. Down, corresponding bar graph represents the
mean coastline burst index observed in slices from vehicle and bumetanide-treated d5pSE rats. (n=3-4 rats for vehicle- or bumetanide-treated rats).
Figure 3. In vivo bumetanide application rescues NKCC1 expression and KCC2 function at d5pSE. (A)
Experimental paradigm design. Bumetanide or vehicle solutions are infused intracerebrally from d2 to d5pSE using osmotic minipumps and experiments are performed at d5pSE. (B) Representative immunoblot for NKCC1 protein extracts from in toto hippocampus under control condition, after vehicle or bumetanide infusion at d5pSE. Corresponding quantification normalized to ctrl and expressed relative to a-tubulin levels (n=4-6 per group) (C) Representative immunoblot for KCC2 protein extracts from in toto hippocampus under control condition, after vehicle or bumetanide infusion at d5pSE. Corresponding quantification are shown in the bar graph. The data are normalized to ctrl and expressed relative to b3-tubulin levels. (n=4-6 per group). (D) Left, KCC2 staining (red) in DG (top), CA3 (middle) and CA1 (bottom) regions in control, vehicle-treated d5pSE, and bumetanide-treated d5pSE rats (n=3 for control, n=5-6 for vehicle- or bumetanide-bumetanide-treated). Scale bar represents 100µm. Right, Average curve profile of KCC2 staining in DG, CA3, and CA1 regions at different days post-SE in vehicle- and bumetanide-treated rats. The curves represent the plot profile of KCC2 staining along 10µm from the nucleus to the external neuropil of the neurons analysed in control (black), vehicle-treated (blue) and bumetanide-treated (red) conditions. Notice that KCC2 intensity and pattern expression recovered to control conditions following bumetanide application as shown
by the images and plot profile. (E) Left, the scheme represents the whole-cell patch-clamp recordings of uncaging GABAA-mediated currents (IGABA) and DEGABA between soma and dendrite of a pyramidal
neuron from CA1 region with an artificially imposed somatic Cl- load. IGABA: GABAA-mediated currents;
EGABA: GABA reversal potential; UV: 405nm light stimuli for GABA uncaging (50ms); Vm: resting
membrane potential. Representative currents of the soma and dendrites are shown following UV-induced GABA uncaging. Middle, the I/V curve obtained in neurons from vehicle- (blue curves) or bumetanide-treated (red curves) animals at d5pSE. The arrow shows that the soma-to-dendrite gradient is greater following in vivo bumetanide application. Insets show the current following UV light (line) in dendrties (upper panel) and soma (lower panel). Right, bar graph represents the quantification of the imposed soma-to-dendrite DEGABA under vehicle- and bumetanide-treated
condition at d5pSE. (n=3-4 per group). Data are means ± SEM; *p<0.05, *** p<0.001, p value obtained using two-way ANOVA in (B, C, D) and Mann-Whitney U test in (E).
Figure 4. In vivo infusion of high dose bumetanide alters KCC2 expression at d5pSE. (A) KCC2
staining in DG (top), CA3 (middle) and CA1 (bottom) regions in pilocarpine vehicle-treated, 20µM bumetanide-treated and 100µM bumetanide-treated rats. Note that following high dose of bumetanide application, KCC2 intensity is very low as compared to low dose of bumetanide. DG: dentate gyrus; CA: Cornu Ammonis; a.u.: arbitrary unit. Scale bar is 10µm. (B) Corresponding bar graph of global KCC2 fluorescence intensity, in the DG, CA3 and CA1 regions. (n=3-4 per group). Data are means ± SEM; ** p<0.01, and *** p<0.001, using Tukey multiple-comparison test two-way ANOVA analysis.
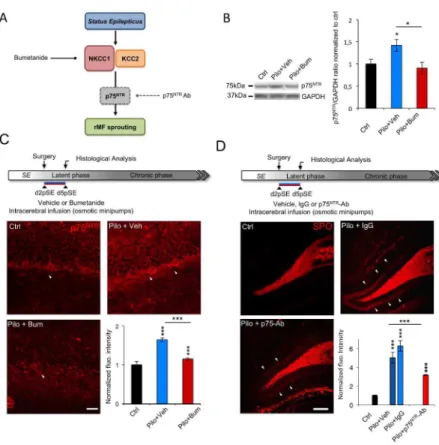
Figure 5. Bumetanide-induced ectopic MF sprouting reduction involves post-SE induced p75NTR up-regulation. (A) Scheme summarizing working hypothesis. Bumetanide restored NKCC1/KCC2 balance
and reduced ectopic MF sprouting. We next ask whether p75NTR could mediate this effect. (B) Representative immunoblot for p75NTR protein extracts from in toto hippocampus in vehicle- and bumetanide-treated rats at d5pSE. Right, corresponding quantification normalized to ctrl and expressed relative to GADPH levels (n=3-4 per group). (C) Top, experimental paradigm design. Bumetanide or vehicle solutions are infused intracerebrally from d2 to d5pSE and immunohistochemical analysis of p75NTR is performed at d5pSE. Bottom, p75NTR immunostaining performed in DG of control, vehicle- and bumetanide-treated rats. Granular cells are p75NTR positive (arrowhead) and immunoreactivity surrounding the granular cell layer in control condition and under vehicle or bumetanide condition. Corresponding fluorescence intensity quantification is shown by the bar graph; values are normalized to ctrl (n=3 for ctrl, n=4-6 for vehicle-or bumetanide-treated rats). (D) Top, illustration of experimental procedure. Intracerebral infusion of blocking p75NTR
antibody performed from d2 to d5pSE and analysis of the ectopic MF sprouting at d5pSE. Bottom, synaptoporin revealed an ectopic MF band in the molecular layer of the DG in vehicle- and IgG-treated rats that was faint in p75NTR antibody-treated rats (arrowhead). Corresponding quantification of the fluorescence intensity normalized to control condition (n=3 for ctrl, n=4-6 for vehicle-or bumetanide-treated rats). Data are means ± SEM; *p<0.05, *** p<0.001, p value are obtained using using Tukey multiple-comparison test two-way ANOVA analysis. Scale bar represents 150µm.
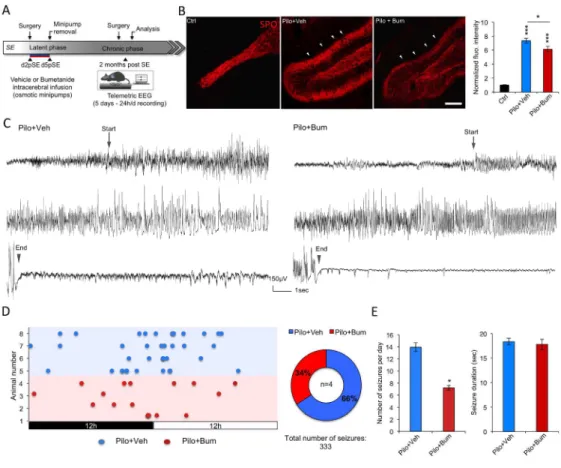
Figure 6. Early bumetanide application reduces rMFS and seizures in vivo at 2 months post-SE. (A)
Experimental paradigm design and example of seizure recorded at 2 months post-SE using telemetric EEG. Bumetanide or vehicle solutions are infused intracerebrally from d2 to d5pSE. The seizure frequency and rMF sprouting is assessed 2 months after the end of bumetanide infusion using scalp electrodes and telemetric EEG as well as histological studies. (B) Synaptoporin staining labeled the mossy fibers and revealed a strong ectopic MF band in the molecular layer of the DG (arrowheads) of vehicle-treated rats. The intensity of this band was clearly decreased in bumetanide-treated animals. The corresponding bar graph represents the quantification of the fluorescence intensity of the ectopic MF sprouting in vehicle- and bumetanide-treated d5pSE rats normalized to control condition. Data are means ± SEM; *p<0.05, *** p<0.01 p value are obtained using Tukey multiple-comparison test two-way ANOVA analysis. (C) Examples of typical ictal events recorded using telemetric EEG in vehicle-treated and bumetanide-treated rats at 2MpSE. Arrows show the start of seizure and arrowheads the end of seizure. (D) Left, distribution of electrographic seizures over 24h (day/night period) for vehicle-treated (blue) and bumetanide-treated rats (red). Right, pie chart showing the fraction of ictal events recorded in vehicle- and bumetanide-treated rats over 5 days, 24/24h recording (219 and 114 ictal events, respectively; n=4 rats per group). (E) Left, bar graph representing the seizure frequency observed in vehicle- and bumetanide-treated rats per day. Data are means ± SEM; *p<0.05, p value are obtained using Mann-Whitney U test. Right, bar graph showing the duration of ictal events in vehicle-treated and bumetanide-treated rats. (n=4 per group). Data are means ± SEM; p>0.05 using Mann-Whitney U test.
Figure 1. Altered NKCC1 and KCC2 expression in hippocampus after Status Epilepticus. (A) Relative expression of NKCC1 and KCC2 mRNA transcripts by qRT-PCR of in toto hippocampi as function of GAPDH
expression. Values are normalized to control rats (n=3 per group). (B) Representative immunoblot for NKCC1 protein extracts from in toto hippocampi. Corresponding quantification are normalized to ctrl and expressed relative to α-tubulin (dashed bars) and β3-tubulin (empty bars) as shown by the bar graph
(n=6-7 per group). (C). Representative immunoblot for KCC2 protein extracts from in toto hippocampi. Corresponding quantification normalized to ctrl and expressed relative to β3-tubulin levels (n=6-7 per group). (D) Representative images of KCC2 (red) and NeuN (green) staining in DG (top), CA3 (middle) and CA1 (bottom) regions in control and at d1, d5 and d14 post-SE. Insets show a higher magnification of cells pointed by the arrowheads. While in control condition KCC2 staining is preferentially perisomatic, following SE the staining is diffuse within the NeuN-poistive cell bodies. Note that the KCC2 staining is very low at
d5pSE. DG: dentate gyrus; CA: Cornu Ammonis; a.u.: arbitrary unit.(E) Average curve profile of KCC2 staining in DG, CA3, and CA1 regions at day 1, 5, and 14 post-SE (n=3-4 per group). The curves represent
the plot profile of KCC2 staining along 10µm from the nucleus to the external neuropil of the neurons analyzed. Notice that in control condition but not following SE, peak of KCC2 immunofluorescence occurs at
the putative membrane location (arrowhead). Data are means ± SEM; p value obtained using t test analysis; * p<0.05; ** p<0.01, *** p<0.001. Scale bars are 10µm for insets and 100µm for full pictures.
1057x881mm (72 x 72 DPI)
Page 22 of 28 Annals of Neurology
Figure 2. In vivo bumetanide functionally reduces ectopic MFs sprouting at d5pSE. (A) Left, Immunolabelling of synaptoporin (SPO) of mossy fibers. Ectopic rMF sprouting is observed in the molecular layer of both ventral and dorsal DG in pilocarpine-treated rats and is absent in control rats (arrowheads). Insets show higher magnification of the region depicted by the white squares. DG: dentate gyrus. Right, corresponding
quantification of the fluorescence intensity normalized to control condition. Data are mean ± SEM (n=3 control rats and n=6 pilocarpine-treated for d5pSE); *** p<0.001, p value are obtained using t test analysis. Scale bar represents 150µm. (B) Experimental paradigm design. Bumetanide or vehicle solutions
are infused intracerebrally from d2 to d5pSE using osmotic minipumps and experiments are performed at d5pSE. SE: status epilepticus. (C) SPO staining revealed an ectopic rMF band in the molecular layer of the DG in vehicle-treated rats that was strongly reduced in bumetanide-treated rats and absent under control condition (arrowheads). Insets show higher magnification of the region depicted by the white squares. DG:
dentate gyrus. Corresponding quantification of the fluorescence intensity of synaptoporin in vehicle- and bumetanide-treated d5pSE rats normalized to control condition. (n=3 for control rats; n=5-6 vehicle- and bumetanide-treated rats). Scale bar represents 150µm; *** p<0.001, using Tukey multiple-comparison test
two-way ANOVA analysis. (D) Top, scheme of hippocampal slice with the CA3c-DG antidromic stimulation protocol. Traces are average of 100 sweeps in both conditions. The arrow shows an antidromic population spike followed by a burst (arrowhead). Estim: stimulation electrode in CA3c region; Erec: recording electrode
in DG cell layer. Down, corresponding bar graph represents the mean coastline burst index observed in slices from vehicle and bumetanide-treated d5pSE rats. (n=3-4 rats for vehicle- or bumetanide-treated
rats).
1057x881mm (72 x 72 DPI)
Figure 3. In vivo bumetanide application rescues NKCC1 expression and KCC2 function at d5pSE. (A) Experimental paradigm design. Bumetanide or vehicle solutions are infused intracerebrally from d2 to d5pSE
using osmotic minipumps and experiments are performed at d5pSE. (B) Representative immunoblot for NKCC1 protein extracts from in toto hippocampus under control condition, after vehicle or bumetanide infusion at d5pSE. Corresponding quantification normalized to ctrl and expressed relative to α-tubulin levels
(n=4-6 per group) (C) Representative immunoblot for KCC2 protein extracts from in toto hippocampus under control condition, after vehicle or bumetanide infusion at d5pSE. Corresponding quantification are shown in the bar graph. The data are normalized to ctrl and expressed relative to β3-tubulin levels. (n=4-6
per group). (D) Left, KCC2 staining (red) in DG (top), CA3 (middle) and CA1 (bottom) regions in control, vehicle-treated d5pSE, and bumetanide-treated d5pSE rats (n=3 for control, n=5-6 for vehicle- or bumetanide-treated). Scale bar represents 100µm. Right, Average curve profile of KCC2 staining in DG,
CA3, and CA1 regions at different days post-SE in vehicle- and bumetanide-treated rats. The curves represent the plot profile of KCC2 staining along 10µm from the nucleus to the external neuropil of the neurons analysed in control (black), vehicle-treated (blue) and bumetanide-treated (red) conditions. Notice that KCC2 intensity and pattern expression recovered to control conditions following bumetanide application
as shown by the images and plot profile. (E) Left, the scheme represents the whole-cell patch-clamp recordings of uncaging GABAA-mediated currents (IGABA) and ∆EGABA between soma and dendrite of a
pyramidal neuron from CA1 region with an artificially imposed somatic Cl- load. IGABA: GABAA-mediated
currents; EGABA: GABA reversal potential; UV: 405nm light stimuli for GABA uncaging (50ms); Vm: resting
membrane potential. Representative currents of the soma and dendrites are shown following UV-induced GABA uncaging. Middle, the I/V curve obtained in neurons from vehicle- (blue curves) or bumetanide-treated (red curves) animals at d5pSE. The arrow shows that the soma-to-dendrite gradient is greater
following in vivo bumetanide application. Insets show the current following UV light (line) in dendrties (upper panel) and soma (lower panel). Right, bar graph represents the quantification of the imposed soma-to-dendrite ∆EGABA under vehicle- and bumetanide-treated condition at d5pSE. (n=3-4 per group). Data are
means ± SEM; *p<0.05, *** p<0.001, p value obtained using two-way ANOVA in (B, C, D) and Mann-Whitney U test in (E).
Page 24 of 28 Annals of Neurology
Figure 4. In vivo infusion of high dose bumetanide alters KCC2 expression at d5pSE. (A) KCC2 staining in DG (top), CA3 (middle) and CA1 (bottom) regions in pilocarpine vehicle-treated, 20µM bumetanide-treated
and 100µM bumetanide-treated rats. Note that following high dose of bumetanide application, KCC2 intensity is very low as compared to low dose of bumetanide. DG: dentate gyrus; CA: Cornu Ammonis; a.u.:
arbitrary unit. Scale bar is 10µm. (B) Corresponding bar graph of global KCC2 fluorescence intensity, in the DG, CA3 and CA1 regions. (n=3-4 per group). Data are means ± SEM; ** p<0.01, and *** p<0.001, using
Tukey multiple-comparison test two-way ANOVA analysis. 1057x881mm (72 x 72 DPI)
Page 26 of 28 Annals of Neurology