HAL Id: hal-03002077
https://hal.archives-ouvertes.fr/hal-03002077
Submitted on 19 Nov 2020HAL is a multi-disciplinary open access archive for the deposit and dissemination of sci-entific research documents, whether they are pub-lished or not. The documents may come from teaching and research institutions in France or abroad, or from public or private research centers.
L’archive ouverte pluridisciplinaire HAL, est destinée au dépôt et à la diffusion de documents scientifiques de niveau recherche, publiés ou non, émanant des établissements d’enseignement et de recherche français ou étrangers, des laboratoires publics ou privés.
Natalia V. Solomatova, Razvan Caracas, Ronald Cohen
To cite this version:
Natalia V. Solomatova, Razvan Caracas, Ronald Cohen. Carbon speciation and solubility in silicate melts. Carbon in Earth’s Interior, 2020, �10.1002/9781119508229.ch16�. �hal-03002077�
179
Carbon in Earth’s Interior, Geophysical Monograph 249, First Edition. Edited by Craig E. Manning, Jung-Fu Lin, and Wendy L. Mao.
© 2020 American Geophysical Union. Published 2020 by John Wiley & Sons, Inc.
Carbon Speciation and Solubility in Silicate Melts
Natalia Solomatova1, Razvan Caracas1,2, and Ronald Cohen3,4ABSTRACT
To improve our understanding of the Earth’s global carbon cycle, it is critical to characterize the distribution and storage mechanisms of carbon in silicate melts. Presently, the carbon budget of the deep Earth is not well constrained and is highly model‐dependent. In silicate melts of the uppermost mantle, carbon exists predomi nantly as molecular carbon dioxide and carbonate, whereas at greater depths, carbon forms complex polymer ized species. The concentration and speciation of carbon in silicate melts is intimately linked to the melt’s composition and affects its physical and dynamic properties. Here we review the results of experiments and calculations on the solubility and speciation of carbon in silicate melts as a function of pressure, temperature, composition, polymerization, water concentration, and oxygen fugacity.
16
16.1. INTRODUCTION
Evidence of carbon‐bearing phases in the Earth’s mantle includes the release of CO2 in volcanic eruptions, dissolved CO2 in magmatic glasses and glass inclusions (Mörner & Etiope, 2002), diamonds and carbonate minerals in mantle xenoliths (Eggler, 1987; Sobolev & Shatsky, 1990), and the existence of carbonatite and kimberlite magmas (Wyllie et al., 1990). There are two possible sources of carbon:
primordial carbon and the carbon delivered by later come tary and asteroid bombardment. Primordial carbon existed in the proto‐Earth and subsequently survived the moon‐ forming impact, and its amount is currently unknown. From all existent carbon, part of it might be locked in the core, part in some deep mantle reservoir, another fraction lies at the surface, and the remaining is resurfaced after surviving subduction. To determine how much carbon may have remained in the Earth after the giant impact, the chemistry and thermodynamics of carbon in silicate (particularly, with the bulk silicate Earth composition) must be determined as a function of pressure and temper ature. Estimates of the amount of carbon exchanged between the surface and the mantle range between 30 and 130 megatons per year, and estimates of the carbon concentration stored within the core range between 0.2 and 4 wt.% (McDonough, 2003; Mookherjee et al., 2011; Wood, 1993). Carbon is mainly subducted into the Earth in the form of carbonates within metasomatically calcium‐ enriched basaltic rock, calcified serpentinites, and sedi mentary carbonaceous ooze of the seafloor (Brenker et al.,
1 CNRS, Ecole Normale Supérieure de Lyon, Université
de Lyon, Laboratoire de Géologie de Lyon, Lyon, France
2 CEED, The Center for Earth Evolution and Dynamics,
University of Oslo, Oslo, Norway
3Extreme Materials Initiative, Carnegie Institution for
Science, Washington, DC, USA
4 Department für Geo‐ und Umweltwissenschaften, Ludwig
2006). Some carbonates may survive subduction by under going transitions to denser carbonate phases (Brenker et al., 2006; Isshiki et al., 2004; Mao et al., 2011; Merlini et al., 2012; Oganov et al., 2008; Ono et al., 2005; Solomatova & Asimow, 2017). If a fraction of carbon is subducted into the lower mantle, all possible carbon sinks need to be determined. Due to carbon’s low solubility in crystalline silicates (Keppler et al., 2003; Panero & Kabbes, 2008; Shcheka et al., 2006), carbon strongly partitions into silicate melts relative to silicate minerals. This chapter briefly summarizes the experiments and calculations that have been performed on carbon‐bearing silicate melts and glasses, particularly the speciation and solubility of carbon as a function of pressure, with a primary goal to expose areas that remain controversial or unknown that would especially benefit from ab initio molecular dynamics simu lations. There have been at least three excellent review papers on carbon in silicate melts (see Holloway & Blank, 1994; Ni & Keppler, 2013; Webster et al., 2011), as well as several papers that have done an excellent job summa rizing, tabulating, and plotting together data from previous studies (e.g. Duan, 2014; Shishkina et al., 2014). Here, we provide a perspective from computational mineral physics on what is critical to investigate in the near future. Furthermore, we contribute our calculations on carbon ated forsterite melts to improve our understanding of dia mond formation from silicate melts.
16.2. EXPERIMENTS ON SILICATE MELTS
Experimentally, standard difficulties hinder the in situ analysis of silicate melts: absence of periodicity, which prevents refining structure and density from X‐ray diffraction, and high background optical radiation, which hinders spectroscopic measurements. Glasses from quenched melts are amenable to study, but the structure may change and carbon may diffuse during quench. Nevertheless, the carbon content of quenched samples that were equilibrated with other phases (solids, liquids or gases) can be determined using a bulk analyzer, secondary‐ion mass spectrometry, nuclear magnetic reso nance experiments, and most commonly, Fourier‐trans form infra‐red (FTIR) spectroscopy. FTIR is able to determine both CO2 and H2O concentrations with a high level of accuracy if the molar absorptivity is well cali brated against absolute techniques, such as a bulk carbon analyzer. The solubility and speciation of carbon depends on the composition, oxygen fugacity, H2O and CO2 con centrations, temperature, pressure, and NBO/T (the ratio between the number of Non‐Bridging Oxygen atoms and Tetrahedrally‐ coordinated cations; this ratio is defined in slightly different ways by different authors, depending on which cations are considered tetrahedrally coordinated).
Experiments have generally been conducted in large‐ volume presses in the pressure range of 1–4 GPa and temperature range of 1000 °C–2000 °C. Typically, the procedure is to saturate a melt at high pressure and temper ature with CO2 until equilibrium is reached and then rap idly quench the melt to produce a glass that ideally retains the structure of the melt. The examination of carbon spe ciation has mostly been limited on quantifying the CO2‐to‐ CO32‐ ratio as a function of composition. Unfortunately,
with a few exceptions (e.g. Sen et al., 2013), experimental studies have not pursued the formation of more complex species, such as carbon‐carbon polymers, organic mole cules, or even silicon‐carbon and iron‐carbon polymers.
16.2.1. Speciation of Carbon
Experiments have demonstrated that at 1–4 GPa and 1000 °C–2000 °C, the CO2/(CO2+CO32‐) ratio is most
strongly dependent on the composition of the melt. It has been shown that carbon exists almost exclusively as CO32‐
(rather than CO2) in mafic melts, such as basalt (Fine & Stolper, 1986; Fogel & Rutherford, 1990; Shishkina et al., 2014; Thibault & Holloway, 1994), olivine melitite (Brey, 1976; Brey & Green, 1976), phono‐tephrite (Behrens, 2009), nephelinite (Brooker et al., 1999; Shishkina et al., 2014), and icelandite (Jakobsson, 1997). In the sequence of basalt, andesite, rhyodacite, and rhyolite melts, Fogel and Rutherford (1990) showed a general increase in the CO2/CO32‐ ratio, such that carbon exists exclusively as
CO2 in rhyolite and as CO32‐ in basalt, while in albite‐
anorthite melts, Brey (1976) found that the CO2/CO32‐
ratio increases with increasing albite content. King and Holloway (2002) found that highly polymerized melts with high ionic porosities (>48.3%) and low nonbridging oxygen/tetrahedral oxygen (<0.3) have a higher concentration of molecular CO2. In melts along the NaAlO2‐SiO2 join (from NaAlSi6O14 rhyolite rock compo sition to pure NaAlSiO4 nepheline), Brooker et al. (1999) found that the relative and absolute abundance of CO32‐
increases with increasing NaAlO2/SiO2 at the expense of CO2, such that carbon in NaAlSiO4 exists almost exclu sively as CO32‐, whereas carbon in NaAlSi
6O14 exists
almost exclusively as CO2. The total solubility of carbon decreases as NaAlO2 is added to SiO2, up to a NaAlO2/ SiO2 ratio of about 0.5, after which the trend reverses and there is a sharp increase in the solubility of carbon. The CO2/CO32‐ ratio decreases with increasing pressure
at constant temperature (in other words, carbon increases coordination with pressure). The effect of temperature is subtler: at constant pressure, the CO32‐ concentra
tion decreases with increasing temperature between 1450 °C and 1600 °C and increases with increasing tem perature from 1600 °C to 1700 °C, in agreement with
the results of Fine and Stolper (1985). Konschak and Keppler (2014) examined the speciation of carbon in dacite, phonolite, basaltic andesite, and alkali silicate melts using synchrotron infrared spectroscopy and dia mond anvil cells up to 1000 °C and 200 kbar, finding a correlation between NBO/T and speciation. In alkali sili cate and basaltic andesite, carbon exists exclusively as carbonate, while in dacite and phonolite, carbon exists as a mixture of CO2 and CO32‐. With increasing tempera
ture, the effect of composition on carbon’s speciation decreases as carbon shifts from existing as CO32‐ to CO
2.
They find that the speciation of carbon is largely insensi tive to pressure up to 200 kbar, and that composition and temperature have a much stronger effect.
The speciation of carbon in highly reduced melts is poorly understood. Whereas Morizet et al. (2010) sug gested that applying reducing conditions would not affect carbon speciation in hydrous melts, Kadik (2004) observed that carbon is dissolved primarily as atomic carbon in reduced ferrobasalt. Kadik observed direct Si‐C bonds in ferrobasaltic glass using Raman spectros copy, and Sen et al. (2013) observed that carbon exclu sively bonds to silicon rather than oxygen in a reduced SiLiOC melt using nuclear magnetic resonance experi ments, giving rise to their contrary conclusions. Although it is typically expected that in shallow melts carbon will bond to oxygen to form CO2 or CO32‐, it is possible that in
more reduced melts and especially at higher pressures, carbon will bond directly to silicon instead of oxygen. See the computational section for theoretical evidence of Si‐C bonds in pyrolitic melt. Additional experiments and specific measurements are needed to constrain the speci ation of carbon in reduced silicate melts. In summary, at lithospheric conditions, i.e. within the pressure range of 0.5–4 GPa and at temperatures below 2000 °C, the CO2/ (CO2+CO32‐) ratio is most strongly affected by the com
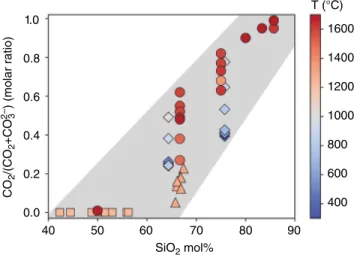
position, and in particular, the silica content of the melt (Figure 16.1). Carbon exists almost exclusively as CO2 in silica‐rich felsic melts (e.g., rhyolite) and as CO32‐ in silica‐
poor mafic melts (e.g., basalt, olivine melitite and nephe line melts). The CO2/(CO2+CO32‐) ratio is also negatively
correlated with pressure and generally insensitive to tem perature; there remain disagreement and insufficient data on the effect of the H2O content on the speciation of carbon. Additional studies are needed to refine the effect of temperature, H2O content, and NBO/T, as well as the effect of network‐modifying cations within the melt.
16.2.2. Solubility of Carbon
The solubility of carbon within a silicate melt depends most strongly on pressure and composition. The effects of temperature, water content, and oxidation state are
less well defined at the present time, due to discrepancies in the literature. Solubility can be difficult to measure accurately due to several factors. Hydrogen and carbon may diffuse into the silicate melt, or small amounts of melt components may dissolve into the fluid phase, affecting the measured carbon solubility. The oxidation state may change due to the capsule material, resulting in changes in carbon speciation, and thus, solubility. Furthermore, the use of different molar absorptivity standards for the CO2 and CO32‐ for the FTIR bands may
be a source of inconsistencies in reported solubilities. Here we summarize the current data on carbon solubility in a variety of silicate melt compositions, highlighting the need for additional high‐quality experiments to resolve discrepancies and gaps in the literature. We use the term carbon solubility to encompass the cumulative solubility of CO2 and CO32‐, making the distinction when necessary.
There is good agreement within the experimental litera ture that carbon solubility in silicate melts increases rap idly with increasing pressure (Behrens et al., 2004; Blank,
1.0 CO 2 /(CO 2 +CO 2 3 –) (molar ratio) 1600 T (°C) 1400 1200 1000 800 600 400 0.8 0.6 0.4 0.2 0.0 40 50 60 SiO2 mol% 70 80 90
Figure 16.1 Molar ratio, CO2/(CO2+CO32‐) as a function of silica
content at 300 °C–1700 °C for melts and glasses along the NaAlO2‐SiO2 join from Brooker et al. (1999) (circles), andesite
melts from King and Holloway (2002) (triangles), phonolite and dacite melts from Konschak and Keppler (2014) (diamonds), and mafic melts from Shishkina et al. (2014) (squares). The data from Brooker et al. (1999) and King and Holloway (2002) were obtained at 1–2 GPa and 1 GPa, respectively. Shishkina et al. (2014) did not observe any molecular CO2 species for the range of
mafic melts investigated at 1200 °C–1250 °C up to 0.5 GPa. Konschak and Keppler (2014) reported that the carbon speciation is independent of pressure in the pressure range of 3–20 GPa at temperatures of up to 1000 °C; however, Brooker et al. (1999) observed a negative correlation of CO2/(CO2+CO32‐) and pressure.
In either case, the effect of pressure and temperature is secondary to the effect of silica content on carbon’s speciation. See electronic version for color representation of the figures in this book.
1993; Botcharnikov et al., 2005; Botcharnikov et al., 2007; Brooker et al., 1999; Fogel & Rutherford, 1990; Jendrzejewski et al., 1997; Shishkina et al., 2014). For example, in rhyolitic melts at 1123–1323 K, CO2 solubility increases from roughly 120 ppm at 20 MPa to 800–1000 ppm at 140 MPa to 3700 ppm at 660 MPa (Blank, 1993; Fogel & Rutherford, 1990). In dacitic melts, the maximum CO2 solubility increases from 800 ppm at 100 MPa to 3000 ppm at 500 MPa (Behrens et al., 2004), and in andes itic melts, the CO2 solubility increases from 175 ppm at 50 MPa to 3300 ppm at 500 MPa (Botcharnikov et al., 2005). Similarly, in shoshonitic melts, Vetere et al. (2011) found that the concentration of CO2 (in the form of carbonate) increased from 307 ppm at 50 MPa to 2932 ppm at 400 MPa. Thus, there is a consensus that more carbon species can dissolve in silicate melts with increasing pressure, and thus with increasing depth. There is also a strong dependence of the carbon solubility on the composition of the silicate melts, most notably affected by the degree of polymerization (Brooker et al., 2001a; Brooker et al., 2001b; Mysen et al., 2009; Shishkina et al., 2014) and concentration of CaO (Brey, 1976; Holloway, 1976; Iacono‐Marziano et al., 2012; King & Holloway, 2002; Moore, 2008; Papale et al., 2006; Shishkina et al., 2014). Holloway (1976) observed that carbon solubility is posi tively correlated with the Ca/(Ca+Mg) ratio. Brey (1976) found that the solubility of carbon in olivine melitite (8.3– 9.5 wt.% CO2) is much higher than in albite‐anorthite (1.6–2.5 wt.% CO2), for which the solubility increases slightly with increasing anorthite content. Brooker et al. (2001a, 2001b) observed a negative correlation with MgO content and a positive correlation with NBO/T. King and Holloway (2002) found that carbon solubility is negatively correlated with the Si+Al mole fraction and positively correlated with cations that have a large Gibbs free energy of decarbonation or a high charge‐to‐radius ratio (e.g. Ca). Alkalis have also been found to have a positive corre lation with the solubility of CO2 (Behrens et al., 2009; Lesne et al., 2011; Vetere et al., 2014), although the rela tionship is more complex. Shishkina et al. (2014) found that at 500 MPa and the H2O content extrapolated to 0 wt.%, the CO2 concentration increases from tholeiite (~3400 ppm) to alkali basalt (~5200 ppm), to basanite (~7400 ppm), to phonotephrite (~8500 ppm), to nephe linite (~14000 ppm). To describe the complex relationship between composition and carbon solubility, Shishkina et al. formulated a modified Π parameter (originally pro posed by Dixon, 1997, for a limited range of silica con tents) using eight compositions of silicate melt combined with previous data sets. The Π parameter in Shishkina et al. is defined as the ratio between the freely diffusing cations and the tetrahedral network, (Ca2+ + 0.8K+ +
0.7Na+ + 0.4Mg2+ + 0.4Fe2+)/(Si4+ + Al3+), as reflecting the
degree of polymerization of the melt. The relationship
between the natural log of the solubility of CO2 and Π was found to be 1.167*lnP + 0.671* Π + 0.65 (where P is pressure), obtained from the linear regression of 48 values of CO2 solubilities at 50–500 MPa. The newly formulated Π parameter in Shishkina et al. is the most rigorous parameterization of the compositional effect on carbon solubility at the present time.
Although most studies demonstrate a negative correla tion between total carbon solubility and H2O content (Behrens et al., 2004; Blank et al., 1993; Botcharnikov et al., 2005; Botcharnikov et al., 2006; Fogel & Rutherford, 1990; Mattey, 1991; Moussallam et al., 2016; Pan et al., 1991; Pawley et al., 1992; Shishkina et al., 2010; Stolper & Holloway, 1988; Tamic et al., 2001), several studies observed a positive correlation (Behrens et al., 2004; Behrens et al., 2009; Iacono‐Marziano et al., 2012; King & Holloway, 2002; Jakobssen, 1997). Below about 2 × 10⁴
ppm H2O, there is generally a weak correlation between the H2O and CO2 concentrations, while at higher H2O concentration the CO2 solubilities tend to drop (Ni & Keppler, 2013). For example, at 2 kbar and 1250–1300 °C, the CO2 solubility in basaltic and rhyolitic melts plateaus around 1000 ppm CO2 up to around 2 × 10⁴ ppm H
2O,
gradually dropping to 0 ppm CO2 by 5 × 104 ppm H 2O in
basaltic melt (Botcharnikov et al., 2005; Shishkina et al., 2010) and by 5.6 × 104 ppm H
2O in rhyolitic melt (Tamic
et al., 2001). On the other hand, King and Holloway (2002) observed a total CO2 solubility increase by about 0.06 wt.% per wt.% of H2O in andesite glass at 10 kbar and 1300 C: as the H2O concentration increased from 0 to 3.4 wt.%, molecular CO2 decreased from 0.07 to 0.01 wt.% and CO32‐ increased from 0.25 to 0.57 wt.%. Iacono‐
Marziano et al. (2012) hypothesized that a positive corre lation between CO2 and H2O concentrations may be due to NBO formation, which promotes CO32‐ formation,
thus increasing the total carbon solubility. The solubility data of icelandite from Jakobssen (1997) shows no trend with H2O when plotted against dissolved CO2 (Ni & Keppler, 2013), whereas there is a positive trend when plotted against dissolved CO2 normalized to the CO2 partial pressure. Nevertheless, the majority of studies see a negative correlation and it is not clear at the present time what is responsible for the discrepancy in these studies.
The effect of temperature on the solubility of carbon is also poorly constrained. Generally, carbon solubility seems to be weakly dependent on temperature, such that the sign of the trend depends on the composition. For example, it has been shown that carbon solubility decreases weakly with increasing temperature for albitic melts (Blank & Brooker, 1994; Brooker et al., 1999; Stolper et al., 1987) and decreases strongly for rhyolitic melts at 0.1 GPa (Blank, 1993; Fogel & Rutherford, 1990; Ni & Keppler, 2013). Eitel and Weyl (1932) observed a
negative dependence in sodium metasilicate melts at 750 atm, and Pearce (1964) observed pronounced negative temperature dependence in Na2O‐SiO2 melts at 1 atm. However, Brooker et al. (1999) observed a slight increase in solubility with increasing temperature for NaAlSiO4 and no dependence for melts with compositions between NaAlSi4O10 and NaAlSi6O14. In more mafic composi tions, there is even less consensus. Brey and Green (1976) observed a slight negative relationship in olivine melilitite at 3 GPa with 9% CO2 dissolved at 1450 °C, 8.5% at 1550 °C, and 8.3% at 1650 °C, while Mysen et al. (1976) observed a strong positive correlation with temperature at 1400–1700C above 1 GPa. Pan et al. (1991) demon strated that carbon solubility is temperature‐independent in tholeiitic basalt melt at 1–1.5 GPa and 1300 °C– 1600 °C. It is possible that there are discrepancies in the effect of temperature due to different quenching methods and/or quality of the glass as an analog for certain com positions. In any case, additional studies are needed to constrain the effect of temperature on carbon solubility. At least at uppermost mantle pressures and temperatures, increasing oxygen fugacity increases the solubilities of carbon and hydrogen (Kadik, 2004; Morizet et al., 2010; Stanley et al., 2011). Morizet et al. (2010) found a strong positive correlation between carbon solubility and oxidation state in haploblastic glasses at 1250 °C and 200–300 MPa, finding that the CO2 content changes from 680 to 1320 ppm between ΔFMQ – 2.6 and ΔFMQ + 2.6 independently of H2O content changing from 1.3 to 4.0 wt.%. Stanley et al. (2011) found that the CO2 content increases from 51 ppm at IW to 510 ppm at IW + 1 in a synthetic melt based on the Adirondack‐class Humphrey basalt, at 1–2.5 GPa and 1400 °C–1625 °C. At greater depths, however, the relationship between oxygen fugacity and carbon solubility is unknown. It has been hypothe sized that carbon may behave like oxygen in reduced high‐pressure melts (Sen et al., 2013) and possibly result in an increase in solubility.
16.3. SIMULATIONS OF SILICATE MELTS
It remains a great challenge to experimentally measure the structural properties of melts at simultaneously high pressures and temperatures. The majority of experiments require quenching of the melt prior to analysis, which may change the local structure and coordination environ ment of the atoms, as well as the volatile concentration (Behrens & Nowak, 2003; Brey, 1976; Guillot & Sator, 2011). Additionally, experiments on carbon solubility and speciation in silicate melts have mostly been limited to pressures of up to 4 GPa and temperatures of up to 2000 °C, while calculations can determine the precise behavior of atoms and directly calculate thermodynamic properties at a wide range of pressures and temperatures.
On the other hand, the atomistic simulations have strong size limitations, as they typically contain a few hundred atoms in a periodically repeated simulation box. This may be somehow mitigated by long simulation times and large number of configurations, in a push to cover as much as possible from the configurational space.
Molecular dynamics calculations can be performed with classical or ab initio methods. In classical molecular dynamics, the forces between atoms are calculated from empirical interatomic potentials, whereas in ab initio molecular dynamics, forces are determined from electronic structure calculations (e.g. with density functional theory). In both cases, the motions of the atoms are calculated with Newton’s second law and are treated classically. Due to computational expense, ab in itio molecular dynamics are limited by the number of atoms and duration of the simulation; the latter can be orders of magnitude higher than for classical molecular dynamics. The level of accuracy of classical molecular dynamics depends on the quality of the parametrization of the interatomic potentials, which depends on the accu racy of the reference data. Furthermore, extrapolation to pressure‐temperature conditions beyond the conditions of the reference data decreases the accuracy of the poten tials. Although ab initio molecular dynamics depends on several approximations (e.g., the exchange‐correlation energy and the treatment of core electrons), it is based on first principles in the sense that it does not require param eterization with experimental data. For the case of high‐ pressure, high‐temperature silicate melts, the reference data is scarce or nonexistent, especially within the large range of pressure and temperature conditions of planetary interiors, and so ab initio methods are presum ably more reliable. For example, Vuilleumier et al. (2015) found that their classical simulations were not sufficiently viscous, as the atomic diffusion coefficients were larger than experimental values. They also found disagreement in the CO2 concentration as a function of composition when comparing their results from classical simulations to ab initio simulations, concluding that the empirical force fields need to be improved. Furthermore, the ratio of CO2 to CO3 is severely overestimated with classical molecular dynamics in the calculations of Guillot and Sator (2011) (see section 3.2). Thus, even though empirical methods allow for a larger number of atoms and longer simulation duration, experimental results on carbon spe ciation are far better reproduced with ab initio methods. The effect of cell size (i.e., number of atoms) on carbon speciation in ab initio molecular dynamics simulations is not currently well understood.
Thus far, there have been five studies on carbonated sil icate melts using molecular dynamics simulations. The two first studies were conducted at pressure and tempera ture conditions of the upper mantle: Guillot and Sator
(2011) implemented classical molecular dynamics to quantify the solubility of carbon in rhyolite, MORB, and kimberlite melts at 2–15 GPa and 1473–2273 K; and Vuilleumier et al. (2015) used a combination of classical and ab initio molecular dynamics to study the speciation of carbon in basaltic and kimberlitic melts with ~20 wt.% CO2 at 2073 K and 12 GPa. Subsequently, simulations at lower mantle pressures and temperatures were conducted. Ghosh et al. (2017) used ab initio molecular dynamics to examine the speciation of carbon in MgSiO3 melt with 5–16 wt.% CO2 at 2200–6000 K and 140 GPa, while Ghosh and Karki (2017) examined the transport prop erties of MgSiO3 melt with 16.1 wt.% CO2 at 2200–5000 K up to 140 GPa. Most recently, Solomatova et al. (2019) used ab initio molecular dynamics to examine the specia tion and polymerization of carbon in pyrolite melt with 5–10 wt.% CO2 at 3000–5000 K up to 140 GPa. The com positions and carbon concentrations of the ab initio molecular dynamics simulations are summarized in Table 16.1.
In this chapter, we add our simulations on pure and carbonated Mg2SiO4 forsterite melt at 3000 K and up to 120 GPa. We have worked on several distinct composi tions: Mg2SiO4, Mg2SiO4+C, Mg2SiO4+CO2, and Mg2SiO4+MgCO3, and study the effect of carbonation on the melt properties as well as the differences between the various carbon species. We have employed the Qbox package (Gygi, 2018). We start the calculations with solid Mg2SiO4 forsterite. Forsterite, the Mg‐end member term of the mineral olivine, has an orthorhombic structure with 4 formula units per unit cell, namely 28 atoms. We consider a 2x1x2 supercell containing 112 atoms. After static structural relaxation, we perform a molecular‐ dynamics calculation on the solid, raising the tempera ture well above the melting point. Once we reach melting,
we decrease the temperature and thermalize the melt at the desired value closer to realistic telluric conditions. Here, we performed a high‐pressure study along the 3000 K isotherm. All simulations are NVT type, meaning the Number of particles, the Volume of the simulation box, and the Temperature are kept constant. This is numeri cally simpler than the NPT ensemble, where pressure instead of volume is fixed. Temperature is controlled via a Nose‐Hoover thermostat, and the time step of the sim ulations is 0.75 fs. Temperature is monitored throughout the simulations to maintain fluctuations within a couple hundred degrees above and below the average 3000 K. We compute the electronic density and wave functions sam pling the Brillouin zone in the reciprocal space using only the Γ point. We add carbon in the silicate melt as C atoms, CO2 molecules, or MgCO3 groups. The addition of the supplementary atoms is done in the interstitial pores of the melt at low pressure. CO2 is added as a linear mole cule, and MgCO3 as a Mg cation about 2 Å apart on top of a CO3 triangular anionic group. The new melts are first thermalized for one full picosecond in order to dissipate the interatomic forces and equilibrate the strains and then compressed along the 3000 K isotherm up to lower‐ mantle pressures.
16.3.1. Solubility of Carbon Dioxide in the Silicate Melt
Guillot and Sator (2011) observed a strong positive correlation of carbon solubility with pressure. For example, at 1673 K, carbon solubility in a basaltic melt increased from 2 wt.% CO2 at 2 GPa to 30 wt.% CO2 at 10 GPa. A weak negative correlation with temperature was observed and the effect of temperature increases with increasing pressure, such that at 2 GPa, there is almost no
Table 16.1 Carbon concentrations in the simulated melts using ab initio molecular dynamics, expressed as the formula units
of carbon species added, wt.% of carbon species added, wt.% of C and mol% of C. The chosen carbon concentrations of 1.4–4.7 wt.% C reflect the range of carbon present in carbonaceous chondrites (0–6 wt.% C) (Pearson et al., 2006), which are regarded as the building blocks of our planet.
Composition,
Supercell Formula Reference
Carbon Species Added
wt.% of Carbon
Species Added wt.% C mol% C
Enstatite,
32MgSiO3 Ghosh et al. (2017) 4 CO4 CO2 3.37 wt.% CO5.20 wt.% CO2 1.451.42 2.382.33
14 CO 10.88 wt.% CO 4.66 7.45
14 CO2 16.09 wt.% CO2 4.39 6.93
Pyrolite,
NaCa2Fe4Mg30Al3Si24O89 Solomatova et al. (2019) 4 CO4 CO2 3.35 wt.% CO5.16 wt.% CO2 1.441.41 2.482.42
8 CO 6.48 wt.% CO 2.78 4.97
8 CO2 9.82 wt.% CO2 2.68 4.52
Forsterite,
16Mg2SiO4 This study 8 C4 CO2 4.09 wt.% C7.25 wt.% CO2 4.091.98 6.673.23
8 CO2 13.52 wt.% CO2 3.69 5.88
difference in solubility with temperature, whereas at 5 GPa, the solubility of CO2 decreases from 10 wt.% at 1673 K to 7 wt.% at 2273 K. At low pressure, they demon strate excellent agreement with experiments (Hammouda, 2003; Mattey, 1991; Pan et al., 1991; Thomsen & Schmidt, 2008). For example, both Guillot and Sator (2011) and Mattey (1991) predict CO2 solubility in basaltic melt of 1.5 wt.% at 2 GPa and 1673 K. At 3.5 GPa and 1573 K, Thomsen and Schmidt (2008) report a CO2 solubility of 5 wt.% CO2 in a complex carbonatite melt, similar to the value of 6 wt.% CO2 at 3.5 GPa and 1673 K predicted by Guillot and Sator (2011). The solubility is also weakly correlated with silica content, only becoming noticeable above about 10 GPa. The solubility of CO2 at 10 GPa and 2273 K is about 25 wt.% in basalt and 24 wt.% in rhyolite, while at 15 GPa and 2273 K, the solubility of CO2 is about 37 wt.% in basalt and 34 wt.% in rhyolite. Although Guillot and Sator (2011) predict excellent agreement of solubility with experiments, the form in which carbon exists (CO2 vs. CO32‐) is significantly different than experi
mental observations (see below).
16.3.2. Carbon Coordinated by Oxygen
Guillot and Sator (2011) found that the proportion of CO32‐ increases with increasing pressure and decreases
with increasing temperature relative to CO2. Although experiments on quenched mafic melts have shown that carbon exists exclusively as CO32‐ (e.g. Fogel & Rutherford,
1990; Shishkina et al., 2014; Thibault & Holloway, 1994),
Guillot and Sator predicted a significant CO2 content (CO2/[CO2+CO32‐]~0.6 at 1873 K), noting that a low‐
temperature extrapolation to 300 K would agree with the experimental results, implying that the speciation (and thus, solubility) of carbon in the recovered silicate glasses (i.e. quenched silicate melt) is not an accurate representa tion of the high‐temperature silicate melt. The implica tion is that the experimental results on carbon‐bearing silicate glasses are unreliable. However, when the CO2/ (CO2+CO32‐) ratio is plotted for the computational studies
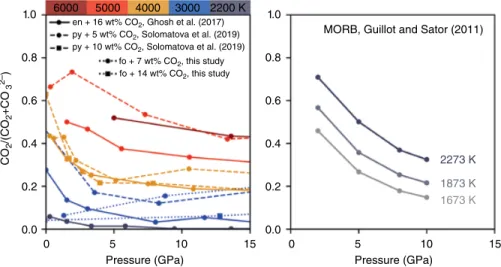
on carbon‐bearing MgSiO3 (Ghosh et al., 2017) and carbon‐bearing pyrolite (Solomatova et al., 2019), the concentrations of CO2 are substantially lower than in Guillot and Sator (2011) at comparable temperatures (Figure 16.2). For example, at 2–3 GPa, Ghosh et al. (2017) observed 1%–4% CO2/(CO2+CO32‐) at 2200 K in
MgSiO3, but Guillot and Sator (2011) observed 70% CO2/ (CO2+CO32‐) at 2273 K in MORB. The discrepancy bet
ween the computational studies may be best explained by the difference in methodology. Guillot and Sator (2011) used classical molecular dynamics on a CO2 saturated composition (~25 wt.% CO2 at 10 GPa), but Ghosh et al. (2017) and Solomatova et al. (2019) used ab initio molec ular dynamics on melts with 5–16 wt.% CO2. Vuilleumier et al. (2015) used a combination of classical and ab initio molecular dynamics to study the speciation of carbon in basaltic and kimberlitic melts with ~20 wt.% CO2 at 2073 K and 12 GPa, finding that most of the carbon exists as CO32‐. With ab initio molecular dynamics, the CO
2/
(CO2+CO32‐) ratio is 0.15 for the basaltic melt and 0.03
1.0 6000 5000 4000
MORB, Guillot and Sator (2011)
2273 K 1873 K 1673 K 3000 2200 K 0.8 fo + 7 wt% CO2, this study fo + 14 wt% CO2, this study 0.6 0.4 0.2 0.0 0 5
Pressure (GPa) Pressure (GPa)
10 15 0 5 10 15 1.0 0.8 0.6 0.4 0.2 0.0 CO 2 /(CO 2 +CO 3 2–) en + 16 wt% CO2, Ghosh et al. (2017) py + 5 wt% CO2, Solomatova et al. (2019) py + 10 wt% CO2, Solomatova et al. (2019)
Figure 16.2 Molar ratio, CO2/(CO2+CO32‐), as a function of pressure and temperature. Guillot and Sator (2011)
predict significantly more CO2 relative to CO32‐ in MORB melt than Ghosh et al. (2017), Solomatova et al. (2019),
and this study in enstatite melt (en), pyrolite melt (py), and forsterite melt (fo), if an extrapolation to lower temper-atures is made. In fact, the high CO2/(CO2+CO32‐) ratios predicted by Guillot and Sator (2011) at 2273 K are only
achieved at 5000 K in Ghosh et al. (2017) and Solomatova et al. (2019). Experiments on basaltic melts at 1–4 GPa and 1000–2200 K observe no CO2 (Fine & Stolper, 1986; Fogel & Rutherford, 1990; Shishkina et al., 2014; Thibault & Holloway, 1994), in agreement with Ghosh et al. (2017) and in disagreement with Guillot and Sator (2011). See electronic version for color representation of the figures in this book.
for the kimberlitic melt, but with classical molecular dynamics, the ratio is approximately 0.2 for both melts, higher than what is predicted with classical molecular dynamics. At similar conditions (~10–15 GPa and 2200 K), Ghosh et al. (2017) observed essentially no CO2 in MgSiO3 melt, similar to the results of Vuilleumier et al. (2015) for kimberlitic melt with ab initio molecular dynamics.
In carbonated forsterite melts, the fate of carbon depends on its entry state in the system and, consequently, on the oxidation state of the melt. The general tendency is that the coordination of carbon by oxygen increases with increasing pressure. In forsterite melt with carbon species added as CO2 and MgCO3, carbon exists almost exclu sively in the form of CO32‐ and increases in coordination
to CO44‐ with increasing pressure such that carbon in the
melt is mostly CO44‐ at core‐mantle boundary pressures. In
forsterite with reduced carbon added, carbon exists as a mixture of C, CO, and CO2; with increasing pressure, carbon increases coordination to CO32‐. At lower‐mantle
pressures, carbon in the reduced forsterite melt exists as an approximately even mixture of CO, CO2, and CO32‐ with
no CO44‐. The relative proportions of CO
2, CO32‐, and
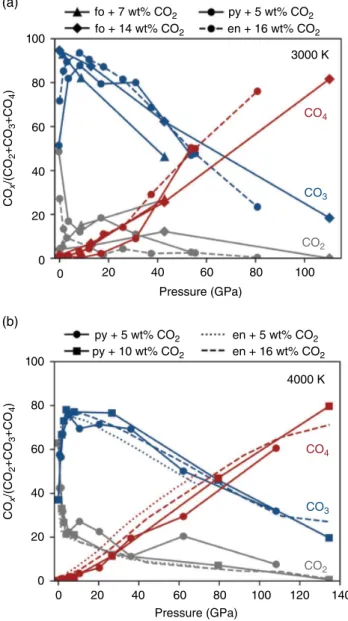
CO44‐ are similar at all mantle pressures regardless of the
melt chemistry (pyrolite, enstatite, or forsterite), as dem onstrated in Figure 16.3.
16.3.3. Carbon Complexes
Although at ambient pressure carbon exists in silicate melts exclusively in unpolymerized forms (e.g. CO, CO2, and CO32‐), with increasing pressure it becomes increas
ingly polymerized (i.e. a higher fraction of carbon atoms are bonded to other carbon atoms) and the carbon species increasingly complex (Ghosh et al., 2017; Solomatova et al., 2019). For example, in pyrolite with 3.35 wt.% CO, nearly none of the carbon is polymerized while at 0 GPa, whereas most of the polymerized carbon exists in C2O, C2O2, and C2O3 molecules at ~60 GPa and predominantly as C2O2‐6 and C3O4‐6 molecules at ~115 GPa and 4000 K (Solomatova et al., 2019). At 12 GPa and 2073 K, Vuilleumier et al. (2015) observed that about 3.7% of all carbon species in basalt + 20 wt.% CO2 are C2O5, which means that 7% of carbon atoms are bonded to another carbon atom, similar to pyrolite + 9.82 wt.% CO2, in which 5% of carbon is polymerized (Solomatova et al., 2019), and MgSiO3 + 16.1 wt.%, in which 7% of carbon is polymerized (Ghosh et al., 2017), at an equivalent pressure and 4000 K (Figure 16.3).
The polymerization of carbon is inversely dependent on temperature because of the increase in entropy with decreasing polymerization. At 3000 K and 20 GPa, pyrolite with 3.35 wt.% CO has 45% of its carbon poly merized, whereas at 5000 K only about 3% of its carbon
is polymerized (Figure 16.4; Solomatova et al., 2019). In addition to the carbon‐carbon polymerization, the degree of clustering between carbon atoms and other cations (predominantly, iron and silicon) also increases with increasing pressure (Figure 16.4). The predisposi tion of carbon to bond directly to iron suggests that carbon would follow iron during segregation of an iron‐ rich metallic liquid during core formation in the early Earth, both prior to and after the moon‐forming impact.
The oxidation state of the melt has a significant effect on the types of species present (Ghosh et al., 2017; Solomatova et al., 2019). For example, the abundance of
100 (a) (b) fo + 7 wt% CO2 py + 5 wt% CO2 py + 5 wt% CO2 py + 10 wt% CO2 en + 16 wt% CO2 en + 16 wt% CO2 en + 5 wt% CO2 fo + 14 wt% CO2 3000 K 4000 K CO4 CO4 CO3 CO3 CO2 CO2 80 60 CO x /(CO 2 +CO 3 +CO 4 ) CO x /(CO 2 +CO 3 +CO 4 ) 40 20 0 100 80 60 40 20 0 0 20 40 60 80 Pressure (GPa) 100 120 140 0 20 40 60 Pressure (GPa) 80 100
Figure 16.3 Molar ratio, COx/(CO2+CO32‐+CO44‐) at 3000 K (a)
and 4000 K (b) for enstatite (en; Ghosh et al., 2017), pyrolite (py; Solomatova et al., 2019) and forsterite (fo; this study) melts with carbon added into the melt as CO2. See electronic version for color representation of the figures in this book.
100 (a) (c) (b) (d) (e) (f) en + 5 wt% C py + 3 wt% CO py + 6 wt% CO en + 11 wt% CO fo + 4 wt% C en + 16 wt% CO2 py + 5 wt% CO2 py + 10 wt% CO2 fo + 7 wt% CO2 fo + 14 wt% CO2 fo + 13 wt% MgCO3 % of C bonded to C % of C bonded to C % of Fe bonded to C 75 50 25 0 100 3000 K 4000 K 5000 K 75 50 25 0 0 20 40 60 80 100 120 140 0 20
Pressure (GPa) Pressure (GPa)
100 75 50 25 0 0 20 40 60 80 100 120 140 Pressure (GPa) 100 75 50 25 0 0 20 40 60 80 100 120 140 Pressure (GPa) 40 60 80 100 120 100 % of Fe bonded to C 75 50 25 0 0 20 Pressure (GPa) 40 60 80 100 120 100 % of C bonded to Si % of C bonded to Si 75 50 25 0 0 20 Pressure (GPa) 40 60 80 100 120
Figure 16.4 Formation of carbon complexes as a function of pressure in simulations on enstatite melt (en; Ghosh
et al., 2017); pyrolite melt (py; Solomatova et al., 2019) and forsterite melt (fo; this study) at 3000 K (dotted lines), 4000 K (solid lines), and 5000 K (dashed lines). Left column (a, c, e) includes melts with more reduced carbon species (C and CO); right column (b, d, f) includes melts with more oxidized species (CO2 and MgCO3). Gray
regions mark pyrolite with 3 wt.% CO (left column) and pyrolite with 5 wt.% CO2 (right column). The degree of carbon‐carbon, carbon‐iron, and carbon‐silicon polymerization generally increases with increasing pressure and decreasing oxidation state of the melts. See electronic version for color representation of the figures in this book.
carbonate ions relative to molecular carbon dioxide is positively correlated to oxygen fugacity. More oxidized pyrolitic melts only contain C2O4, C2O5, C2O6, and C2O7, with nearly no C3Ox species forming while the more reduced melts have a wide range of CxOy species present. The oxygen fugacity of the melt is negatively correlated with the degree of carbon‐carbon polymerization, as well as the degree of direct carbon‐iron and carbon‐ silicon bonding. Thus, more carbon will bond to other carbon atoms and other cations, such as iron and silicon, in a more reducing environment. Indeed, as Figure 16.4 shows, there is a considerably larger amount of direct carbon‐iron bonds for the pyrolite + CO compositions than for the pyrolite + CO2 compositions. The same is true, and maybe even more pronounced, for the carbon‐ silicon bonds in case of the forsterite + C compared to forsterite + CO2. The pyrolite + CO2 and forsterite + CO2 show similar behavior, suggesting once more that the oxygen fugacity and/or the state of entry of C into the system are the dominant factors determining its spe ciation. These findings are in agreement with experi mental studies that observed direct carbon‐silicon bonds in reduced ferrobasalt melt (Kadik, 2004) and reduced SiLiOC melt (Sen et al., 2013).
16.3.4. Elemental Diffusivities
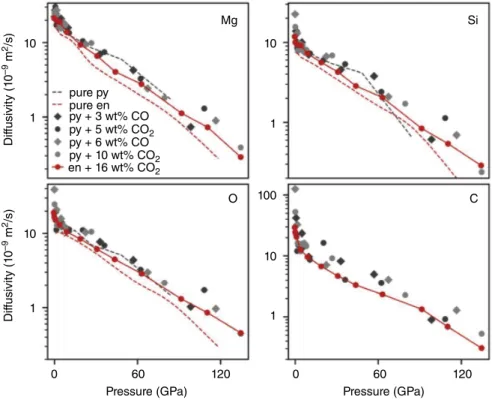
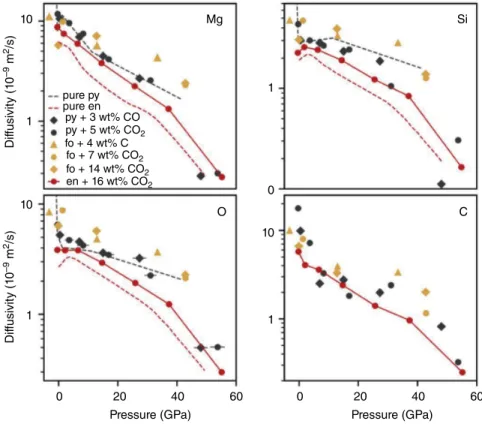
Ghosh and Karki (2017) examined the transport properties of MgSiO3 enstatite melt with 16.1 wt.% CO2 at 2200–5000 K up to 140 GPa and found that the addition of carbon increases the diffusivity rates of all elements. However, the diffusivity rates of cations in more complex melts, such as basalt and kimberlite at 12 GPa and 1273 K (Vuilleumier et al., 2015) and pyrolite up to 140 GPa and 3000–5000 K, appear to be unaf fected by the presence of carbon (Figure 16.5). The dif fusion rates of oxygen and magnesium are nearly identical in carbonated pyrolite and carbonated enstatite, while silicon and carbon appear to have higher diffusion rates in carbonated pyrolite than in carbon ated enstatite, indicating that as network formers, silicon and carbon are more mobile in the less polymer ized pyrolite melt relative to the more polymerized enstatite melt. There is good agreement in the change of slope of the elemental diffusivities with pressure at around 5 GPa and 4000 K in the different melts. At 3000 K, the diffusion rates of magnesium, silicon, carbon, and oxygen increase with decreasing polymeri zation of the melt: enstatite < pyrolite < forsterite
10 pure py pure en py + 3 wt% CO py + 5 wt% CO2 py + 10 wt% CO2 en + 16 wt% CO2 py + 6 wt% CO Mg O
Pressure (GPa) Pressure (GPa)
0 60 120 0 60 120 C Si Dif fusivit y (1 0 –9 m 2/s) Dif fusivit y (1 0 –9 m 2/s) 1 10 1 10 1 10 100 1
Figure 16.5 Elemental diffusivities of magnesium, silicon, oxygen and carbon at 4000 K in pure pyrolite melt
(“pure py”), pure enstatite melt (“pure en”), pyrolite melt with 3.35 wt.% CO (“py + 3 wt.% CO”), pyrolite melt with 5.16 wt.% CO2 (“pyr + 5 wt.% CO2”), pyrolite melt with 6.48 wt.% CO (“py + 6 wt.% CO”), pyrolite melt with 9.82 wt.% CO2 (“py + 10 wt.% CO2”), and enstatite melt melt with 16.1 wt.% CO2 (“en + 16 wt.% CO2”).
Pyrolite data is from Solomatova et al. (2019) and enstatite data is from Ghosh and Karki (2017). See electronic version for color representation of the figures in this book.
(Figure 16.6). When the atoms are more strongly bound in a silicate network, their diffusion rates are lower.
16.3.5. Equation of State
Solomatova et al. (2019) found that K0 is generally positively correlated with the degree of oxidation and negatively correlated with temperature and carbon concentration; K’0 is positively correlated with the degree of oxidation, temperature, and carbon concentration. Table 16.2 lists the equation of state parameters for a wide range of melts. Solomatova et al. find that the density difference between carbon‐bearing and carbon‐free pyrolite melts is larger at low pressure (where the density ratio of carbonated pyrolite to pure pyrolite ranges from 0.90 to 0.97 at 0 GPa), while above 10–20 GPa the densities converge, resulting in a density ratio of about 0.98–1. Consequently, carbon‐bearing melts would be expected to be relatively less buoyant at lower‐mantle pressures than at pressures of the upper mantle.
16.3.6. Diamond Formation
From a strict thermodynamical point of view, dia monds should not exist on the surface of the Earth. We find them naturally in rocks because they form at depth and are brought to the surface by uprising molten rock (magmas). Some of these diamonds coming from the deep mantle contain geochemical and mineralogical keys to the functioning of the entire silicate mantle. Hence, understanding their formation is fundamental to tracing the cycles of matter inside our planet. The formation of diamonds in Earth’s deep mantle is poorly understood due to the limitations of experimental methods and our inability to access the diamond‐forming depths of the mantle. Diamonds likely form in a wide range of pressure‐ temperature regimes and chemical environments (Cartigny et al., 2001; Kaminsky, 2012; Meyer, 1985). In the uppermost mantle, diamonds are thought to form during metamorphic reactions (Boyd & Finnerty, 1980), metasomatism (Shee et al., 1982; Sverjensky & Huang, 2015) and in magmatic processes (Meyer, 1985). It has
pure py pure en py + 3 wt% CO py + 5 wt% CO2 fo + 7 wt% CO2 fo + 14 wt% CO2 en + 16 wt% CO2 fo + 4 wt% C 0 20
Pressure (GPa) Pressure (GPa)
40 60 0 20 40 60 Mg O C Si Dif fusivit y (1 0 –9 m 2/s) Dif fusivit y (1 0 –9 m 2/s) 1 0 10 1 10 1 10 1
Figure 16.6 Elemental diffusivities of magnesium, silicon, oxygen, and carbon at 3000 K in pure pyrolite melt
(“pure py”), pure enstatite melt (“pure en”), pyrolite melt with 3.35 wt.% CO (“py + 3 wt.% CO”), pyrolite melt with 5.16 wt.% CO2 (“py + 5 wt.% CO2”), forsterite melt with 4.09 wt.% C (“fo + 4 wt.% C”), forsterite melt with 7.25 wt.% CO2 (“fo + 7 wt.% CO2”) and forsterite melt with 13.52 wt.% CO2 (“fo + 14 wt.% CO2”), and enstatite melt melt with 16.1 wt.% CO2 (“en + 16 wt.% CO2”). Pyrolite data is from Solomatova et al. (2019), forsterite data is from this study, and enstatite data is from Ghosh and Karki (2017). See electronic version for color representa-tion of the figures in this book.
been proposed that many of the diamonds interpreted to have originated in the transition zone and lower mantle formed from subducted carbon (Burnham et al., 2015; Pal’yanov et al., 2002; Walter et al., 2011; Zedgenizov et al., 2015). However, it is likely that a fraction of super deep diamonds, many of which may have never reached the surface, formed during the crystallization of the mantle after the moon‐forming impact in the Hadean and subsequently during the Archaean and Proterozoic eons (Gurney et al., 2010; Helmstaedt et al., 2010). There have been a few computational ab initio studies exam ining the behavior of carbon in silicate melts with a focus on carbon coordination by oxygen (Ghosh et al., 2017; Guillot & Sator, 2011; Vuilleumier et al., 2015); however, there have been no computational studies characterizing the genesis of diamonds in pyrolitic melts.
The analysis of diamonds in metamorphic rocks pro vides some information on the depths at which the dia monds formed and the mechanisms by which they grew. For example, octahedral diamonds in peridotitic and eclogitic rocks displayed a spiral growth mechanism, indicating that the crystal moved freely in carbon‐bearing
silicate melt (Bulanova, 1995). The formation and growth of diamonds has been experimentally observed in a kim berlitic melt at 1800 °C–2200 °C and 7–7.7 GPa (Arima et al., 1993), and from dolomite+iron through carbon‐ iron redox reactions (Dorfman et al., 2018). However, the coordination of carbon in the melt and the mechanism of subsequent polymerization of carbon could not be deter mined due to limitations in experimental techniques.
Although redox reactions, such as the oxidation of methane or reduction of carbon dioxide, have been consid ered a necessary step for the formation of diamonds, it has been recently shown that diamonds can form from a reac tion of carboxylates (e.g. acetate [CH3COO‐]) with water at
constant oxygen fugacity (Sverjensky et al., 2014; Sverjensky & Huang, 2015). In pyrolitic melts, Solomatova et al. (2019) observed various oxo‐carbon species, such as C2O2, i.e. eth ylenedione, and C2O4, i.e. oxalate, (Figure 16.5), suggesting that in the presence of hydrogen, the formation of dia monds from acetate is possible. These polymerized carbon chains are reminiscent of carboxylates and may be consid ered precursors to the formation of diamonds. This sug gests a mechanism for diamond formation in pyrolitic melts
Table 16.2 Equation of state parameters for silicate melts with varying concentrations of carbon. We compare our results
to the experimental studies on carbon‐bearing peridotitic and basaltic melts (Sakamaki et al., 2011[not in refs]; Ghosh et al., 2007[2009 or 2017?]). An isothermal fourth‐order Birch Murnaghan equation of state was fitted to the pressure‐density data sets for the pyrolite and carbonated Mg2SiO4 melts. An isothermal third‐order Birch Murnaghan equation of state was used to fit the pressure‐volume data for Mg2SiO4 (this study), MgSiO3 (Ghosh et al., 2017), peridotite (Sakamaki et al., 2011[no])
and basalt (Ghosh et al., 2007[no]).
Melt Composition T (K) ρ0 (g/cm3) K0(GPa) K’0 K”0
pyrolitea 3000 2.265(2) 12.3(1) 7.8(1) –2.4(1) pyrolite + 3.35 wt.% COa 2.19(6) 12(5) 7(3) –2(3) pyrolite + 5.16 wt.% CO2a 2.14(1) 10.0(6) 7.6(4) –2.5(5) Mg2SiO4b 2.658(1) 56.3(2) 3.60(4) — Mg2SiO4 + 0.53 wt.% Cb 2.4(1) 24(10) 6(1) –0.5(5) Mg2SiO4 + 1.92 wt.% CO2b 2.13(5) 10(6) 6.0(5) –1.0(4) Mg2SiO4 + 3.61 wt.% MgCO3b 2.684(7) 39(1) 4.75(8) –0.13(1) MgSiO3c 2.56(2) 18(1) 6.9(2) — MgSiO3 + 5.2 wt.% CO2c 2.43(3) 16(2) 6.5(2) — peridotite + 2.5 wt.% CO2d — 23(1) 7(1) — basalt + 5 wt.% CO2, expe — 16(1) 5.2(2) — pyrolitea 4000 2.03(4) 8(1) 8(1) –4(3) pyrolite + 3.35 wt.% COa 1.92(4) 7(2) 6.7(9) –2(1) pyrolite + 5.16 wt.% CO2a 1.96(4) 9(2) 6.2(9) –1(1) pyrolite + 6.48 wt.% COa 1.71(4) 3.3(6) 8.2(6) –8(3) pyrolite + 9.82 wt.% CO2a 1.78(1) 3.8(3) 8.8(4) –9(2) pyrolitea 5000 1.77(2) 4.9(6) 7.4(5) –4(1) pyrolite + 3.35 wt.% COa 1.56(5) 2.2(8) 9(2) –17(15) pyrolite + 5.16 wt.% CO2a 1.56(6) 2(1) 10(3) –19(24)
a Ab initio molecular dynamics calculations on pyrolite melt from Solomatova et al. (2019). b Ab initio molecular dynamics calculations on Mg
2SiO4 forsterite melt, this study. c Ab initio molecular dynamics calculations on MgSiO
3 enstatite melt from Ghosh et al. (2017). d Experimental results on peridotite melt from Sakamaki et al. (2011).
at large depths that does not necessitate the direct formation of oxygen‐free carbon clusters; instead, diamond embryos on the nano scale could form through a pathway involving polymerized hydrocarbons, as described in Sverjensky et al. (2014) and Sverjensky and Huang (2015).
16.4. CONCLUSIONS
Experiments on silicate melts have demonstrated that at 1–4 GPa and 1000 °C–2000 °C, both the solubility and speciation of carbon depend most strongly on pressure and composition. Carbon solubility increases rapidly with small increases in pressure and is generally positively correlated with the concentration of CaO in the melt, while the CO2/(CO2+CO32‐) ratio is negatively correlated
with pressure and is highly sensitive to the silica content, such that carbon exists almost exclusively as CO2 in silica‐ rich felsic melts (e.g. rhyolite) and as CO32‐ in silica‐poor
mafic melts (e.g. basalt). Meanwhile, molecular dynamics simulations of silicate melts at 0–140 GPa and 1400–5000 K have come to a general conclusion that there is a strong positive correlation of carbon solubility with pressure, a weak negative correlation of solubility with temperature, and a positive correlation of CO2/(CO2+CO32‐) with tem
perature. Simulations predict that the concentration of CO2 sharply decreases at the expense of CO32‐ with
increasing pressure between 0 and 5 GPa, in agreement with experimental observations; between 10 and 140 GPa, pressures above what has been achieved by most experiments on carbonated silicate melts, CO44‐ species
appear and their concentration increases with increasing pressure at the expense of CO2+CO32‐.
Here we also demonstrate a need for high‐pressure high‐temperature experiments on carbonated multicom ponent silicate melts to confirm the computationally pre dicted carbon‐carbon polymerization, carbon‐silicon bonding, and carbon‐iron complexes. Ab initio computa tional studies on CO2‐H2O‐bearing silicate melts would help understand the effect of water on carbon’s speciation and solubility. The detailed effect of composition and polymerization in complex silicate melts needs to be deter mined both experimentally and computationally, to thor oughly understand the speciation and solubility of carbon in the interior of the Earth. Finally, to constrain the carbon concentration of Earth’s interior, it is crucial to determine the fraction of carbon that was retained in the planet after the Giant Impact via calculations on the vol atility of carbon in pyrolitic‐type melt and of partitioning between the molten magma ocean and molten core.
ACKNOWLEDGMENTS
This research was supported by the European Research Council (ERC) under the European Union’s Horizon
2020 research and innovation program (grant agreement No. 681818 – IMPACT to R. Caracas) and by the Deep Carbon Observatory. R. Caracas acknowledges access to the GENCI supercomputers (Occigen, Ada, and Curie) through the stl2816 series of eDARI computing grants. R. Cohen acknowledges access to the Teragrid/Xsede facilities via grant EAR080015. REC was supported by the ERC Advanced Grant ToMCaT and the Carnegie Institution. R. Cohen gratefully acknowledges the Gauss Center for Supercomputing e.V. (www.gauss‐centre.eu) for funding this project by providing computing time on the GCS Supercomputer SuperMUC at Leibniz Supercomputing Centre (LRZ, www.lrz.de).
REFERENCES
Arima, M., Nakayama, K., Akaishi, M., Yamaoka, S., & Kanda, H. (1993). Crystallization of diamond from a silicate melt of kimberlite composition in high‐pressure and high‐ temperature experiments. Geology, 21(11), 968. https://doi. org/10.1130/0091‐7613(1993)021<0968:CODFAS>2.3.CO;2 Behrens, H., Misiti, V., Freda, C., Vetere, F., Botcharnikov, R.
E., & Scarlato, P. (2009). Solubility of H2O and CO2 in ultra
potassic melts at 1200 and 1250 °C and pressure from 50 to 500 MPa. American Mineralogist, 94(1), 105–120. https://doi. org/10.2138/am.2009.2796
Behrens, H., & Nowak, M. (2003). Quantification of H2O spe
ciation in silicate glasses and melts by IR spectroscopy: In situ versus quench techniques. Phase Transitions, 76(1–2), 45–61. https://doi.org/10.1080/0141159031000076048 Behrens, H., Zhang, Y., & Xu, Z. (2004). H2O diffusion in
dacitic and andesitic melts. Geochimica et Cosmochimica
Acta, 68(24), 5139–5150. https://doi.org/10.1016/j.gca.
2004.07.008
Blank, J. G. (1993). An experimental investigation of the behavior of carbon dioxide in rhyolitic melt (PhD thesis). California Institute of Technology. Retrieved from http:// resolver.caltech.edu/CaltechETD:etd‐05302007‐075656 Blank, J. G., & Brooker, R. A. (1994). Experimental studies of
carbon dioxide in silicate melts: Solubility, speciation, and stable carbon isotope behavior. Reviews in Mineralogy and
Geochemistry, 30, 157–186.
Blank, J. G., Stolper, E. M., & Carroll, M. R. (1993). Solubilities of carbon dioxide and water in rhyolitic melt at 850 °C and 750 bars. Earth and Planetary Science Letters, 119(1–2), 27– 36. https://doi.org/10.1016/0012‐821X(93)90004‐S
Botcharnikov, R. E., Behrens, H., & Holtz, F. (2006). Solubility and speciation of C–O–H fluids in andesitic melt at T= 1100– 1300 C and P= 200 and 500 MPa. Chemical Geology, 229(1– 3), 125–143. https://doi.org/10.1016/j.chemgeo.2006.01.016 Botcharnikov, R. E., Koepke, J., Holtz, F., McCammon, C., &
Wilke, M. (2005). The effect of water activity on the oxidation and structural state of Fe in a ferro‐basaltic melt. Geochimica
et Cosmochimica Acta, 69(21), 5071–5085. https://doi.
org/10.1016/j.gca.2005.04.023
Botcharnikov, Roman E., Holtz, F., & Behrens, H. (2007). The effect of CO2 on the solubility of H2O‐Cl fluids in andesitic
melt. European Journal of Mineralogy, 19(5), 671–680. https:// doi.org/10.1127/0935‐1221/2007/0019‐1752
Boyd, F. R., & Finnerty, A. A. (1980). Conditions of origin of natural diamonds of peridotite affinity. Journal of Geophysical
Research: Solid Earth, 85(B12), 6911–6918. https://doi.
org/10.1029/JB085iB12p06911
Brenker, F., Vollmer, C., Vincze, L., Vekemans, B., Szymanski, A., Janssens, K., et al. (2006). CO2‐recycling to the deep con vecting mantle. Geochimica et Cosmochimica Acta, 70(18), 66. Brey, G. (1976). CO2 solubility and solubility mechanisms in sili cate melts at high pressures. Contributions to Mineralogy and
Petrology, 57(2), 215–221. https://doi.org/10.1007/BF00405226
Brey, G. P., & Green, D. H. (1976). Solubility of CO2 in olivine
melilitite at high pressures and role of CO2 in the earth’s upper mantle. Contributions to Mineralogy and Petrology,
55(2), 217–230. https://doi.org/10.1007/BF00372228
Brooker, R. A., Kohn, S. C., Holloway, J. R., & McMillan, P. F. (2001a). Structural controls on the solubility of CO2 in silicate melts: Part I. Bulk solubility data. Chemical Geology, 174(1), 225–239. https://doi.org/10.1016/S0009‐2541(00)00353‐3 Brooker, R. A., Kohn, S. C., Holloway, J. R., & McMillan, P. F.
(2001b). Structural controls on the solubility of CO2 in sili cate melts: Part II. IR characteristics of carbonate groups in silicate glasses. Chemical Geology, 174(1), 241–254. https:// doi.org/10.1016/S0009‐2541(00)00318‐1
Brooker, R. A., Kohn, S. C., Holloway, J. R., McMillan, P. F., & Carroll, M. R. (1999). Solubility, speciation and dissolution mechanisms for CO2 in melts on the NaAlO2–SiO2 join.
Geochimica et Cosmochimica Acta, 63(21), 3549–3565. https://
doi.org/10.1016/S0016‐7037(99)00196‐9
Bulanova, G. P. (1995). The formation of diamond. Journal of
Geochemical Exploration, 53(1), 1–23. https://doi.org/10.1016
/0375‐6742(94)00016‐5
Burnham, A. D., Thomson, A. R., Bulanova, G. P., Kohn, S. C., Smith, C. B., & Walter, M. J. (2015). Stable isotope evidence for crustal recycling as recorded by superdeep diamonds.
Earth and Planetary Science Letters, 432, 374–380. https://
doi.org/10.1016/j.epsl.2015.10.023
Cartigny, P., Harris, J. W., & Javoy, M. (2001). Diamond genesis, mantle fractionations and mantle nitrogen content: a study of δ13C–N concentrations in diamonds. Earth and Planetary
Science Letters, 185(1), 85–98. https://doi.org/10.1016/S0012‐
821X(00)00357‐5
Dixon, J. E. (1997). Degassing of alkalic basalts. American
Mineralogist, 82(3–4), 368–378. https://doi.org/10.2138/
am‐1997‐3‐415
Dorfman, S. M., Badro, J., Nabiei, F., Prakapenka, V. B., Cantoni, M., & Gillet, P. (2018). Carbonate stability in the reduced lower mantle. Earth and Planetary Science Letters,
489, 84–91. https://doi.org/10.1016/j.epsl.2018.02.035
Duan, X. (2014). A general model for predicting the solubility behavior of H2O–CO2 fluids in silicate melts over a wide range of pressure, temperature and compositions. Geochimica
et Cosmochimica Acta, 125, 582–609. https://doi.org/10.1016/j.
gca.2013.10.018
Eggler, D. H. (1987). Discussion of recent papers on carbonated peridotite, bearing on mantle metasomatism and magmatism: An alternative. Earth and Planetary Science Letters, 82(3), 398–400. https://doi.org/10.1016/0012‐821X(87)90214‐7
Eitel, W., & Weyl, W. (1932). Residuals in the melting of commercial glasses. Journal of the American Ceramic Society, 15(3), 159– 166. https://doi.org/10.1111/j.1151‐2916.1932.tb13916.x Fine, G., & Stolper, E. (1985). The speciation of carbon dioxide in
sodium aluminosilicate glasses. Contributions to Mineralogy and
Petrology, 91(2), 105–121. https://doi.org/10.1007/BF00377759
Fine, G., & Stolper, E. (1986). Dissolved carbon dioxide in basaltic glasses: Concentrations and speciation. Earth and
Planetary Science Letters, 76(3–4), 263–278. https://doi.org/1
0.1016/0012‐821X(86)90078‐6
Fogel, R. A., & Rutherford, M. J. (1990). The solubility of carbon dioxide in rhyolitic melts: A quantitative FTIR study. American
Mineralogist, 75(11–12), 1311–1326.
Ghosh, D. B., Bajgain, S. K., Mookherjee, M., & Karki, B. B. (2017). Carbon‐bearing silicate melt at deep mantle conditions. Scientific Reports, 7(1). https://doi.org/10.1038/ s41598‐017‐00918‐x
Ghosh, D. B., & Karki, B. B. (2017). Transport properties of carbonated silicate melt at high pressure. Science Advances,
3(12), e1701840. https://doi.org/10.1126/sciadv.1701840
Ghosh, S., Ohtani, E., Litasov, K., Suzuki, A., & Sakamaki, T. (2007). Stability of carbonated magmas at the base of the Earth’s upper mantle. Geophysical Research Letters, 34(22). https://doi.org/10.1029/2007GL031349
Guillot, B., & Sator, N. (2011). Carbon dioxide in silicate melts: A molecular dynamics simulation study. Geochimica
et Cosmochimica Acta, 75(7), 1829–1857. https://doi.
org/10.1016/j.gca.2011.01.004
Gurney, J. J., Helmstaedt, H. H., Richardson, S. H., & Shirey, S. B. (2010). Diamonds through time. Economic Geology,
105(3), 689–712. https://doi.org/10.2113/gsecongeo.105.3.689
Gygi, F. (2018). Qbox: A large‐scale parallel implementation of first‐principles molecular dynamics. http://www.qboxcode. org/
Hammouda, T. (2003). High‐pressure melting of carbonated eclog ite and experimental constraints on carbon recycling and storage in the mantle. Earth and Planetary Science Letters, 214(1–2), 357–368. https://doi.org/10.1016/S0012‐821X(03)00361‐3 Helmstaedt, H. H., Gurney, J. J., & Richardson, S. H. (2010).
Ages of cratonic diamond and lithosphere evolution: Constraints on precambrian tectonics and diamond explora tion. The Canadian Mineralogist, 48(6), 1385–1408. https:// doi.org/10.3749/canmin.48.5.1385
Holloway, J. R. (1976). Fluids in the evolution of granitic magmas: Consequences of finite CO2 solubility. GSA Bulletin,
87(10), 1513–1518. https://doi.org/10.1130/0016‐7606(1976)8
7<1513:FITEOG>2.0.CO;2
Holloway, J. R., & Blank, J. G. (1994). Application of experi mental results to C‐O‐H species in natural melts. Reviews in
Mineralogy and Geochemistry, 30(1), 187–230.
Iacono‐Marziano, G., Morizet, Y., Le Trong, E., & Gaillard, F. (2012). New experimental data and semi‐empirical parame terization of H2O–CO2 solubility in mafic melts. Geochimica
et Cosmochimica Acta, 97, 1–23. https://doi.org/10.1016/j.
gca.2012.08.035
Isshiki, M., Irifune, T., Hirose, K., Ono, S., Ohishi, Y., Watanuki, T., et al. (2004). Stability of magnesite and its high‐pressure form in the lowermost mantle. Nature, 427(6969), 60–63. https://doi.org/10.1038/nature02181