HAL Id: cea-00853260
https://hal-cea.archives-ouvertes.fr/cea-00853260
Submitted on 2 Jul 2020HAL is a multi-disciplinary open access archive for the deposit and dissemination of sci-entific research documents, whether they are pub-lished or not. The documents may come from teaching and research institutions in France or abroad, or from public or private research centers.
L’archive ouverte pluridisciplinaire HAL, est destinée au dépôt et à la diffusion de documents scientifiques de niveau recherche, publiés ou non, émanant des établissements d’enseignement et de recherche français ou étrangers, des laboratoires publics ou privés.
Fertile forests produce biomass more efficiently
S. Vicca, S. Luyssaert, J. Peñuelas, M. Campioli, F.S. Chapin, P. Ciais, A.
Heinemeyer, P. Högberg, W. L. Kutsch, B. E. Law, et al.
To cite this version:
S. Vicca, S. Luyssaert, J. Peñuelas, M. Campioli, F.S. Chapin, et al.. Fertile forests produce biomass more efficiently. Ecology Letters, Wiley, 2012, 15, pp.520-526. �10.1111/j.1461-0248.2012.01775.x�. �cea-00853260�
This item is the archived peer-reviewed author-version of:
Fertile forests produce biomass more efficiently
Reference:
Vicca Sara, Luyssaert Sebastiaan, Peñuelas J., Campioli Matteo, Janssens Ivan, et al..- Fertile forests produce biomass more efficiently
Ecology letters - ISSN 1461-0248 - 15:6(2012), p. 520-526
Full text (Publishers DOI): http://dx.doi.org/doi:10.1111/j.1461-0248.2012.01775.x Handle: http://hdl.handle.net/10067/969720151162165141
1
Fertile forests produce biomass more efficiently
1 2
Vicca S1, Luyssaert S2, Peñuelas J3, Campioli M1, Chapin FS III4, Ciais P2, Heinemeyer A5,
3
Högberg P6, Kutsch WL7, Law BE8, Malhi Y9, Papale D10, Piao SL11, Reichstein M12, Schulze
4
ED12, Janssens IA1.
5 6
1 Department of Biology, University of Antwerp, 2610 Wilrijk, Belgium
7
2 LSCE CEA-CNRS-UVSQ, Orme des Merisiers, F-91191 Gif-sur-Yvette, France
8
3 Global Ecology Unit CREAF-CEAB-CSIC, CREAF (Center for Ecological Research and Forestry
9
Applications), Edifici C, Universitat Autònoma Barcelona, 08193 Bellaterra, Spain
10
4 Institute of Arctic Biology, University of Alaska Fairbanks, Fairbanks, AK 99775, USA
11
5 Environment Department, Centre for Terrestrial Carbon Dynamics (York-Centre) at the Stockholm
12
Environment Institute, University of York, YO10 5DD, York, UK
13
6 Department of Forest Ecology and Management, Swedish University of Agricultural Sciences (SLU), SE-901
14
83 Umeå, Sweden.
15
7 Johann Heinrich von Thünen Institut, Institute of Agricultural Climate Research, 38116 Braunschweig,
16
Germany
17
8 Forest Ecosystems and Society Department, Oregon State University, Corvallis, Oregon 97331, USA
18
9 Environmental Change Institute, School of Geography and the Environment, University of Oxford, Oxford
19
OX1 3QY, UK
20
10 Department of Forest Environment and Resources, University of Tuscia, I-01100 Viterbo, Italy
21
11 College of Urban and Environmental Sciences and KLESPME, Peking University, Beijing 100871, China
22
12 Max Planck Institute for Biogeochemistry, PO Box 100164, D-07701 Jena, Germany
23 24 25
Article type: Ideas and Perspectives
26
Short running title: Forests’ biomass production efficiency
27 28
Email: SV [email protected]; SL [email protected]; JP
29
[email protected]; MC [email protected]; FSC [email protected]; PC
30
[email protected]; AH [email protected]; PH [email protected]; WK
31
[email protected]; BEL [email protected]; YM
32
[email protected]; DP [email protected]; SLP [email protected]; MR
33
[email protected]; EDS [email protected]; IAJ
34
Authorship: SV, SL, JP and IAJ conceived the paper; SV performed the analyses and wrote the
36
paper; all authors contributed substantially to discussions and revisions.
37
Corresponding author: Sara Vicca, universiteitsplein 1, 2610 Wilrijk, Belgium;
38
[email protected]; tel.: +3232652282; fax: +3232652271
39 40
Keywords: global forest database; biomass production; photosynthesis; biomass production
41
efficiency; carbon allocation; nutrients; root symbionts
42 43
Word count: abstract: 150; main text: 2259; whole manuscript: 5936
44
Figures: 3 (of which one in BOX 1)
45 Tables: 3 46 Boxes: 2 47 Number of references: 39 48 49
2
Abstract
50
Trees with sufficient nutrition are known to allocate carbon preferentially to aboveground plant
51
parts. Our global study of 49 forests revealed an even more fundamental carbon allocation
52
response to nutrient availability: forests with high nutrient availability use 58±3% (mean±SE; 17
53
forests) of their photosynthates for plant biomass production, while forests with low nutrient
54
availability only convert 42±2% (mean±SE; 19 forests) of annual photosynthates to biomass.
55
This nutrient effect largely overshadows previously observed differences in carbon allocation
56
patterns among climate zones, forest types and age classes. If forests with low nutrient
57
availability use 16±4% less of their photosynthates for plant growth, what are these used for?
58
Current knowledge suggests that lower biomass production per unit photosynthesis in forests
59
with low- versus forests with high nutrient availability reflects not merely an increase in plant
60
respiration, but likely results from reduced carbon allocation to unaccounted components of net
61
primary production, particularly root symbionts.
62 63 64
3
Introduction
65
Plant physiologists often argue that, across species and biomes, plants respire a nearly constant
66
fraction – approximately 50% – of the carbon taken up during photosynthesis (GPP) (Gifford
67
1994, 1995; Dewar et al. 1998; Waring et al. 1998; Enquist et al. 2007; Van Oijen et al. 2010).
68
The remaining carbon – termed net primary production (NPP) – is converted into plant biomass
69
and other complex molecules used for multiple purposes (e.g., root exudation, production of
70
volatile organic compounds). The relative constancy of the partitioning of GPP into autotrophic
71
respiration (Ra) and NPP would reflect the interdependence of respiration and photosynthesis.
72
Respiration depends on the substrate provided by photosynthesis, which in turn relies on
73
respiration to provide the energy required for construction of complex compounds such as carbon
74
skeletons for protein synthesis (Krömer 1995; Hoefnagel et al. 1998). Unfortunately, the
75
verification of this theory at the ecosystem scale is severely hampered by the fact that NPP and
76
Ra are difficult to quantify for the entire ecosystem. While Ra occurs in every living plant cell
77
within the ecosystem, NPP includes numerous carbon-consuming processes (plant growth, root
78
exudation, carbon allocation to symbionts and production of volatile organic compounds). The
79
paucity of accurate data on forest ecosystem Ra and NPP globally explains why the partitioning
80
of GPP at the ecosystem scale remains poorly understood.
81
82
Because biomass production constitutes the largest fraction of NPP, biomass production is
83
commonly used as a proxy for NPP (Waring et al. 1998; DeLucia et al. 2007; Drake et al. 2011;
84
Goulden et al. 2011). In contrast to theoretical argumentations for a constrained NPP-to-GPP
85
ratio (Dewar et al. 1998; Van Oijen et al. 2010), field measurements in forests revealed
86
substantial variation in the biomass production-to-GPP ratio (DeLucia et al. 2007). The biomass
87
production-to-GPP ratio was reported to be higher in forests of the temperate zone, in particular
4
in broadleaved temperate forests (DeLucia et al. 2007), and to decrease with increasing stand age
89
(DeLucia et al. 2007; Goulden et al. 2011). These results are, however, tentative because the
90
effect of stand age is confounded with forest type and climate zone; the majority of the young
91
forests is located in the temperate zone (DeLucia et al. 2007; Drake et al. 2011).
92 93
Because biomass production and GPP data have become increasingly available in recent years,
94
we revisited the global variation in ecosystem-scale carbon partitioning patterns using a global
95
forest database (Luyssaert et al. 2007). For the current study, we selected only those forests that
96
provided estimates of above- and belowground biomass production and GPP that were
97
independent from each other (i.e., biomass production estimates via biometry and GPP via eddy
98
covariance or in a few cases using a model). Whenever necessary, biomass production estimates
99
of the resulting 49 forests were complemented with estimates of missing biomass components.
100
This procedure did not affect our conclusions (see Appendix S1). Further detailed information
101
regarding the dataset is provided in Appendix S1.
102 103
Last, to make a clear distinction with the NPP-to-GPP ratio (which comprises not only plant
104
biomass production, but also production of volatile organic compounds, root exudates and root
105
symbionts), we here introduce the term Biomass Production Efficiency (BPE) when referring to
106
the biomass production-to-GPP ratio. Biomass production contains all the biomass produced
107
within a year irrespective of whether this biomass dies within the same or subsequent years.
108 109
Variables explaining variation in biomass production efficiency
110
Previous studies focussed on climate, forest type and stand age to explain the observed
111
differences in the biomass production-to GPP ratio among forests (DeLucia et al. 2007; Goulden
5 et al. 2011). Nutrient availability and forest management (unmanaged versus management
113
involving harvesting, thinning, etc.) significantly affect allocation patterns in forests (Shan et al.
114
2001; Litton et al. 2007; LeBauer & Treseder 2008). Plants exposed to ample nutrients invest
115
relatively less carbon in roots, while plants growing under low nutrient availability use relatively
116
more carbon for root growth at the expense of aboveground growth (Chapin 1980). Forest
117
management also has been found to decrease root-to-shoot ratios (Shan et al. 2001) and both
118
nutrient availability and forest management are thus potentially important factors influencing
119
BPE. So far, however, they have not been assessed.
120 121
While information on climate, forest type, stand age and management practices is easily
122
available, measured nutrient availability is not. Estimation of comparable nutrient availability is
123
not a simple task and requires standardized measurements. Effective plant nutrient availability
124
depends on multiple factors besides soil nutrient content (soil texture, pH, cation exchange
125
capacity, moisture), such that it can differ substantially among sites with, for example, similar
126
soil nitrogen contents but different soil texture. Furthermore, comparison of nutrient availability
127
among ecosystems requires consideration of all plant nutrients, and not only nitrogen, as was
128
demonstrated for a range of hardwood forests in northern United States and Canada
129
(Vadeboncoeur 2010). Unfortunately, such a uniform estimation of nutrient availability in forests
130
across the globe does not currently exist. In order to test whether BPE increased with increasing
131
nutrient availability, we therefore assigned each of the 49 forests in our dataset to one of three
132
categories: low-, medium-, or high-nutrient availability following the information available in
133
literature (see Table S3 in Appedix S2).
134 135
6
Although this classification is not a simple task, information for forests of the low and high
136
nutrient availability class was generally very clear. Forests of the low nutrient availability class
137
were typically located on soils with extremely low nutrient content due to weathering, leaching,
138
or low mineralization rates. In contrast, some of the forests assigned to the high nutrient
139
availability class grew on former (fertilized) agricultural land, while others were located on soil
140
types that are renowned as very fertile (see Appendix S2). Moreover, for 14 of the 17 forests of
141
the high nutrient availability class, an explicit statement of the nutrient status was provided in
142
publications (see Appendix S2). Last, a sensitivity analysis revealed that potential
143
misclassification of sites with relatively little information would not influence our conclusions
144
(Table S4).
145 146
As expected, differences in absolute biomass production between forests of similar nutrient status
147
growing in different climate zones were large (Tables 1 and 3), but these differences were
148
entirely attributable to differences in GPP, with BPE changing little within nutrient classes (Table
149
1). In contrast, the large differences in biomass production among temperate-zone forests of
150
different nutrient availability were not solely due to variation in GPP. Whereas GPP did not
151
significantly differ between temperate forests of the low and high nutrient availability class
152
(+31%, p=0.19; Table 1), biomass production was 78% higher in temperate forests of the high
153
nutrient availability class than in temperate forests with low nutrient availability (p=0.01; Table
154
1). This disproportionate increase in biomass production relative to GPP was most pronounced in
155
woody biomass, with three-fold higher aboveground wood production at high compared to low
156
nutrient availability (p=0.02; Table 2), while foliage and root biomass production remained
157
largely unchanged (Table 2; p=0.49 and p=0.83, respectively). As a consequence of the much
158
larger nutrient effect on biomass production compared to GPP, BPE was 35±9% (mean±SE)
7
higher for temperate forests of high nutrient availability than in temperate forests of low nutrient
160
availability (p=0.03; Table 1).
161 162
In order to test whether nutrient availability was indeed the key factor explaining variation in
163
BPE, we performed a stepwise regression analysis including climate zone (boreal, temperate and
164
tropical), forest type (coniferous, broadleaved and mixed), stand age, nutrient availability and
165
forest management (i.e., unmanaged or managed). For more information regarding stepwise
166
regression analysis, see Cohen (1991), Derr & Everitt (2002) and Appendix S4. In contrast to
167
results reported in other analyses (DeLucia et al. 2007; Goulden et al. 2011), analysis of our data
168
set indicated that neither climate zone, nor forest type or stand age significantly affected BPE,
169
whereas nutrient availability affected BPE highly significantly (p<0.01). Independently of
170
climate or forest type, forests with high nutrient availability allocated on average 58±3%
171
(mean±SE of 17 forests) of their photosynthates to biomass production, whereas forests with low
172
nutrient availability used on average only 42±2% (mean±SE of 19 forests) of their photosynthates
173
for biomass production (i.e., slopes of lines in Fig. 1; p<0.01 for low versus high nutrient
174
availability). This result of nutrient availability being the primary determinant of BPE was
175
confirmed also by other statistical tests (see Appendix S4), irrespective of whether or not we
176
accounted for measurement uncertainties.
177 178
Figure 2A further suggests that previously reported differences in BPE among boreal, temperate
179
and tropical forests (DeLucia et al. 2007) were introduced by the uneven distribution of forests
180
with high nutrient availability (with higher BPE) across the globe, being heavily biased towards
181
the temperate zone. Likewise, the previously reported difference between coniferous and
182
broadleaved forests (DeLucia et al. 2007) was not apparent when taking nutrient availability into
8
account, probably because nutrient-rich soils were occupied more by broadleaved than by
184
coniferous forests (Fig. 2C).
185 186
In addition to nutrient availability, which was by far the dominant determinant of variation in
187
BPE, management also affected BPE significantly according to the stepwise regression analysis
188
(p=0.02). Managed forests exhibited higher BPE than unmanaged forests for both low and high
189
nutrient availability classes (Fig. 2B), but quantification of this effect remains premature because
190
of the uneven distribution of unmanaged and managed forests among nutrient classes (Fig. 2B).
191
Nonetheless, the distinction between unmanaged and managed forests appeared an important
192
factor in the relationship between stand age and BPE, because the tendency for a negative age
193
effect on BPE as observed in Figure 2D only became significant (p=0.04) if management regime
194
was not included in the stepwise regression analysis.
195 196
Underlying mechanisms
197
The significantly higher BPE in forests with high nutrient availability as compared to forests of
198
the medium or low nutrient availability class implies that either a smaller fraction of GPP is being
199
respired in the forests with high nutrient availability, or a smaller fraction of GPP is partitioned to
200
unaccounted NPP components (VOC emissions, root symbionts, root exudation), or a
201
combination of both. Because estimates of carbon transfers to volatile organic compounds
202
(VOC), and to root exudates and symbionts are not available for any of the forests in our
203
database, the only way to test why BPE differs between forests of different nutrient availability is
204
by comparing estimates of the Ra-to-GPP ratio. Many pitfalls arise when measuring Ra at the
205
ecosystem level (Ryan et al. 1997; Amthor & Baldocchi 2001), ecosystem Ra is therefore most
9
often estimated as the residual of GPP minus biomass production, rendering these Ra estimates
207
useless to test whether or not variation in the ratio of Ra to GPP could explain variation in BPE.
208 209
Only 11 of our sites provided ecosystem Ra and GPP estimates that were independent from
210
biomass production. These 11 forests revealed no effect of nutrient availability on the Ra-to-GPP
211
ratio (see Fig. 3 in BOX 1), suggesting that variation in the ratio of Ra to GPP does not explain
212
the higher BPE in nutrient-rich forests. Obviously, the limited data availability constrains the
213
robustness of this analysis. Nonetheless, in addition to this lack of empirical evidence for a
214
difference in the Ra-to-GPP ratio among nutrient availability classes, it appears unlikely that
215
nutrient-rich forests that grow faster (which would lead to more growth respiration) and that
216
likely exhibit higher protein levels (which would lead to higher maintenance respiration would
217
exhibit considerably lower Ra-to-GPP ratios than nutrient-poor forests (see BOX 1 for a more
218
thorough elaboration of the underlying rationale). We therefore hypothesize that the unmeasured
219
NPP components explain the difference in BPE among nutrient availability classes. Particularly
220
root symbionts are a plausible candidate (BOX 2).
221 222
Finally, managed forests exhibited higher BPE than unmanaged forests for both the high and low
223
nutrient availability class. Management via thinning sometimes implies removal of biomass
224
expected to grow sub-optimally, such as suppressed trees with large autotrophic respiration
225
relative to GPP. Such removals may decrease the relative amount of maintenance respiration and
226
consequently also the Ra-to-GPP ratio. The higher BPE in managed than in unmanaged forests
227
may thus reflect this reduced Ra-to-GPP ratio. In addition, managed forests may exhibit higher
228
BPE than unmanaged forests because frequent anthropogenic disturbances tend to (further)
229
increase nutrient availability.
10
231
Our analysis of 49 forest sites where biomass production and GPP were independently measured
232
revealed that nutrient availability may be the unifying mechanism controlling the ratio of biomass
233
production-to-GPP that encompasses climate, forest type, and stand age as influencing factors.
234
The carbon sink potential of forests largely depends on how carbon taken up during
235
photosynthesis is partitioned. Photosynthates partitioned to Ra do not contribute to carbon
236
sequestration but those converted into long-lived biomass do contribute. The observed pattern of
237
higher carbon partitioning to plant biomass with increasing nutrient availability thus adds to our
238
understanding of the processes governing long-term carbon sequestration in forests and may have
239
far-reaching consequences for carbon cycle management. Further research is needed to verify
240
how the higher BPE in forests with high nutrient availability, together with the previously
241
reported decrease of soil organic matter decomposition in response to fertilization (Janssens et al.
242
2010) determines ecosystem carbon sequestration.
243 244
It remains unresolved whether the increased partitioning to biomass production relative to GPP
245
associated with higher nutrient availability is related to a lower Ra-to-GPP ratio or to a small
246
fraction of NPP going to typically unaccounted for components such as VOC production, root
247
symbionts, and root exudates in forests of high versus low nutrient availability. The present study
248
points in the direction of the latter (see also BOX 2). Future (large-scale) experiments in which
249
nutrient availability is manipulated and where all measurements needed to unravel carbon
250
partitioning are made (i.e., independent estimates for all NPP components, GPP and Ra) would
251
help resolve these questions.
252 253 254
11
Acknowledgements
255
We thank all site investigators, their funding agencies, the various regional flux networks
256
(Afriflux, AmeriFlux, AsiaFlux, CarboAfrica, CarboEurope-IP, ChinaFlux, Fluxnet-Canada,
257
KoFlux, LBA, NECC, OzFlux, TCOS-Siberia, USCCC), development of measurement and data
258
submission protocols (funded by Office of Science (BER), U.S. Dept of Energy), and the Fluxnet
259
project, whose work and support is essential for obtaining the measurements without which the
260
type of integrated analyses conducted in this study would not be possible. The authors
261
acknowledge Arie Weeren for statistical help and the FP7 GHG Europe project for financial
262
support. SV is a post-doctoral research associate of the Fund for Scientific Research - Flanders,
263
SL is funded by ERC Starting Grant 242564 and JP by grants Consolider Ingenio Montes
264 CSD2008-00040 and CGL2010-17172. 265 266 SUPPORTING INFORMATION 267
Additional Supporting Information may be found in the online version of this article:
268 269
Appendix S1: Detailed information about the data used
270
Appendix S2: Nutrient classification
271
Appendix S3: Additional discussion regarding uncertainties on fine root production estimates
272
Appendix S4: Detailed information about statistical analyses
273 274
As a service to our authors and readers, this journal provides supporting information supplied by
275
the authors. Such materials are peer-reviewed and may be re-organized for online delivery, but
276
are not copy-edited or typeset. Technical support issues arising from supporting information
277
(other than missing files) should be addressed to the authors.
12
279 280
References
281
Amthor, J.S. (2000). The McCree-de Wit-Penning de Vries-Thornley respiration paradigms: 30
282
years later. Ann. Bot., 86, 1-20.
283
Amthor, J.S. & Baldocchi, D.D. (2001). Terrestrial higher plant respiration and net primary
284
production. In: Terrestrial Global Productivity (eds. Roy J, Saugier B & Mooney HA). Academic
285
Press San Diego, pp. 33-59.
286
Atkin, O.K., Scheurwater, I. & Pons, T.L. (2007). Respiration as a percentage of daily
287
photosynthesis in whole plants is homeostatic at moderate, but not high, growth temperatures.
288
New Phytol., 174, 367-380.
289
Burton, A.J., Pregitzer, K.S., Ruess, R.W., Hendrik, R.L. & Allen, M.F. (2002). Root respiration
290
in North American forests: effects of nitrogen concentration and temperature across biomes.
291
Oecologia, 131, 559-568.
292
Campbell, C., Atkinson, L., Zaragoza-Castells, J., Lundmark, M., Atkin, O. & Hurry, V. (2007).
293
Acclimation of photosynthesis and respiration is asynchronous in response to changes in
294
temperature regardless of plant functional group. New Phytol., 176, 375-389.
295
Chapin, F.S. (1980). The mineral nutrition of wild plants. Annu. Rev. Ecol. Syst., 11, 233-260.
296
Courty, P.E., Buée, M., Diedhiou, A.G., Frey-Klett, P., Le Tacon, F., Rineau, F., et al. (2010).
297
The role of ectomycorrhizal communities in forest ecosystem processes: New perspectives and
298
emerging concepts. Soil Biol. Biochem., 42, 679-698.
299
DeLucia, E.H., Drake, J.E., Thomas, R.B. & Gonzalez-Meler, M. (2007). Forest carbon use
300
efficiency: is respiration a constant fraction of gross primary production? Global Change Biol.,
301
13, 1157-1167.
13
Dewar, R.C., Medlyn, B.E. & McMurtrie, R.E. (1998). A mechanistic analysis of light and
303
carbon use efficiencies. Plant Cell Environ., 21, 573-588.
304
Drake, J.E., Davis, S.C., Raetz, L.M. & DeLucia, E.H. (2011). Mechanisms of age-related
305
changes in forest production: the influence of physiological and successional changes. Global
306
Change Biol., 17, 1522-1535.
307
Enquist, B.J., Kerkhoff, A.J., Huxman, T.E. & Economo, E.P. (2007). Adaptive differences in
308
plant physiology and ecosystem paradoxes: insights from metabolic scaling theory. Global
309
Change Biol., 13, 591-609.
310
Gifford, R.M. (1994). The global carbon cycle: a viewpoint on the missing sink. Austr. J. Plant
311
Physiol., 21, 1-15.
312
Gifford, R.M. (1995). Whole plant respiration and photosynthesis of wheat under increased CO2 313
concentration and temperature: long-term vs. short-term distinctions for modelling. Global
314
Change Biol., 1, 385-396.
315
Goulden, M.L., McMillan, A.M.S., Winston, G.C., Rocha, A.V., Manies, K.L., Harden, J.W., et
316
al. (2011). Patterns of NPP, GPP, respiration, and NEP during boreal forest succession. Global
317
Change Biol., 17, 855-871.
318
Heinemeyer, A., Wilkinson, M., Vargas, R., Subke, J.A., Casella, E., Morison, J.I.L., et al.
319
(2012). Exploring the "overflow tap" theory: linking forest soil CO2 fluxes and individual 320
mycorrhizosphere components to photosynthesis. Biogeosci., 9, 79-95.
321
Hobbie, E.A. (2006). Carbon allocation to ectomycorrhizal fungi correlates with belowground
322
allocation in culture studies. Ecology, 87, 563-569.
323
Hoefnagel, M.H.N., Atkin, O.K. & Wiskich, J.T. (1998). Interdependence between chloroplasts
324
and mitochondria in the light and the dark. Biochim. Biophys. Acta, 1366, 235-255.
14
Högberg, M.N., Baath, E., Nordgren, A., Arnebrant, K. & Högberg, P. (2003). Contrasting
326
effects of nitrogen availability on plant carbon supply to mycorrhizal fungi and saprotrophs - a
327
hypothesis based on field observations in boreal forest. New Phytol., 160, 225-238.
328
Högberg, M.N., Briones, M.J.I., Keel, S.G., Metcalfe, D.B., Campbell, C., Midwood, A.J., et al.
329
(2010). Quantification of effects of season and nitrogen supply on tree below-ground carbon
330
transfer to ectomycorrhizal fungi and other soil organisms in a boreal pine forest. New Phytol.,
331
187, 485-493.
332
Janssens, I.A., Dieleman, W., Luyssaert, S., Subke, J.A., Reichstein, M., Ceulemans, R., et al.
333
(2010). Reduction of forest soil respiration in response to nitrogen deposition. Nature Geosci., 3,
334
315-322.
335
Krömer, S. (1995). Respiration during photosynthesis. Annu. Rev. Plant Physiol. Plant Mol.
336
Biol., 46, 45-70.
337
LeBauer, D.S. & Treseder, K.K. (2008). Nitrogen limitation of net primary productivity in
338
terrestrial ecosystems is globally distributed. Ecology, 89, 371-379.
339
Lilleskov, E.A., Fahey, T.J., Horton, T.R. & Lovett, G.M. (2002). Belowground ectomycorrhizal
340
fungal community change over a nitrogen deposition gradient in Alaska. Ecology, 83, 104-115.
341
Litton, C.M., Raich, J.W. & Ryan, M.G. (2007). Carbon allocation in forest ecosystems. Global
342
Change Biol., 13, 2089-2109.
343
Loveys, B.R., Atkinson, L.J., Sherlock, D.J., Roberts, R.L., Fitter, A.H. & Atkin, O.K. (2003).
344
Thermal acclimation of leaf and root respiration: an investigation comparing inherently fast- and
345
slow-growing plant species. Global Change Biol., 9, 895-910.
346
Luyssaert, S., Inglima, I., Jung, M., Richardson, A.D., Reichsteins, M., Papale, D., et al. (2007).
347
CO2 balance of boreal, temperate, and tropical forests derived from a global database. Global 348
Change Biol., 13, 2509-2537.
15
Piao, S., Luyssaert, S., Ciais, P., Janssens, I.A., Chen, A., Cao, C., et al. (2010). Forest annual
350
carbon cost: a global-scale analysis of autotrophic respiration. Ecology, 91, 652-661.
351
Read, D.J. & Perez-Moreno, J. (2003). Mycorrhizas and nutrient cycling in ecosystems - a
352
journey towards relevance? New Phytol., 157, 475-492.
353
Reich, P.B., Walters, M.B., Ellsworth, D.S., Vose, J.M., Volin, J.C., Gresham, C., et al. (1998).
354
Relationships of leaf dark respiration to leaf nitrogen, specific leaf area and leaf life-span: a test
355
across biomes and functional groups. Oecologia, 114, 471-482.
356
Ryan, M.G., Lavigne, M.B. & Gower, S.T. (1997). Annual carbon cost of autotrophic respiration
357
in boreal forest ecosystems in relation to species and climate. J. Geophys. Res., 102,
28871-358
28883.
359
Schulze, E.D. (2000). The carbon and nitrogen cycle in forest ecosystems. In: Carbon and
360
Nitrogen Cycling in European Forest Ecosystems (ed. Schulze ED). Springer, Berlin, p. 500.
361
Shan, J.P., Morris, L.A. & Hendrick, R.L. (2001). The effects of management on soil and plant
362
carbon sequestration in slash pine plantations. J. Appl. Ecol., 38, 932-941.
363
Treseder, K.K. (2004). A meta-analysis of mycorrhizal responses to nitrogen, phosphorus, and
364
atmospheric CO2 in field studies. New Phytol., 164, 347-355. 365
Turnbull, M.H., Tissue, D.T., Griffin, K.L., Richardson, S.J., Peltzer, D.A. & Whitehead, D.
366
(2005). Respiration characteristics in temperate rainforest tree species differ along a long-term
367
soil-development chronosequence. Oecologia, 143, 271-279.
368
Vadeboncoeur, M.A. (2010). Meta-analysis of fertilization experiments indicates multiple
369
limiting nutrients in northeastern deciduous forests. Can. J. For. Res., 40, 1766-1780.
370
van der Heijden, M.G.A., Bardgett, R.D. & van Straalen, N.M. (2008). The unseen majority: soil
371
microbes as drivers of plant diversity and productivity in terrestrial ecosystems. Ecol. Lett., 11,
372
296-310.
16
Van Oijen, M., Schapendonk, A. & Hoglind, M. (2010). On the relative magnitudes of
374
photosynthesis, respiration, growth and carbon storage in vegetation. Ann. Bot., 105, 793-797.
375
Wallenda, T. & Kottke, I. (1998). Nitrogen deposition and ectomycorrhizas. New Phytol., 139,
376
169-187.
377
Waring, R.H., Landsberg, J.J. & Williams, M. (1998). Net primary production of forests: a
378
constant fraction of gross primary production? Tree Physiol., 18, 129-134.
379 380
17
BOX 1: Autotrophic respiration-to-GPP ratio
381 382
The biomass production-to-photosynthesis ratio is typically used as a proxy for the ratio of net
383
primary production (NPP) to photosynthesis (GPP), termed carbon use efficiency (CUE) (e.g.
384
DeLucia et al. 2007). Alternatively, CUE can be determined using autotrophic respiration (Ra)
385
instead of biomass production, i.e., CUE=1-(Ra:GPP). Estimates of Ra (not derived from
386
biomass production measurements) are usually obtained by upscaling respiration measured on
387
parts of the vegetation (foliage, stem, branch) or by subtracting heterotrophic respiration from
388
eddy covariance-based estimates of ecosystem respiration (see e.g. Piao et al. (2010)). Estimates
389
of Ra (independent of biomass production) are less abundant than biomass production estimates,
390
which is the primary reason why we focus on the biomass production-to-GPP ratio and not on the
391
ratio of Ra to GPP. Nonetheless, we show the results of the 11 forests in our dataset that provided
392
estimates of Ra that were independent of GPP and biomass production (Fig. 3). The Ra-to-GPP
393
ratio did not significantly differ among nutrient availability classes (p=0.34 for ANOVA with
394
nutrient availability as fixed factor), but with only two nutrient-rich forests, it is premature to
395
draw meaningful conclusions.
396 397
Literature on respiration measurements at organ level (root, woody tissue, foliage) also provides
398
no definite answer because both increases and decreases in the Ra-to-GPP ratio with increasing
399
nutrient availability appear possible. Autotrophic respiration (Ra) is typically positively related to
400
tissue nitrogen concentrations (Chapin 1980). Because photosynthesis also increases with
401
increasing nitrogen concentration, the Ra-to-GPP ratio of leaves appears relatively constant
402
across species, climates and ecosystem types (Reich et al. 1998; Loveys et al. 2003; Turnbull et
403
al. 2005; Atkin et al. 2007; Campbell et al. 2007), although under extreme conditions this ratio
18
may increase (Atkin et al. 2007; Campbell et al. 2007) and potentially indicates an increase of
405
‘wastage’ respiration needed to discard excess energy and prevent cell damage (Amthor 2000). In
406
one study, the leaf respiration-to-photosynthesis ratio was higher in two forests suffering severe
407
nutrient limitations as compared to neighbouring less nutrient-stressed forests (Turnbull et al.
408
2005).
409 410
On the other hand, in forests with high nutrient availability, a larger fraction of photosynthates
411
typically is invested in wood compared to the fraction invested in wood in forests with low
412
nutrient availability (Litton et al. 2007). This was also the case for the forests in our dataset
413
(Table 1 and 2). Higher wood relative to foliage production may thus increase the Ra-to-GPP
414
ratio in forests of high nutrient availability compared to forests of low nutrient availability.
415
Further, several studies show a positive relation between root respiration per unit mass and root
416
nutrient concentrations (Chapin 1980; Burton et al. 2002), but this may be counterbalanced by a
417
decrease in standing root biomass as indicated by the negative fertilization effect on root
418
respiration found in a recent meta-analytical study (Janssens et al. 2010).
419 420
While the effects of nutrient availability on the ratio of Ra to GPP remain unclear, a decrease in
421
the Ra-to-GPP ratio for forests with high nutrient availability relative to forests of low nutrient
422
availability seems unlikely according to the theory that plants respire a relatively constant
423
fraction of GPP (Dewar et al. 1998; Van Oijen et al. 2010) due to interdependencies of
424
respiration and photosynthesis (Hoefnagel et al. 1998).
425
.
19
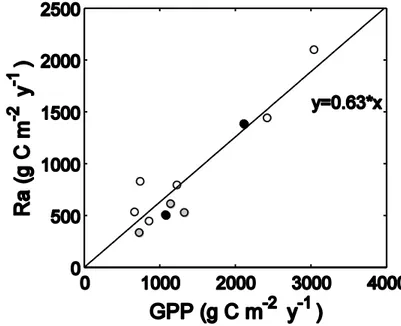
427
Figure 3: Field estimates of autotrophic respiration (Ra) versus gross primary production (GPP).
428
Each single data point represents one forest site and is the average value over all years for which
429
data were available in the database. White, gray and black circles indicate sites of low-, medium-
430
and high-nutrient availability, respectively. The equation refers to the linear fit through the data.
431
One nutrient-poor site with Ra:GPP>1 was removed. We found no statistically significant
432
nutrient-availability effect on Ra:GPP (p=0.34), but these results remain tentative due to the
433
small number of data points
20
BOX 2: Testing where the missing carbon is going
435 436
In this study, we identified a gap in the current knowledge of forest carbon allocation: forests
437
with high nutrient availability use 16±4% more of their photosynthates for biomass production
438
than forests with low nutrient availability (16±4% represents the difference between mean of 17
439
forests of high nutrient availability and mean of 19 forests of low nutrient availability; SE
440
calculated as SEdifference=sqrt(SE12 + SE22), with SE1 and SE2 the SE for low- and high nutrient
441
availability, respectively). This difference is, however, unlikely attributable to a difference in
442
carbon partitioning to autotrophic respiration. It therefore appears likely that forests of low
443
nutrient availability invest more photosynthates in non-biomass components of net primary
444
production (NPP), which usually are not quantified in experiments or reported in the literature
445
and therefore could not be taken into account in our analysis. These unaccounted for NPP
446
components include volatile organic compounds, root exudates, and root symbionts. We
447
hypothesize that carbon allocation to root symbionts in particular is a key factor explaining the
448
higher biomass production efficiency in nutrient-rich relative to nutrient-poor forests. First
449
support for this hypothesis is given in literature:
450 451
Symbiotic fungi are essential for the growth and health of forest trees (Courty et al. 2010), as
452
they transport nutrients from soil to tree (van der Heijden et al. 2008; Courty et al. 2010). Up to
453
80% of plant nitrogen and 75% of plant phosphorus can be fungal-derived in forests (van der
454
Heijden et al. 2008). In return for these nutrients, considerable amounts of carbon are transferred
455
from tree to fungus (van der Heijden et al. 2008; Courty et al. 2010). Recent reviews (Hobbie
456
2006; Courty et al. 2010), mostly based on controlled short-term studies, state that the overall
457
carbon flux to mycorrhizal fungi can constitute up to 30% of NPP (but observational estimates
21
remain scarce and highly variable; see Hobbie 2006 and Courty et al. 2010). Nonetheless, one
459
long-term field study in a nutrient-rich, temperate oak forest (Heinemeyer et al. 2012) where the
460
mycorrhizal soil carbon flux contribution was estimated at about 20% of NPP, confirms this
461
order of magnitude.
462 463
It has been shown repeatedly that carbon transfer to fungal symbionts are strongly inversely
464
related to nutrient availability (Wallenda & Kottke 1998; Lilleskov et al. 2002; Högberg et al.
465
2003; Read & Perez-Moreno 2003; Treseder 2004; Högberg et al. 2010), opening the door for a
466
substantial effect on the biomass production efficiency (BPE). According to a meta-analytical
467
review, mycorrhizal abundance declines substantially in response to nitrogen and phosphorus
468
fertilization (15% and 32%, respectively) (Treseder 2004). Similar responses were observed
469
along natural gradients in nutrient availability. Both biodiversity and proteolitic capabilities of
470
ectomycorrhizal fungi declined along a gradient of increasing mineral nitrogen availability
471
through Europe (Schulze 2000), phospholipid fatty acid attributed to mycorrhizal fungi
472
dramatically decreased along a natural soil nitrogen gradient in a boreal forest (Högberg et al.
473
2003), and both taxonomic richness and sporocarp abundance decreased over an anthropogenic
474
nitrogen deposition gradient in Alaska (Lilleskov et al. 2002).
475 476
Following this well-reported and strong relation between root symbionts and nutrient availability,
477
we hypothesize that forests with high nutrient availability produce more biomass per unit
478
photosynthesis than forests with low nutrient availability because the latter need to invest
479
relatively more photosynthates in root symbionts.
480 481
22
Tables
482
Table 1: Mean and standard deviation (in brackets) for gross primary production (GPP), total
483
biomass production (BP) and the biomass production-to-GPP ratio (BPE) in boreal, temperate
484
and tropical forests of different nutrient availability (low, medium and high). For statistics, see
485
Table 3. The number of forests per group is indicated in Figure 2A.
486 487
Climate zone, GPP BP BPE
488 nutrient availability (g C m-2 y-1) (g C m-2 y-1) 489 Boreal, low 911 (184) 355 (124) 0.39 (0.10) 490 Temperate, low 1320 (718) 565 (264) 0.43 (0.05) 491 Tropical, low 2985 (591) 1233 (315) 0.41 (0.11) 492 Boreal, medium 803 (204) 390 (112) 0.49 (0.10) 493 Temperate, medium 1328 (372) 659 (208) 0.50 (0.11) 494 Temperate, high 1724 (408) 1008 (354) 0.58 (0.13) 495 496 497
23
Table 2: Mean and standard deviation (in brackets) for the ratio of belowground to aboveground
498
biomass production (BBP:ABP), aboveground wood production (AWP), foliage production (FP),
499
root production (RP) and the ratio of aboveground wood production to gross primary production
500
(AWP:GPP) in boreal, temperate and tropical forests of different nutrient availability (low,
501
medium and high). For statistics, see Table 3. The number of forests per group are indicated in
502
superscript.
503 504
Climate zone, BBP:ABP AWP FP RP AWP:GPP
505 nutrient availability (g C m-2 y-1) (g C m-2 y-1) (g C m-2 y-1) 506 Boreal, low 0.65 (0.29)5 100 (46)5 61 (24)5 125 (65)5 0.11 (0.02)5 507 Temperate, low 0.66 (0.31)6 166 (80)6 153 (98)6 205 (97)6 0.13 (0.03)6 508 Tropical, low 0.28 (0.09)5 348 (85)5 404 (151)5 282 (47)5 0.11 (0.03)5 509 Boreal, medium 0.45 (0.27)5 116 (32)5 72 (36)5 117 (68)5 0.15 (0.03)5 510 Temperate, medium 0.88 (0.90)7 212 (129)6 149 (97)7 238 (122)7 0.14 (0.07)6 511 Temperate, high 0.33 (0.17)17 493 (335)16 184 (50)16 218 (88)17 0.27 (0.14)16 512 513 514
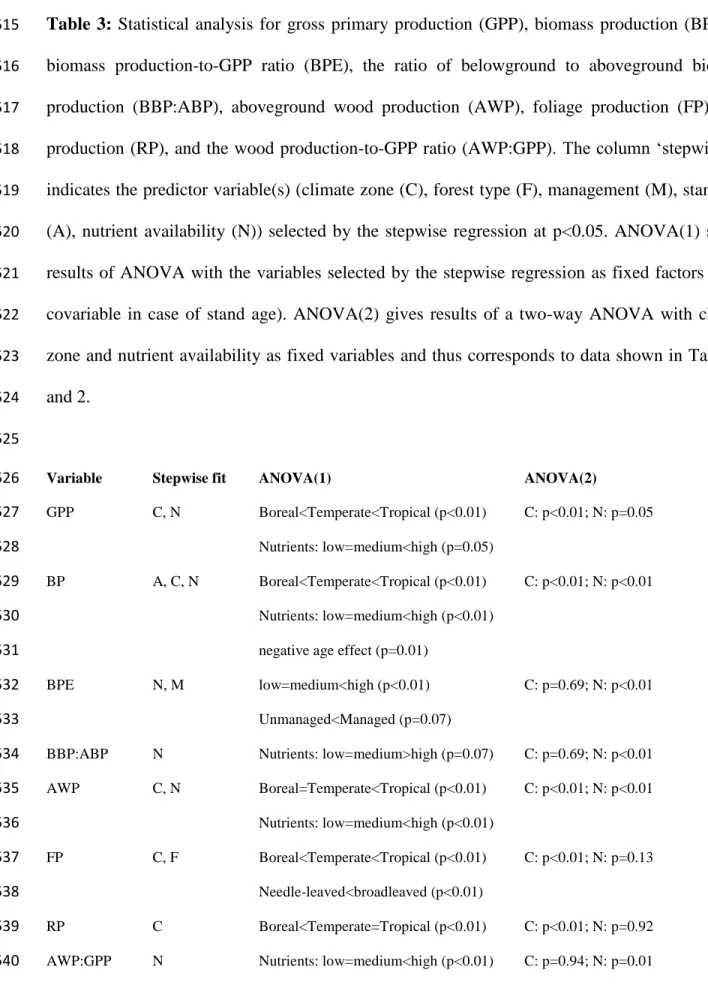
24
Table 3: Statistical analysis for gross primary production (GPP), biomass production (BP), the
515
biomass production-to-GPP ratio (BPE), the ratio of belowground to aboveground biomass
516
production (BBP:ABP), aboveground wood production (AWP), foliage production (FP), root
517
production (RP), and the wood production-to-GPP ratio (AWP:GPP). The column ‘stepwise fit’
518
indicates the predictor variable(s) (climate zone (C), forest type (F), management (M), stand age
519
(A), nutrient availability (N)) selected by the stepwise regression at p<0.05. ANOVA(1) shows
520
results of ANOVA with the variables selected by the stepwise regression as fixed factors (or as
521
covariable in case of stand age). ANOVA(2) gives results of a two-way ANOVA with climate
522
zone and nutrient availability as fixed variables and thus corresponds to data shown in Tables 1
523
and 2.
524 525
Variable Stepwise fit ANOVA(1) ANOVA(2)
526 GPP C, N Boreal<Temperate<Tropical (p<0.01) C: p<0.01; N: p=0.05 527 Nutrients: low=medium<high (p=0.05) 528 BP A, C, N Boreal<Temperate<Tropical (p<0.01) C: p<0.01; N: p<0.01 529 Nutrients: low=medium<high (p<0.01) 530
negative age effect (p=0.01)
531
BPE N, M low=medium<high (p<0.01) C: p=0.69; N: p<0.01
532
Unmanaged<Managed (p=0.07)
533
BBP:ABP N Nutrients: low=medium>high (p=0.07) C: p=0.69; N: p<0.01
534 AWP C, N Boreal=Temperate<Tropical (p<0.01) C: p<0.01; N: p<0.01 535 Nutrients: low=medium<high (p<0.01) 536 FP C, F Boreal<Temperate<Tropical (p<0.01) C: p<0.01; N: p=0.13 537 Needle-leaved<broadleaved (p<0.01) 538 RP C Boreal<Temperate=Tropical (p<0.01) C: p<0.01; N: p=0.92 539
AWP:GPP N Nutrients: low=medium<high (p<0.01) C: p=0.94; N: p=0.01
25
Figures
541
Figure 1: Each circle represents the mean annual total biomass production±SE versus mean
542
annual gross primary production (GPP±SE) for one forest. Colours indicate nutrient availability
543
classes, error bars reflect uncertainties (see Appendix S1). Dotted, dashed and solid lines are
544
linear fits (y=ax) for the low-, medium- and high nutrient availability class, respectively
545
(R²=0.84, R²=0.66, R²=0.56, respectively; p<0.01 for low- versus high nutrient availability (GLM
546
analysis)). The squares on the right represent the mean biomass production efficiency (BPE:
547
biomass production-to-GPP ratio). Error bars on these squares are standard errors on the means,
548
reflecting measurement uncertainties and inter-annual variability in case of multi-year data.
549
Letters next to the squares indicate significant differences at p<0.05 (Tukey post-hoc test;
550
ANOVA with nutrient availability as fixed factor).
551
552 553
26
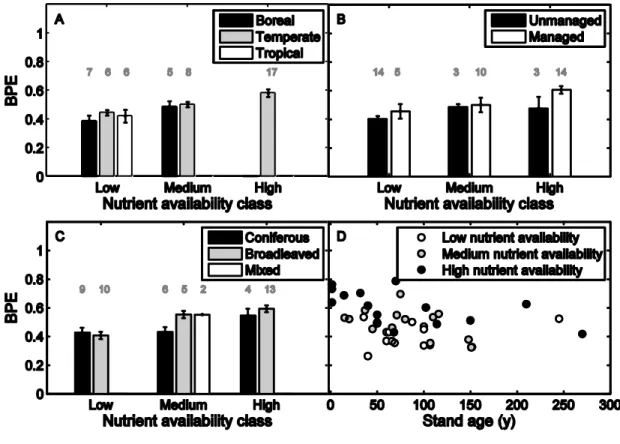
Figure 2: Mean biomass production efficiency (BPE) versus nutrient availability class for (A)
554
different climate zones, (B) management practices, (C) forest types and (D) BPE versus stand age
555
for the three nutrient availability classes. Error bars represent the standard error on the mean and
556
numbers indicate the number of forests per group. Stepwise regression analysis revealed a
557
significant effect of nutrient availability (p<0.01) and forest management (p=0.02). Climate zone,
558
forest type and stand age were not statistically significant (p>0.1). Note that for six forests no
559
estimate for stand age was available and these sites were thus omitted from this analysis.
560
Removing stand age from the regression model, which allows inclusion of these six sites, did not
561
alter the outcome (data not shown).
562 563
564 565 566