HAL Id: hal-02167650
https://hal.archives-ouvertes.fr/hal-02167650
Submitted on 28 Jun 2019
HAL is a multi-disciplinary open access
archive for the deposit and dissemination of sci-entific research documents, whether they are pub-lished or not. The documents may come from teaching and research institutions in France or abroad, or from public or private research centers.
L’archive ouverte pluridisciplinaire HAL, est destinée au dépôt et à la diffusion de documents scientifiques de niveau recherche, publiés ou non, émanant des établissements d’enseignement et de recherche français ou étrangers, des laboratoires publics ou privés.
Vibronic structure of the cyanobutadiyne cation: I-VUV
photoionization study of HC 5 N
Bérenger Gans, Nicolas Lamarre, Jean-Claude Guillemin, Stephane Douin,
Christian Alcaraz, Claire Romanzin, Gustavo Garcia, Jacques Liévin, Séverine
Boyé-Péronne
To cite this version:
Bérenger Gans, Nicolas Lamarre, Jean-Claude Guillemin, Stephane Douin, Christian Alcaraz, et al.. Vibronic structure of the cyanobutadiyne cation: I-VUV photoionization study of HC 5 N. Journal of Chemical Physics, American Institute of Physics, 2019, 150 (24), pp.244304. �10.1063/1.5097688�. �hal-02167650�
Vibronic structure of the cyanobutadiyne cation: I- VUV photoionization study of HC5N
B´erenger Gans,1 Nicolas Lamarre,1 Jean-Claude Guillemin,2 St´ephane Douin,1 Christian Alcaraz,3 Claire Romanzin,3 Gustavo A. Garcia,4 Jacques Li´evin,5 and S´everine
Boy´e-P´eronne1, a)
1)Institut des Sciences Mol´eculaires d’Orsay (ISMO), CNRS UMR 8214,
Univ. Paris-Sud, Universit´e Paris-Saclay, F-91405 Orsay, France
2)Univ Rennes, Ecole Nationale Sup´erieure de Chimie de Rennes, CNRS,
ISCR - UMR6226, F-35000 Rennes, France
3)Laboratoire de Chimie-Physique, CNRS UMR 8000, Univ. Paris-Sud,
Universit´e Paris-Saclay, F-91405 Orsay, France
4)Synchrotron SOLEIL, L’Orme des Merisiers, BP 48, Saint Aubin,
F-91192 Gif-sur-Yvette, France.
5)Service de Chimie Quantique et Photophysique, Universit´e Libre de Bruxelles,
CP 160/09, B-1050 Bruxelles, Belgium
We report the vacuum-ultraviolet threshold-photoelectron spectrum of HC5N
recorded over a wide spectral range, from 84 000 to 120 000 cm−1, with a 120 cm−1 spectral resolution, better than what was achieved in previous photoelectron studies, and with mass selectivity. The adiabatic ionization potential of cyanobutadiyne is measured at 85 366 (± 40) cm−1. Assignment of the vibrational bands of the four lowest electronic states X+ 2Π, A+ 2Π, B+ 2Σ+ and C+ 2Π are performed, supported
by high level ab initio calculations which are fully detailed in a companion paper (Gans et al., JCP XX XX (2019)), and by Franck-Condon simulations. Only vi-brational stretching modes are observed in the threshold-photoelectron spectra. The ground state of HC5N+ exhibits a vibrational progression in the ν2 stretching mode
involving mainly the elongation of the C≡C triple bonds whereas the A+ and C+
excited electronic states show a progression in the stretching mode mainly associated with the elongation of the C≡N bond, i.e. ν4 and ν3, respectively. The B+ state
appears almost as a vibrationless structure in close vicinity to the A+ state.
I. INTRODUCTION
Cyanobutadiyne, H-C≡C-C≡C-C≡N, is a member of the cyanopolyyne family, exhibit-ing an extended π-conjugated system. Thanks to its strong rotational lines detected by radioastronomy, this compound has been found in numerous extra-terrestrial environments, including molecular clouds1,2, circumstellar envelopes3,4, and comets5. Models or simulation experiments6,7 have predicted it to be present in Titan’s atmosphere, but so far it has not
been observed there. This compound can be ionized by a vacuum-ultraviolet (VUV) radi-ation field or by electron impact, and the resulting cradi-ation can play a role in the gas phase chemical evolution of these media.
Spectroscopic studies on HC5N are relatively scarce since only small amounts of a pure
compound can be produced by chemical synthesis.8 So far, absorption experiments in cell or matrix environments have been performed in the infrared,9 mid-UV,10 and VUV11 spectral
ranges allowing the collection of vibrational band intensities and absorption cross sections. Raman scattering spectra at low temperature have led to the identification of all the vi-brational fundamental modes.12 Concerning the cationic species, the He(I) PhotoElectron
Spectrum (PES) at 21.22 eV was measured in 1980 by Bieri and co-workers13 with a re-solving power of 250 (spectral resolution of 350-450 cm−1 in the explored range). This work led to identification of the four lowest electronic states of the cation and the deter-mination of the corresponding adiabatic ionization energies with an uncertainty of 20 meV (160 cm−1). A few vibrational frequencies have been derived for the two lowest electronic states (X+ 2Π and A+ 2Π), but no complete assignment has been performed. Emission spec-troscopy experiments were carried out in the same work,13using a low energy electron beam
to ionize and electronically excite the HC5N+ cations. Observation of the A+ 2Π→ X+ 2Π
gas phase visible emission spectrum allowed the determination of the A+ 2Π state radiative lifetime and measurement of the vibrational wavenumbers for four stretching modes (ν2,
ν3, ν5, and ν6) of the cation ground state with an uncertainty of ± 10 cm−1. Sinclair et
al. used frequency modulation absorption spectroscopy to record the 00
0 band of the A+→
X+ transition with rotational resolution.14 In their experiment the ions were generated in a
cooled hollow cathode modulated discharge coupled to a White absorption cell to increase the optical path. Molecular parameters (rotational and spin-orbit coupling constants) were
derived from this absorption spectrum for the X+ and A+ states.
As for the theoretical studies dedicated to the cation, Lee15 predicted via DFT calcula-tions the linear structure, the vibrational frequencies, the dipole moment and the rotational constant of the ground state of HC5N+. Stimulated by matrix isolation spectroscopy
experi-ments performed by Forney et al.16and Smith et al.17, Cao and Peyerimhoff18calculated the vertical transition energies and oscillator strengths for the doublet system of linear HC5N+
(starting from the cation ground state) by ab initio approaches. As a result, seven doublet states are expected to lie within 6.2 eV (c.a. 50 000 cm−1) above the cation ground state energy.
In the present work, an experimental photoionization study from neutral cyanobutadiyne has been performed and the Threshold Photo-Electron Spectrum (TPES) of HC5N has been
recorded between 84 000 and 120 000 cm−1. To support the assignments of the vibronic structures observed in the TPES, a thorough theoretical work has been carried out in order to explore the complicated energy landscape in the region above the ground state of the cation. High level ab initio calculations have been conducted, some of them falling beyond the scope of the present experimental study. This complete study is thus presented in a separate paper, to be referred to as Paper II.19In the present paper, only the pertinent results
of the calculations enabling the understanding of the TPES are reported. The experimental and computational methods are first briefly explained. The vibronic structure of the TPES is then analyzed and discussed in light of the ab initio calculations. We would like to point out that as both papers are self-contained, they can be read in any order. We thus encourage the reader to start reading Paper II first, if he prefers to have in mind all theoretical details before discovering the experimental context.
II. METHODS
A. Experimental details
The experiment was carried out at the SOLEIL synchrotron facility operating in the multibunch mode with the double imaging photoion-photoelectron coincidence
spectrome-ter DELICIOUS III20 coupled to the SAPHIRS chamber installed on the monochromatized
branch of DESIRS VUV beamline.21 HC
5N was synthesized prior to the experimental
cam-paign according to the chemical procedure developed by Trolez and Guillemin in 20058 and
was stored at −80◦C. Manipulation of the pure HC5N sample was performed at a controlled
temperature of −12◦C by means of a chiller. The vapour pressure (Pvap = 4.6 mbar at
−12◦C) was introduced into the SAPHIRS vacuum experimental chamber via an effusive
jet allowing for a moderate consumption of product (c.a. 2 mg per hour) compatible with the small amounts available, and allowing the continuous recording of energy scans lasting several hours.
The molecules were ionized by the VUV synchrotron radiation from DESIRS, which was set to provide energy resolution between 0.72 and 0.22 ˚A. Removal of the high harmonics from the undulator was achieved using a gas filter filled with Argon. The VUV flux was monitored by a VUV photodiode (AXUV, IRD) and was used to normalize all of the spectra. The absorption lines of Argon observed as dips in the ion yield allowed for absolute spectral calibration with an accuracy of 20 cm−1. Ions and electrons were detected in coincidence by Wiley-MacLaren and velocity map imaging devices to record two types of spectra: Threshold PhotoElectron (TPE) spectra and HC5N+ ion yield spectra. Since no fragmentation occurs
in the present energy range, all spectra are given for the parent mass only, i.e. m/z = 75. TPE spectra were recorded between 84 000 and 120 000 cm−1 with 40 cm−1 steps, with an extraction field E of 88 V/cm, which is a compromise between resolution and maximum kinetic energy of the detected electrons (i.e. 3.7 eV kinetic energy). In these conditions, the overall energy resolution of the TPE spectra is 15 meV (120 cm−1). The ionization threshold values extracted from the TPES were corrected from the estimated Stark-induced shift (6 ×√E = 56 cm−1).
For the HC5N+ total ion yield spectrum, all electrons must be detected within the
ex-plored spectral range due to the coincidence scheme. Therefore for the above conditions, the upper energy limit for full ion detection is 110 000 cm−1. For the total ion yield, the energy resolution is given by the photon energy resolution, which was set to 0.72 ˚A and 0.22 ˚A for photon energies below or above 12.5 eV (i.e. 101 000 cm−1). An additional scan with an extraction field of 264 V/cm (yielding an electron bandwidth of 10.8 eV, and therefore an energy range for full transmission of up to hν = IEadia + 10.8 eV) was also performed to
scan was performed with a larger energy step (c.a. 807 cm−1). Note that for this scan, the energy resolution corresponds to ∼ 30 cm−1, much smaller than the energy steps of the scan, but detector saturation prevented us from degrading the resolution due to the consequent gain in photon flux.
B. Computational details
All calculations were performed with the MOLPRO program package22,23 running on the HYDRA and VEGA clusters of the ULB/VUB computer center in Brussels (Belgium). The accurate Internally Contracted MultiReference Configuration Interaction (ic-MRCI) method24,25 has been used with molecular orbitals (MOs) optimized for the multirefer-ence wavefunction by a State Averaged Complete Active Space Self-Consistent Field (SA-CASSCF) calculation.26,27 The Davidson correction has been applied to all energies, leading
to a level of theory denoted by the ic-MRCI+Q acronym. Geometry optimizations were carried out at the latter level of theory using the Dunning’s aug-cc-pVTZ basis set (AVTZ for short)28,29 on the potential energy surfaces corresponding to all states investigated in the study. Linear geometry was found for all states. Harmonic frequency calculations were determined at the same level of theory for the four lowest electronic states of the cation, i.e. X+ 2Π, A+ 2Π , B+ 2Σ+, and C+ 2Π. Let us note that our ab initio calculations predict the existence of two minima on the third potential energy surface of 2Π symmetry. They
are referred to as 3 2Π(Min1) and 3 2Π(Min2) in Paper II, where it is demonstrated that
the photoionization process only populates one of them, Min2, which is thus assigned to the
observed C+ state. This assignment is fully confirmed by the good agreement obtained with
our TPES results. Vertical and adiabatic ionization and transitions energies were calculated using a Complete Basis Set (CBS) extrapolation procedure, detailed in Paper II.19 These
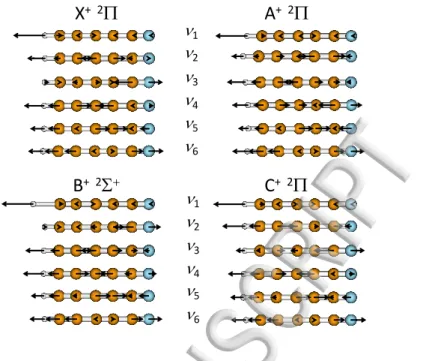
energies were also corrected to take the zero-point energy (ZPE) contributions into account. Figure 1 illustrates the atomic displacements of the stretching modes (ν1 to ν6) for the
four lowest electronic states of the HC5N+ cation. Only the stretching modes are presented
here since it will be shown that they are the only ones observed in our experiments. A similar figure for the bending modes is available in Paper II.19 As shown in Figure 1, the ν1 mode is
n1 n2 n3 n4 n5 n6
X
+ 2P
defaults used single point MO LD EN LD MO EN LD MO ENENENENENENENENENENENENENENENENENEN LDLDLDLDLDLDLDLDLDLDLDLDLDLDLDLDLD MOMO MOMO MOMOMO MOMOMO MOMO MOMOMO MOMOA
+ 2P
B
+ 2S
+C
+ 2P
n1 n2 n3 n4 n5 n6 defaults used single point MO LD ENENENENENENENENENENENENENENENENENENENEN LDLDLDLDLDLDLDLDLDLDLDLDLDLDLDLDLDLDLD MOMOMOMOMOMOMOMOMOMOMOMOMOMOMOMOMOMOMO defaults used single point MO LD EN LD MO ENENENENENENENENENENENENENENENENENENEN LDLDLDLDLDLDLDLDLDLDLDLDLDLDLDLDLDLD MOMOMO MOMO MOMOMO MOMO MOMO MOMOMO MOMO MO defaults used single point MO LD EN LD MO ENENENENENENENENENENENENENENENENENENEN LDLDLDLDLDLDLDLDLDLDLDLDLDLDLDLDLDLD MOMOMOMOMOMOMOMOMOMOMOMOMOMOMOMOMOMO defaults used single point MO LD EN LD MO ENENENENENENENENENENENENENENENENENENEN LDLDLDLDLDLDLDLDLDLDLDLDLDLDLDLDLDLD MO MOMOMO MOMO MOMOMO MOMO MOMOMO MOMO MOMO defaults used single point MO LD EN LD MO EN LD MO ENENENENENENENENENENENENENENENENENEN LDLDLDLDLDLDLDLDLDLDLDLDLDLDLDLDLD MOMOMOMOMOMOMOMOMOMOMOMOMOMOMOMOMO defaults used single point MO LD ENENENENENENENENENENENENENENENENENENENEN LDLDLDLDLDLDLDLDLDLDLDLDLDLDLDLDLDLDLD MOMOMO MOMO MOMOMO MOMO MOMOMO MOMOMO MOMO MO defaults used single point MO LD ENENENENENENENENENENENENENENENENENENENEN LDLDLDLDLDLDLDLDLDLDLDLDLDLDLDLDLDLDLD MOMOMO MOMO MOMOMO MOMO MOMOMO MOMO MOMOMO MO defaults used single point MO LD ENENENENENENENENENENENENENENENENENENENEN LDLDLDLDLDLDLDLDLDLDLDLDLDLDLDLDLDLDLD MOMOMOMOMOMOMOMOMOMOMOMOMOMOMOMOMOMOMO defaults used single point MO LD ENENENENENENENENENENENENENENENENENENENEN LDLDLDLDLDLDLDLDLDLDLDLDLDLDLDLDLDLDLD MOMOMO MOMO MOMOMO MOMOMO MOMO MOMOMO MOMO MO defaults used single point MO LD EN LD MO ENENENENENENENENENENENENENENENENENENEN LDLDLDLDLDLDLDLDLDLDLDLDLDLDLDLDLDLD MOMOMO MOMOMO MOMO MOMOMO MOMOMO MOMO MOMO defaults used single point MO LD ENENENENENENENENENENENENENENENENENENENEN LDLDLDLDLDLDLDLDLDLDLDLDLDLDLDLDLDLDLD MO MOMO MOMOMO MOMO MOMOMO MOMOMO MOMO MOMOMO defaults used single point MO LD EN LD MO ENENENENENENENENENENENENENENENENENENEN LDLDLDLDLDLDLDLDLDLDLDLDLDLDLDLDLDLD MO MOMO MOMOMO MOMO MOMOMO MOMO MOMOMO MOMO defaults used single point MO LD EN LD MO ENENENENENENENENENENENENENENENENENENENLDLDLDLDLDLDLDLDLDLDLDLDLDLDLDLDLDLD MOMOMOMOMOMOMOMOMOMOMOMOMOMOMOMOMOMO defaults used single point MO LD EN LD MO ENENENENENENENENENENENENENENENENENENEN LDLDLDLDLDLDLDLDLDLDLDLDLDLDLDLDLDLD MOMO MOMOMO MOMOMO MOMO MOMOMO MOMO MOMOMO defaults used single point MO LD EN LD MO ENENENENENENENENENENENENENENENENENENEN LDLDLDLDLDLDLDLDLDLDLDLDLDLDLDLDLDLD MOMO MOMOMO MOMO MOMOMO MOMO MOMOMO MOMO MO defaults used single point MO LD EN LD MO ENENENENENENENENENENENENENENENENENENEN LDLDLDLDLDLDLDLDLDLDLDLDLDLDLDLDLDLD MOMOMO MOMO MOMOMO MOMOMO MOMO MOMOMO MOMO defaults used single point MO LD ENENENENENENENENENENENENENENENENENENENEN LDLDLDLDLDLDLDLDLDLDLDLDLDLDLDLDLDLDLD MO MOMOMO MOMO MOMOMO MOMO MOMOMO MOMOMO MOMO defaults used single point MO LD EN LD MO ENENENENENENENENENENENENENENENENENENEN LDLDLDLDLDLDLDLDLDLDLDLDLDLDLDLDLDLD MOMOMOMOMOMOMOMOMOMOMOMOMOMOMOMOMOMO defaults used single point MO LD EN LD MO ENENENENENENENENENENENENENENENENENENEN LDLDLDLDLDLDLDLDLDLDLDLDLDLDLDLDLDLD MOMO MOMOMO MOMO MOMOMO MOMO MOMOMO MOMOMO defaults used single point MO LD EN LD MO ENENENENENENENENENENENENENENENENENENEN LDLDLDLDLDLDLDLDLDLDLDLDLDLDLDLDLDLD MO MOMO MOMO MOMOMO MOMO MOMOMO MOMO MOMOMO defaults used single point MO LD EN LD MO EN LD MO ENENENENENENENENENENENENENENENENENEN LDLDLDLDLDLDLDLDLDLDLDLDLDLDLDLDLD MO MOMOMO MOMOMO MOMO MOMOMO MOMOMO MOMO defaults used single point MO LD ENENENENENENENENENENENENENENENENENENENEN LDLDLDLDLDLDLDLDLDLDLDLDLDLDLDLDLDLDLD MO MOMO MOMOMO MOMO MOMOMO MOMO MOMOMO MOMOMO defaults used single point MO LD EN LD MO ENENENENENENENENENENENENENENENENENENEN LDLDLDLDLDLDLDLDLDLDLDLDLDLDLDLDLDLD MO MOMO MOMOMO MOMO MOMOMO MOMO MOMOMO MOMOFIG. 1. Illustration of the atomic displacements for each vibrational stretching mode of the X+,
A+, B+, and C+ electronic states of HC5N+ cation. The N atom appears in blue color.
Mass-weighted normal coordinates have been calculated at the ic-MRCI+Q/AVTZ level of theory. The corresponding frequencies are reported in Table II. Atomic displacements are scaled by a factor of 0.3 for the CH-stretching modes and by a factor of 0.8 for the other modes.
ν4 modes describe the elongation and contraction of the CC and CN bonds, with different
combinations depending on the electronic state. It is interesting to note for instance that the local C≡N stretch is dominantly described by the ν2 mode in the B+ state, by the ν3
mode for the X+and C+ states, and by the ν
4 mode for the A+ state. This is consistent with
a decrease of the C≡N bond strength along the B+ → X+/C+ → A+ series, as indicated
by the decrease of the C≡N stretching frequency (from 2339 to 1999 cm−1) accompanied by an increase of the bond length (from 1.151 to 1.202 ˚A, see Table II of Paper II19). The
frequencies of the normal modes involving the CN stretching vibration consequently shift down below those of C≡C triple bonds, thus explaining the mode numbering changes.
In addition, the ν5 and ν6 modes are mostly assigned to the stretching motion of the two
III. RESULTS AND DISCUSSION
A. TPE spectrum and HC5N+ ion yield
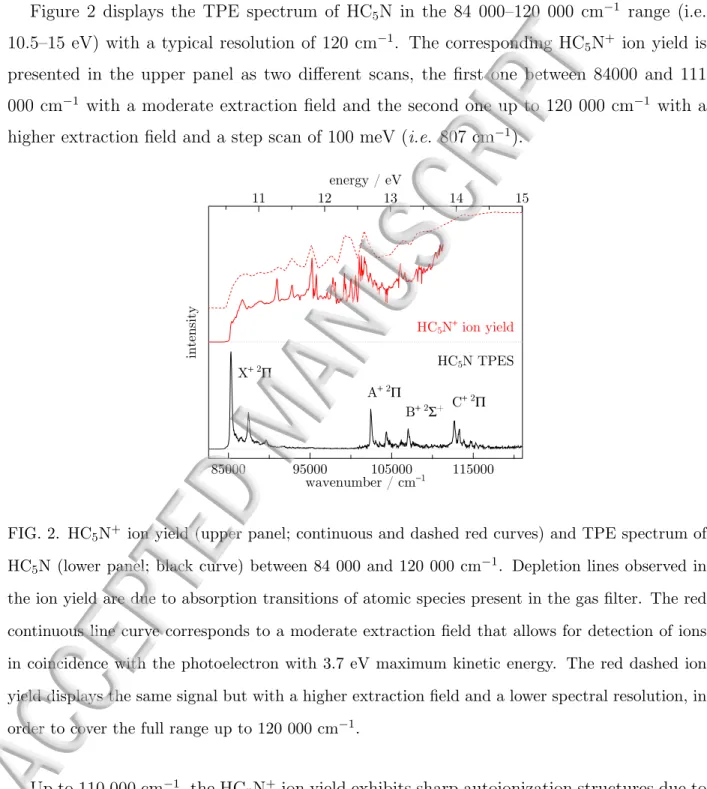
Figure 2 displays the TPE spectrum of HC5N in the 84 000–120 000 cm−1 range (i.e.
10.5–15 eV) with a typical resolution of 120 cm−1. The corresponding HC5N+ ion yield is
presented in the upper panel as two different scans, the first one between 84000 and 111 000 cm−1 with a moderate extraction field and the second one up to 120 000 cm−1 with a higher extraction field and a step scan of 100 meV (i.e. 807 cm−1).
85000 95000 105000 115000 11 12 13 14 15 wavenumber / cm−1 energy / eV intensity HC5N+ ion yield HC5N TPES X+ 2Π A+ 2Π B+ 2Σ+ C+ 2Π
FIG. 2. HC5N+ ion yield (upper panel; continuous and dashed red curves) and TPE spectrum of
HC5N (lower panel; black curve) between 84 000 and 120 000 cm−1. Depletion lines observed in
the ion yield are due to absorption transitions of atomic species present in the gas filter. The red continuous line curve corresponds to a moderate extraction field that allows for detection of ions in coincidence with the photoelectron with 3.7 eV maximum kinetic energy. The red dashed ion yield displays the same signal but with a higher extraction field and a lower spectral resolution, in
order to cover the full range up to 120 000 cm−1.
Up to 110 000 cm−1, the HC5N+ ion yield exhibits sharp autoionization structures due to
Rydberg states converging to excited vibronic states of HC5N+. Above this energy, the ion
yield is structureless. Note that in this region the HC5N+ ion yield corresponds to the total
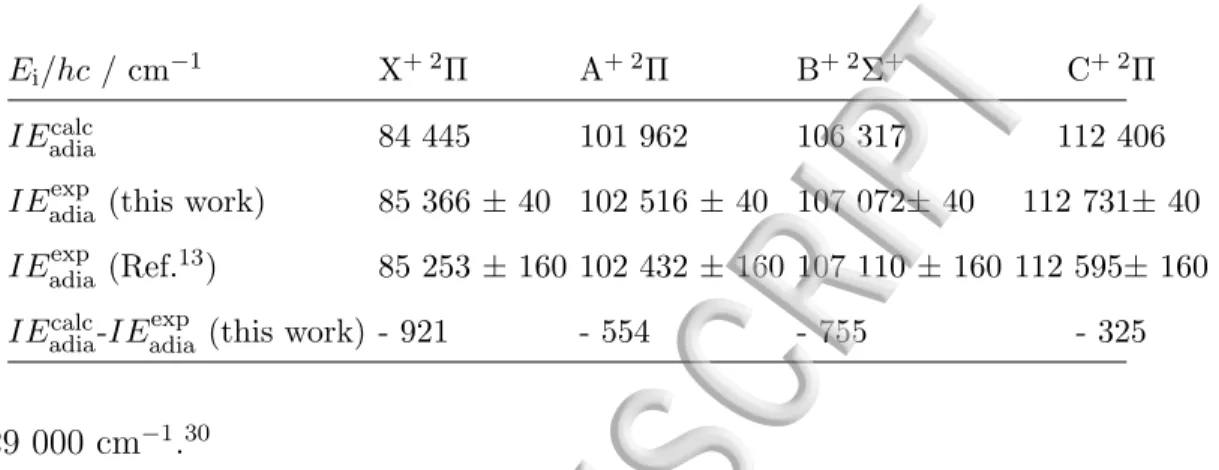
TABLE I. Experimental adiabatic ionization energies of HC5N toward the four lowest electronic states of the cation measured in the present work, and comparison with the theoretical values
calculated in Paper II19 at the CBS limit and corrected for the ZPE. All values are given in cm−1.
Ei/hc / cm−1 X+ 2Π A+ 2Π B+ 2Σ+ C+ 2Π
IEadiacalc 84 445 101 962 106 317 112 406
IEadiaexp (this work) 85 366 ± 40 102 516 ± 40 107 072± 40 112 731± 40
IEadiaexp (Ref.13) 85 253 ± 160 102 432 ± 160 107 110 ± 160 112 595± 160
IEadiacalc-IEexpadia (this work) - 921 - 554 - 755 - 325
above 129 000 cm−1.30
In the TPE spectrum, four distinct electronic states are observed, as already pointed out by Bieri et al.13. The experimental adiabatic ionization energies from the neutral ground
state to these ionic states can be determined from the energy of the main intense structure for each region. Indeed, even though the excitation process is vertical, starting from the neutral ground state geometry, the equilibrium geometry of the cationic states does not change significantly (see Table II of Paper II19) and the first peak of the TPES for each
electronic state, corresponding to the 00
0 band, is the most intense. To good
approxima-tion, the energy of the origin band (000) can thus be associated with the adiabatic value, neglecting the rotational structure. These results are reported in Table I and they are compared with the adiabatic energies IEadia previously measured by Bieri and co-workers,13
as well as with the values calculated in the present work and presented in Table IV of Paper II.19 Our experimental values lie within the 160 cm−1 (i.e. 20 meV) uncertainty of
Bieri et al.13They agree well with the calculated values of Paper II within ' 500−1000 cm−1.
B. Vibrational structures observed in the TPE spectrum
The higher resolution used in the present experiment as compared to Bieri et al.13 (120
cm−1 vs 350-450 cm−1) allowed some of the vibronic features of the TPE spectrum to be resolved. In HC5N and its cation, the ν2, ν3, and ν4 stretching modes are very close
wavenumber values in Ref. 9 for the neutral and in Table II for the cation). The assignment of vibronic transitions involving these modes is thus ambiguous as mentioned by Bieri et al.13 To facilitate the identification, we have calculated by means of the Pgopher software31
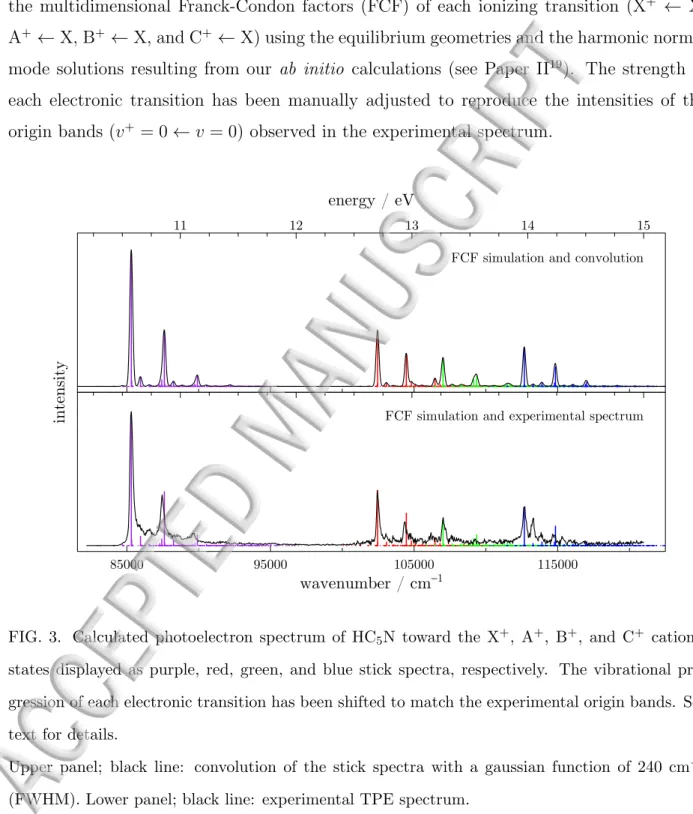
the multidimensional Franck-Condon factors (FCF) of each ionizing transition (X+ ← X, A+ ← X, B+ ← X, and C+ ← X) using the equilibrium geometries and the harmonic normal
mode solutions resulting from our ab initio calculations (see Paper II19). The strength of
each electronic transition has been manually adjusted to reproduce the intensities of the origin bands (v+= 0 ← v = 0) observed in the experimental spectrum.
11 12 13 14 15
FCF simulation and convolution
energy / eV
85000 95000 105000 115000
wavenumber / cm−1
intensity
FCF simulation and experimental spectrum
FIG. 3. Calculated photoelectron spectrum of HC5N toward the X+, A+, B+, and C+ cationic
states displayed as purple, red, green, and blue stick spectra, respectively. The vibrational pro-gression of each electronic transition has been shifted to match the experimental origin bands. See text for details.
Upper panel; black line: convolution of the stick spectra with a gaussian function of 240 cm−1
(FWHM). Lower panel; black line: experimental TPE spectrum.
Only the stretching modes were considered since the linear geometry of cyanobutadiyne is conserved upon ionization and the calculated bending frequencies do not change
sig-nificantly from the neutral ground state to the cationic excited states (see Table II and Paper II19). Hence the transitions involving bending mode excitations are expected to be
unobservable. The complete FCF simulation of the TPE spectrum is displayed in Figure 3. The corresponding convoluted spectrum is shown in black in the upper panel. In the lower panel, the same stick spectrum is compared with the experimental TPE spectrum. It is clear that the vibrational structures of each ionizing transition are well reproduced and the agreement between the calculated and experimental spectra is quite good. From this comparison, it is straightforward to conclude that the vibrational structures of the observed ionizing transitions can be ascribed to the stretching modes.
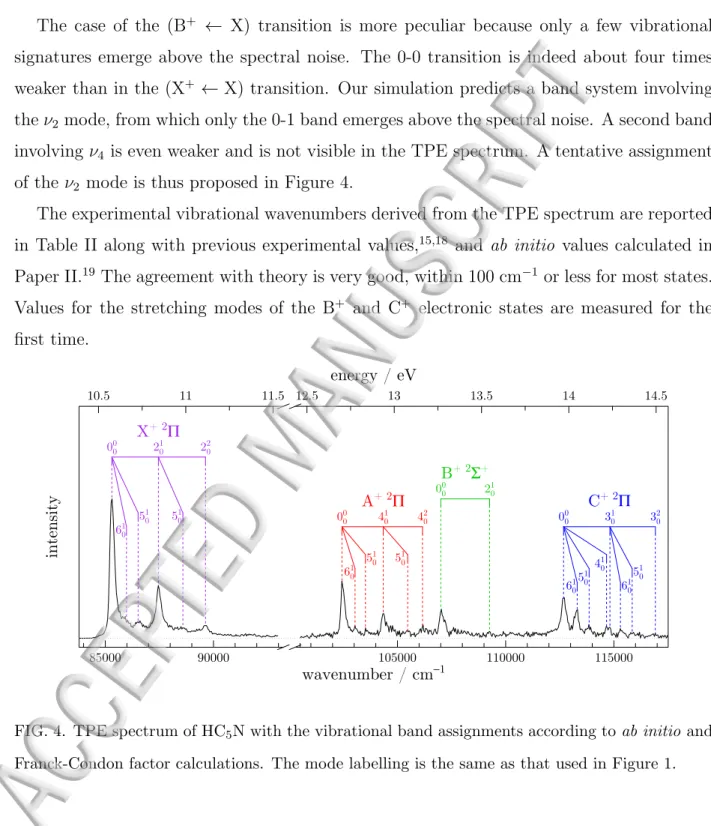
The corresponding assignments are shown in Figure 4. Transition to the X+ state
ex-hibits a vibrational progression involving the ν2 mode, and combination bands with the ν5
mode. These findings can be interpreted in terms of bond length changes upon ionization from the neutral ground state. Indeed, ab initio calculations (see Table II of Paper II19
and atom labelling adopted in this work) predict that the main geometry changes in the (X+ ← X) transition are a shortening of the C
2-C3 single bond (∆R(C2-C3) = −0.054 ˚A)
and a lengthening of the C1≡C2 triple bond (∆R(C1≡C2) = +0.031 ˚A). These geometry
changes are well described by the ν2 vibrational normal mode (see Figure 1). For the
(A+ ← X) transition, observation of a progression in the ν
4 mode agrees with the shortening
of the C4-C5 single bond (∆R(C4-C5) = −0.034 ˚A) and the lengthening of the C5≡N triple
bond (∆R(C5≡N) = +0.047 ˚A), both changes are associated to the ν4 mode (see Figure 1).
For the (C+ ← X) transition, the main change in geometry predicted by the calculations
concerns the lengthening of the C5≡N triple bond (∆R(C5≡N) = +0.044 ˚A) and, to a
lesser extent, that of the C3≡C4 triple bond (∆R(C3≡C4) = +0.026 ˚A). This explains the
observation of a progression in the ν3 mode only for this excited electronic state. For all
these excited electronic states, the assignments of other vibrational modes (mainly ν5 and
ν6) are also tentatively proposed, with a weaker intensity. Note that the intensity of the
assigned ν6 mode for the C+ cation state is much higher than expected. It does not seem to
be induced by autoionization processes, since in this spectral region, neither the absorption spectrum11 nor the ion yield exhibit Rydberg structures. We attribute this disagreement
to the existence of vibronic couplings revealed by our ab initio calculations, but not taken into account by our FCF simulation. These vibronic interactions are induced by an avoided
crossing that affects specifically the ν6 mode of the C+ state (see Section III.E.5 of Paper
II19 for more details).
The case of the (B+ ← X) transition is more peculiar because only a few vibrational signatures emerge above the spectral noise. The 0-0 transition is indeed about four times weaker than in the (X+ ← X) transition. Our simulation predicts a band system involving
the ν2 mode, from which only the 0-1 band emerges above the spectral noise. A second band
involving ν4 is even weaker and is not visible in the TPE spectrum. A tentative assignment
of the ν2 mode is thus proposed in Figure 4.
The experimental vibrational wavenumbers derived from the TPE spectrum are reported in Table II along with previous experimental values,15,18 and ab initio values calculated in
Paper II.19 The agreement with theory is very good, within 100 cm−1 or less for most states. Values for the stretching modes of the B+ and C+ electronic states are measured for the
first time. 85000 90000 105000 110000 115000 10.5 11 11.5 12.5 13 13.5 14 14.5 wavenumber / cm−1 energy / eV intensity 000 201 202 601 501 501 00 0 4 0 1 4 0 2 60 1 50 1 5 0 1 00 0 20 1 000 3 0 1 3 0 2 601 6 0 1 501 40 501 1 X+ 2Π A+ 2Π B+ 2Σ+ C+ 2Π
FIG. 4. TPE spectrum of HC5N with the vibrational band assignments according to ab initio and
TABLE II. Calculated and experimental vibrational wavenumbers for the stretching modes of
HC5N+. All the values are in cm−1 and the experimental uncertainties are given in parenthesis.
mode
X+ 2Π A+ 2Π B+ 2Σ+ C+ 2Π
Calc.a Exp.a Calc.a Expa Calc.a Expa Calc.a Expa
ν1 3403 - 3412 - 3456 - 3433 -3305b 3381c ν2 2300 2190 (80) 2350 - 2339 2218(80) 2214 -2189b 2190(10)d 2278c ν3 2121 - 2210 - 2282 - 2170 2141(80) 2082b 2070(10)d 2156c ν4 1985 - 1999 1890(80) 2141 - 2102 1985(80) 1929b 1870(160)d 1998c ν5 1238 1220(80) 1097 1115(80) 1244 - 1229 1180(80) 1221b 1220(10)d 1251c ν6 639 670(80) 618 610(80) 654 - 608 628(80) 628b 630(10)d 600(160)d 643c
a this work19unless specified. Calculated values obtained at the ic-MRCI+Q/AVTZ level of theory within
the harmonic approximation;
bDFT calculations from Lee15;
c DFT calculations from Cao and Peyerimhoff18;
C. Concluding remarks
The present experimental study provides additional information on the vibronic structure of the HC5N+ cation up to 33 000 cm−1 above the ionization potential thanks to improved
resolution compared to the previous study by Bieri et al.13 High-level ab initio calculations
coupled with Franck-Condon simulations provides the reliable assignment of vibrational modes of the four lowest electronic states of the cation. Only stretching vibrational mode excitations have been observed with a non-negligible intensity in the TPE spectrum, corre-sponding to elongation of the C≡N and C≡C triple bonds. This new information, as well as the refined values of the adiabatic ionization threshold values for the X+ 2Π, A+ 2Π, B+, 2Σ+and C+ 2Π electronic states, will be very helpful for the analysis of the VUV absorption
spectrum of HC5N recently measured with the VUV Fourier-Transform spectrometer of the
DESIRS beamline,32 and assigment of various Rydberg series converging to these excited
cationic states. That work will be presented in a forthcoming paper.
ACKNOWLEDGMENTS
We acknowledge SOLEIL for provision of synchrotron radiation facilities and Dr. Xi-aofeng Tang for the coupling of the effusive beam with the SAPHIRS experimental setup. This work was performed on the DESIRS beamline under proposal number 20150114. This work received financial support from the French Agence Nationale de la Recherche (ANR) under Grant No. ANR-17-CE30-0031 (project PRIMA) and from the Programme National ’Physique et Chimie du Milieu Interstellaire’ (PCMI) of CNRS/INSU with INC/INP co-funded by CEA and CNES. J.L. thanks the Fonds National de la Recherche Scientifique de Belgique (FRS-FNRS) for financial support (IISN 4.4504.10 project) and the ULB/VUB computing center and the CECI for computational support.
REFERENCES
1L. Avery, N. Broten, J. MacLeod, T. Oka, and H. Kroto, “Detection of the heavy
2K. Taniguchi, H. Ozeki, M. Saito, N. Sakai, F. Nakamura, S. Kameno, S. Takano, and
S. Yamamoto, “Implication of Formation Mechanisms of HC5N in TMC-1 as Studied by 13C Isotopic Fractionation,” The Astrophysical Journal 817, 147 (2016).
3J. Cernicharo, A. M. Heras, A. G. G. M. Tielens, J. R. Pardo, F. Herpin, M. Gu´elin, and
L. B. F. M. Waters, “Infrared Space Observatory’s Discovery of C4H2, C6H2, and Benzene
in CRL 618,” The Astrophysical Journal Letters 546, L123 (2001).
4Dinh-V-Trung and J. Lim, “Molecular Shells in IRC+10216: Evidence for Nonisotropic
and Episodic Mass-Loss Enhancement,” The Astrophysical Journal 678, 303 (2008).
5W. F. Huebner, “Composition of Comets: Observations and Models,” Earth, Moon, and
Planets 89, 179–195 (2000).
6E. de Vanssay, M. C. Gazeau, J. C. Guillemin, and F. Raulin, “Experimental simulation
of Titan’s organic chemistry at low temperature,” Planetary and Space Science 43, 25–31 (1995).
7P. Coll, D. Coscia, N. Smith, M.-C. Gazeau, S. I. Ram´ırez, G. Cernogora, G. Isra¨el, and
F. Raulin, “Experimental laboratory simulation of Titan’s atmosphere: aerosols and gas phase,” Planetary and Space Science 47, 1331–1340 (1999).
8Y. Trolez and J.-C. Guillemin, “Synthesis and Characterization of 2,4-Pentadiynenitrile
– A Key Compound in Space Science,” Angewandte Chemie International Edition 44, 7224–7226.
9Y. B´enilan, A. Jolly, Y. Trolez, F. Raulin, and J.-C. Guillemin, “Infrared band
intensi-ties of cyanobutadiyne (HC5N) between 400 and 4000 cm−1,” Journal of Molecular
Spec-troscopy 245, 109–114 (2007).
10M. Turowski, C. Cr´epin, M. Gronowski, J.-C. Guillemin, A. Coupeaud, I.
Couturier-Tamburelli, N. Pi´etri, and R. Ko los, “Electronic absorption and phosphorescence of cyan-odiacetylene,” The Journal of Chemical Physics 133, 074310 (2010).
11N. Fray, Y. B´enilan, M.-C. Gazeau, A. Jolly, M. Schwell, E. Arzoumanian, T. Ferradaz,
E. Es-Sebbar, and J.-C. Guillemin, “Temperature-dependent photoabsorption cross sec-tion of cyanodiacetylene in the vacuum UV,” Journal of Geophysical Research: Planets 115 (2010), 10.1029/2009JE003518.
12M. Turowski, C. Cr´epin, S. Douin, M. Gronowski, I. Couturier-Tamburelli, N. Pi´etri,
A. Wasiak, and R. Ko los, “Low temperature Raman spectra of cyanobutadiyne (HC5N),” Vibrational Spectroscopy 62, 268–272 (2012).
13G. Bieri and L. Asbrink, “30.4-nm He(II) photoelectron spectra of organic molecules. Part
I. Hydrocarbons,” Journal of Electron Spectroscopy and Related Phenomena 20, 149–167 (1980).
14W. E. Sinclair, D. Pfluger, and J. P. Maier, “Rotationally resolved A2Π ← X2Π
elec-tronic spectra of cyanodiacetylene and dicyanoacetylene cations,” The Journal of Chemical Physics 111, 9600–9608 (1999).
15S. Lee, “Density Functional Theory Study of Cyano- and Dicyanopolyacetylene Cations,”
The Journal of Physical Chemistry 100, 13959–13962 (1996).
16D. Forney, P. Freivogel, J. Fulara, and J. P. Maier, “Electronic absorption spectra of
cyanosubstituted polyacetylene cations in neon matrices,” The Journal of Chemical Physics 102, 1510–1514 (1995).
17A. M. Smith, J. Agreiter, and V. E. Bondybey, “Laser-induced fluorescence of
matrix-isolated H-C≡C-C≡C-C≡N+ and H-C≡C-C≡C-C≡C-C≡N+,” Chemical Physics Letters
244, 379–387 (1995).
18Z. Cao and S. D. Peyerimhoff, “MRD-CI Characterization of Electronic Spectra of
Iso-electronic Species C−6, NC4N+, and CNC3N+,” The Journal of Physical Chemistry A 105,
627–631 (2001).
19B. Gans, S. Boy´e-P´eronne, and J. Li´evin, “Vibronic structure of the cyanobutadiyne
cation: II-Theoretical exploration of the complex energy landscape of HC5N+,” The
Jour-nal of Chemical Physics (2019).
20G. A. Garcia, B. K. de Miranda, M. Tia, S. Daly, and L. Nahon, “DELICIOUS III:
A multipurpose double imaging particle coincidence spectrometer for gas phase vac-uum ultraviolet photodynamics studies,” Review of Scientific Instruments 84 (2013), http://dx.doi.org/10.1063/1.4807751.
21L. Nahon, N. de Oliveira, G. A. Garcia, J.-F. Gil, B. Pilette, O. Marcouill´e, B. Lagarde,
and F. Polack, “DESIRS: a state-of-the-art VUV beamline featuring high resolution and variable polarization for spectroscopy and dichroism at SOLEIL,” Journal of Synchrotron Radiation 19, 508–520 (2012).
22H.-J. Werner, P. J. Knowles, G. Knizia, F. R. Manby, M. Sch¨utz, P. Celani, T. Korona,
R. Lindh, A. Mitrushenkov, G. Rauhut, K. R. Shamasundar, T. B. Adler, R. D. Amos, A. Bernhardsson, A. Berning, D. L. Cooper, M. J. O. Deegan, A. J. Dobbyn, F. Eckert, E. Goll, C. Hampel, A. Hesselmann, G. Hetzer, T. Hrenar, G. Jansen, C. K¨oppl, Y. Liu,
A. W. Lloyd, R. A. Mata, A. J. May, S. J. McNicholas, W. Meyer, M. E. Mura, A. Nicklass, D. P. O’Neill, P. Palmieri, D. Peng, K. Pfl¨uger, R. Pitzer, M. Reiher, T. Shiozaki, H. Stoll, A. J. Stone, R. Tarroni, T. Thorsteinsson, and M. Wang, “MOLPRO, version 2015.1, a package of ab initio programs,” (2015).
23H. Werner, P. J. Knowles, G. Knizia, F. R. Manby, and M. Sch¨utz, “Molpro: a
general-purpose quantum chemistry program package,” Wiley Interdisciplinary Reviews: Compu-tational Molecular Science 2, 242–253 (2012).
24H. Werner and P. J. Knowles, “An efficient internally contracted
multiconfigurationrefer-ence configuration interaction method,” The Journal of Chemical Physics 89, 5803–5814 (1988).
25P. J. Knowles and H.-J. Werner, “An Efficient Method for the Evaluation of Coupling
Coefficients in Configuration Interaction Calculations,” Chem. Phys. Letters 145, 514– 522 (1988).
26H.-J. Werner and P. J. Knowles, “A Second Order MCSCF Method with Optimum
Con-vergence,” J. Chem. Phys. 82, 5053 (1985).
27P. J. Knowles and H.-J. Werner, “An Efficient Second Order MCSCF Method for Long
Configuration Expansions,” Chem. Phys. Letters 115, 259–267 (1985).
28T. H. Dunning Jr., “Gaussian basis sets for use in correlated molecular calculations.I. The
atoms boron through neon and hydrogen,” J. Chem. Phys. 90, 1007–1023 (1989).
29R. A. Kendall, T. H. Dunning, and R. J. Harrison, “Electron affinities of the first-row
atoms revisited. Systematic basis sets and wave functions,” The Journal of Chemical Physics 96, 6796–6806 (1992).
30N. Lamarre, Photoexcitation et relaxation de cyanopolyynes en phase gazeuse dans le domaine de l’ultraviolet du vide,
Ph.D. thesis, Universit´e Paris-Sud - Universit´e Paris Saclay (2016).
31C. M. Western, “PGOPHER: A program for simulating rotational, vibrational and
elec-tronic spectra,” Journal of Quantitative Spectroscopy and Radiative Transfer 186, 221–242 (2017).
32N. de Oliveira, D. Joyeux, M. Roudjane, J. F. Gil, B. Pilette, L. Archer, K. Ito, and
L. Nahon, “The high resolution absorption spectroscopy branch on the VUV beamline DESIRS at SOLEIL,” Journal of Synchrotron Radiation 23, 887–900 (2016).