HAL Id: inria-00492001
https://hal.inria.fr/inria-00492001
Submitted on 14 Jun 2010
HAL is a multi-disciplinary open access
archive for the deposit and dissemination of
sci-entific research documents, whether they are
pub-lished or not. The documents may come from
teaching and research institutions in France or
abroad, or from public or private research centers.
L’archive ouverte pluridisciplinaire HAL, est
destinée au dépôt et à la diffusion de documents
scientifiques de niveau recherche, publiés ou non,
émanant des établissements d’enseignement et de
recherche français ou étrangers, des laboratoires
publics ou privés.
Towards a bio-inspired evaluation methodology for
motion estimation models
Émilien Tlapale, Pierre Kornprobst, Jan Bouecke, Heiko Neumann, Guillaume
S. Masson
To cite this version:
Émilien Tlapale, Pierre Kornprobst, Jan Bouecke, Heiko Neumann, Guillaume S. Masson. Towards
a bio-inspired evaluation methodology for motion estimation models. [Research Report] RR-7317,
INRIA. 2010, pp.18. �inria-00492001�
a p p o r t
d e r e c h e r c h e
0249-6399
ISRN
INRIA/RR--7317--FR+ENG
Computational Medicine and Neurosciences
Towards a bio-inspired evaluation methodology for
motion estimation models
Émilien Tlapale — Pierre Kornprobst — Jan Bouecke — Heiko Neumann — Guillaume S.
Masson
N° 7317
Centre de recherche INRIA Sophia Antipolis – Méditerranée
for motion estimation models
´
Emilien Tlapale
∗, Pierre Kornprobst
†, Jan Bouecke
‡, Heiko
Neumann
§, Guillaume S. Masson
¶Theme : Computational Medicine and Neurosciences ´
Equipe-Projet NeuroMathComp
Rapport de recherche n° 7317 — June 2010 —18pages
Abstract: Offering proper evaluation methodology is essential to continue progress in modelling neural mechanisms in vision/visual information process-ing. Currently, evaluation of motion estimation models lacks a proper method-ology for comparing their performance against the visual system. Here, we set the basis for such a new benchmark methodology which is based on human visual performance as measured in psychophysics, ocular following and neuro-biology. This benchmark will enable comparisons between different kinds of models, but also it will challenge current motion estimation models and bet-ter characbet-terize their properties with respect to visual cortex performance. To do so, we propose a database of image sequences taken from neuroscience and psychophysics literature. In this article, we focus on two aspects of motion estimation, which are the dynamics of motion integration and the respective influence between 1D versus 2D cues. Then, since motion models possibly deal with different kinds of motion representations and scale, we define here two gen-eral readouts based on a global motion estimation. Such readouts, namely eye movements and perceived motion will serve as a reference to compare simulated and experimental data. We evaluate the performance of several models on this data to establish the current state of the art. Models chosen for comparison have very different properties and internal mechanisms, such as feedforward normalisation of V1 and MT processing and recurrent feedback. As a whole, we provide here the basis for a valuable evaluation methodology to unravel the fun-damental mechanisms of the visual cortex in motion perception. Our database is freely available on the web together with scoring instructions and results at
http://www-sop.inria.fr/neuromathcomp/software/motionpsychobench. Key-words: neural models; smooth pursuit; motion perception; benchmark
∗Emilien.Tlapale@sophia.inria.fr †Pierre.Kornprobst@sophia.inria.fr ‡Jan.Bouecke@uni-ulm.de §heiko.neumann@uni-ulm.de ¶guillaume.masson@incm.cnrs-mrs.fr
Vers une m´
ethodologie bio-inspir´
ee d’´
evaluation
de mod`
eles d’estimation du mouvement
R´esum´e : Offrir une m´ethodologie d’´evaluation est essentiel pour la recherche en mod´elisation des m´ecanismes neuraux impliqu´es dans la vision. Actuelle-ment, il manque `a l’´evaluation des mod`eles d’estimation du mouvement une m´ethodologie bien d´efinie permettant de comparer leurs performances avec celles du syst`eme visuel. Ici nous posons les bases d’un tel banc d’essai, bas´e sur les performances visuelles des humains telles que mesur´ees en psychophysique, en oculo-motricit´e, et en neurobiologie. Ce banc d’essai permettra de com-parer diff´erents mod`eles, mais aussi de mieux caract´eriser leurs propri´et´es en regard du comportement du syst`eme visuel. Dans ce but, nous proposons un ensemble de s´equences vid´eos, issues des exp´erimentations en neurosciences et en psychophysique. Dans cet article, nous mettons l’accent sur deux princi-paux aspects de l’estimation du mouvement : les dynamiques d’int´egration du mouvement, et les influences respectives des informations 1D par rapport aux informations 2D. De l`a, nous d´efinissons deux≪lectures≫bas´es sur l’estimationdu mouvement global. De telles≪lectures≫, nomm´ement les mouvements des
yeux, et le mouvement per¸cu, serviront de r´ef´erence pour comparer les donn´ees exp´erimentales et simul´ees. Nous ´evaluons les performances de diff´erents mod`eles sur ces stimuli afin d’´etablir un ´etat de l’art des mod`eles d’int´egration du mouve-ment. Les mod`eles compar´es sont choisis en fonction de leurs grandes diff´erences en terme de propri´etes et de m´ecanismes internes (r´etroaction, normalisation). En d´efinitive, nous ´etablissons dans ce travail les bases d’une m´ethodologie d’´evaluation permettant de d´ecouvrir les m´ecanismes fondamentaux du cortex visuel d´edi´e `a la perception du mouvement. Notre jeu de stimuli est libre-ment accessible sur Internet, accompagn´e d’instructions pour l’´evaluation, et de r´esultats, `a l’adresse : http://www-sop.inria.fr/neuromathcomp/software/ motionpsychobench.
Mots-cl´es : mod`eles neuraux; poursuite lisse; perception du mouvement; banc d’essai
Contents
1 Introduction 3
2 Why is it difficult? 4
2.1 Display parametrisation . . . 4
2.2 Discretisation problems . . . 5
2.3 Inhomogeneity of the motion representations . . . 6
2.4 Lack of ground truth . . . 6
2.5 Nature and variety of neuroscience results . . . 7
3 Database design 7 3.1 Motivation . . . 7 3.2 Line-drawing objects . . . 7 3.3 Gratings . . . 8 4 Evaluation methodology 10 4.1 Read-out definitions . . . 10 4.2 Quantitative comparison . . . 11 4.2.1 Fitting functions . . . 11 4.2.2 Quantifying errors . . . 11 4.3 Experimental protocol . . . 12
4.4 State of the art results . . . 12
5 Discussion 13 5.1 Classical models failures . . . 13
5.2 Extending the methodology . . . 15
1
Introduction
Offering proper evaluation methodology is essential to continue progress in mod-elling the neural mechanisms of visual information processing in human and non-human primates. This general idea has been very well understood and ap-plied in computer vision where challenging benchmarks are now available for several key problems, allowing models to be compared and further improved. For example, motion estimation performance in computer vision increased sig-nificantly if one considers the results obtained thanks to classical benchmarks such asBarron et al.(1994) or more recentlyBaker et al.(2007).
For example, inBaker et al.(2007), the authors defined a set of challenging image sequences and a precise evaluation methodology. Their evaluation meth-odology consists of several quantified criteria based on comparisons between output from algorithms and the ground truth (here, the true optical flow). Note that the choice of the sequences seemed to be motivated by the need to com-pared motion models on identified key difficulties in this area (e.g., occlusions, non-rigid motions, large displacements) encountered by motion models. That means that setting a benchmark requires first to identify which key problems are to be evaluated in which priority.
In this article, we follow a similar objective as in computer vision, which is to propose suitable benchmarks in order to continue progress in modelling, but we investigate here how to evaluate models against visual system performance. So
A bio-inspired evaluation methodology for motion estimation 4
our contribution is complementary to benchmarks proposed in computer vision which only focus on local error measurements between simulated results and true flow fields.
So, comparing simulated results to visual system performance is very dif-ferent indeed than comparing just flow fields together. As far as the visual system performance is concerned, the notion of local motion doesn’t make a lot of sense. The purpose of the biological motion systems is to segment cluttered visual scenes, to single out moving surfaces or objects and compute their global direction and speed in order to be able to control goal-directed movements or to build meaningful percepts. It is therefore necessary to define more global readout in order to be able to compare outputs from models with observable quantities measured in neuroscience experiments. Moreover, most perceptual and behavioural experiments provide different types of data such as motion pattern detection or discrimination, perceived quantities such as direction and speed but also more subtle judgements such as number of depth planes with op-tic flow patterns or action recognition in biological motion. These measurements can be obtained using psychophysical methods or measurements of a given mo-tor responses such as smooth pursuit eye movements. Lastly, the goal of models is to elucidate both computational principles and computing architectures. It is therefore necessary to compare models outputs with biological responses at different scales, from single neuron to behaviour.
An impressive bulk of visual motion studies have been conducted over the last few decades, so that claiming to propose a full bio-inspired methodology for motion models is not feasible. Instead, we want to show here the interest of such a methodology for comparing models and biological data by focusing on one specific problem in visual motion processing, namely 2D motion integration. We will propose a selection of the most representative experiments that provide key data for constraining model design and testing, at several functional levels, from single neuron responses to motor responses and percepts..
This paper is organised as follows. Section2 describes in more detail what are the main difficulties to design such an evaluation methodology. It is an im-portant discussion as it really demonstrates the different kind of nature between benchmarks in computer vision and the benchmark we consider here. Section4 presents our bio-inspired evaluation methodology, that is which readout do we consider and how to define quantified measurements from them. Section 3 provides the set of baseline stimuli, given our goal which is to focus on the dynamics of motion integration and the respective influence between 1D versus 2D cues. Note that footnotes will be included in the text referring to scripts and implementations details of the benchmark.
2
Why is it difficult?
2.1
Display parametrisation
Comparing model results one with the other, as well as comparing model results with biological data, requires to set up equivalent stimuli with respect to their size, geometry, duration, and luminance. In neuroscience experiments, stimuli are characterized by their physical size, as well as the observers’ viewing dis-tance, and their visual field size. When we apply a model on a set of different
stimuli, we need to ensure that the mapping between the physical and numer-ical dimensions of the stimuli remains constant across all stimuli. Any failure in applying a coherent mapping between physical and numerical dimensions would lead to scale incoherences in the simulated results. The same kind of relation also needs to be maintained between real and numerical duration and luminance.
2.2
Discretisation problems
By definition, digital images are discrete. This discretisation implies the neces-sity to define properly a scale factor for converting real-world values character-istics into computer parameters. The main problem with discretisation proced-ures involved in defining numerical stimuli is the aliasing problem. One has to make sure that frequency of the input does not cross the Nyquist frequency. Discretisation problems can be found for several characteristics of stimuli such as:
• Geometry is specified in visual field degrees, as noted in the previous Section 2.1. As an additional note on spatial discretisation, one should note that image generators often incorporate anti-aliasing algorithms to smooth the discretisation step. In a given set of stimuli, the usage (or not) of such anti-aliasing algorithms need to be specified.
• Duration can be specified in milliseconds in the stimuli, and are impli-citly encoded in the frame-rate of the stimuli. A frame based discretisa-tion is generally used to encode video sequences into computer data. It discretised the physical space-time volume into voxels that all have the same characteristics except for their luminance. Again one has to make sure that the frequencies of the stimuli are compatible with the sampling chosen to avoid aliasing. Also, note the link between spatial resolution, duration and speed. Models are often very restricted by the size of the image and the range of velocities that they can process (fine discretisation of the distances lead to large numerical speeds in pixel/frame).
• Luminance is yet another quantity involved in the numerical stimuli gener-ation. Here one should note that common computer image formats encode luminance as a positive integer value less than 256. This coarse quantiz-ation is a very hard limitquantiz-ation on the stimuli, if one compares it with the ability of the brain to handle a very wide range of luminance.
• Contrast is a fundamental aspect of biological visual processing and this parameter is often use to probe the properties of low to high visual pro-cessing. Contrast is known to influence how different features are extracted and linked together, the width of spatial and temporal integration win-dows and many other variables. It has a profound impact of the temporal dynamics of most visual percepts and is responsible for many dynamical non-linearities. Most psychophysical procedures use Michelson contrast and the highest sensitivity range of the human visual system often chal-lenge the contrast values achievable with 8 bits images.
• Many other aspects of motion stimuli used in psychophysical tasks shall be addressed such as colour spaces or 3D information.
A bio-inspired evaluation methodology for motion estimation 6
2.3
Inhomogeneity of the motion representations
Motion models do not all have the same output, i.e., the same motion represent-ation. For example, motion can be well described by global velocity likelihoods (Montagnini et al., 2007), velocity distributions at every position (Grossberg et al., 1999; Bayerl and Neumann, 2004), filter responses (Adelson and Ber-gen,1985), time-correlated spike trains (Cesmeli et al.,2000), or 2D flow fields (Barron et al., 1994). As far as neural models are concerned, different layers of the visual cortex are usually modelled, giving different motion representa-tions for the same scene. For example, a model reproducing main cortical layers of the dorsal stream will include V1 layers with filter-like responses, MT lay-ers corresponding to local pattern translational motions and MST laylay-ers giving indications of global rotation or expansion motions.
As a result, it is necessary to define common observable quantities out of this variety of motion representations, and these observable quantities should be comparable to data measured in neuroscience. These common observable quantities will be also called readouts in the sequel for simplicity, both in the context of simulations and experiments. There are however some paradigms which have been carried at many different levels. For instance, the coherence level necessary for perceiving global motion in a random dot patterns has been measured in human observers but also in single neurons in areas MT, MST or LIP. For the example being considered here, i.e. 2D motion integration, a consistent set of global direction estimates have been collected at these different levels as well as for human perception, monkey and human smooth pursuit (Masson and Ilg, 2010). When available, these datasets collected for different responses with a single set of motion stimuli should be used to benchmark models.
2.4
Lack of ground truth
In computer vision, ground truth in motion computation is the true optical which is easily defined for synthetic videos, and which can also be known for real scene videos (recorded with a specific procedure). For example in Baker et al.
(2007), the authors propose benchmark videos with a true optical flow which are then used to perform quantitative measurements based on local comparisons of the 2D flow fields against the estimated flow resulting from different algorithms. However, if one considers motion perception in psychophysical studies, the concept of ground truth becomes less obvious and it becomes impossible to define ground truth in the strict sense. For example, one has to handle the great variability between subjects or between trials for a single subject. Moreover, since the data reported in the literature is often concise, i.e., described by a mean and a standard deviation, it is often difficult to extract the statistical law underlying the data. Also, many stimuli are bi-stable or multi-stable, leading to changes in perception along time: the solution is neither unique, nor stable in time.
What is meaningful in psychophysical studies, is that they do suggest some relevant behaviours of the visual system depending on stimuli parameters. Then, these behaviour can then be compared to the output of motion models. So our goal here will be to quantify these properties on a given set of stimuli, in order to decide whether a model reproduces qualitatively a general behaviour. So,
ground truth notion has to be understood in a weaker sense here, and data have to be collected in the literature.
2.5
Nature and variety of neuroscience results
Another major difficulty is that motion perception analysis has a long history and it is still today an active field of research. Indeed, there is a wide range of questions that can be investigated around motion in neuroscience, such as the influence of stimulus parameters, the relations between all components, the sensitivity to contrast, or effects due to 3D percepts. Then we can analyse the visual system response at a given time, its evolution or the different responses in case of multi-stability. Finally, literature provides a wide range of results that can be categorized into perception, oculo-motricity or neural responses; and for a given class of stimuli, results from these different sources may lead to different interpretation. This short overview shows the complexity of trying to capture what could be the main properties and results to focus on. Given this variety of neuroscience results, it is necessary to restrict our study to a limited set of fundamental questions.
3
Database design
3.1
Motivation
As mentioned in Section2.5, there is great variety of neuroscience studies and results concerning motion estimation and perception in primates. In this paper, we focus on two aspects of motion estimation, namely the dynamics of motion integration and the respective influence between 1D versus 2D cues. For these well-known questions, representative stimuli can be chosen. These stimuli fit into two classes:
Line-drawings In order to study the dynamics of motion integration and the solution of the aperture problem, we need to use simple stimuli where we control high-level interferences. Line-drawing objects are amongst the most simple stimuli and their dynamics have been well studied.
Gratings To evaluate the respective influence of 1D versus 2D cues in the mo-tion integramo-tion mechanism various types of gratings can be used varying the shape of the aperture through which they are seen.
We also focused on stimuli for which smooth pursuit eye movements and motion perception data were available.
3.2
Line-drawing objects
Translating diamonds
The experiments of Masson and Stone (2002) involve diamond stimuli trans-lating either vertically or horizontally1 (see Figure 1, on the first row ). Due
to the local orientations of the diamonds edges with respect to the translating direction, these stimuli mimic type II plaids. Indeed the vector average of the
A bio-inspired evaluation methodology for motion estimation 8
edge motions is biased 44◦ away from the object’s direction. The stimuli thus
provide an interesting line-drawing object to study the influence of 1D and 2D cues on motion integration.
Altering the configuration of the stimulus, by using clockwise (CW) or counter-clockwise (CCW) stimuli, or by varying the direction of the transla-tion, does not influence the ability to pursuit the translating diamonds. But in all the cases, the initial pursuit direction, as well as fastest perceptual estimates, are biased towards the vector average of the edge motions. It is only after a few hundred milliseconds of exponential direction error decay that the eyes correctly track the object or that human subjects report the correct direction of motion. Translating bars
Pursuing a translating bar which true motion direction is tilted with respect to its normal direction leads to initial deviation in the smooth pursuit eye move-ment direction. For example, the peak directional error for a tilted bar of 20° length, 0.5° width and 92cd/m2
luminance, moving with 16°/s is about 30° (Biber and Ilg,2008).
As discussed earlier, testing against such absolute values raise a lot of issues, namely the difficulty of mapping real world sizes, luminances, and timings to model results. More generally the following facts could be used for qualitatively testing the model results. The integration dynamics of the translating bar de-pends on several factors. For instance as the bar length is increased, it becomes more complicated to recover its true direction. Likewise it easier to pursue one long bar, if it is tiled into several sub bars (Lorenceau et al., 1993; Biber and Ilg,2008).
Thus, to obtain a qualitative model evaluation, slope of peak directional error could be analysed with respect to bar length, number of bar tiles and bar luminance. Some other experiments conducted by Born et al.(2006b) showed that the time course of mean directional angular error of this smooth pursuit eye movement could be fitted very well by at most two exponential decay functions.
3.3
Gratings
Barber-pole
In the classical barber-pole illusion, a translating grating is viewed through a rectangular aperture, leading to two orthogonal sets of 2D cues (Wallach(1935)). The larger set of 2D cues originates from the longest side of the rectangular aperture, while the smaller set of 2D cues originates from the shortest side. Ac-cording to psychophysical experiments, as well as neurobiological data, the final perceived motion direction is the same as the orientation of the elongated side of the aperture, after an initial direction orthogonal to the grating orientation
Masson et al. (2000). The perceived motion direction thus corresponds to the 2D cues with the greater number of occurrences.
Again, similar observations are available at psychophysical Castet et al.
(1999); Kooi (1993) and neuronal Pack et al. (2004) levels. Thus it becomes to compare model outputs with a global read-out such as perceived direction or, even better, time-dependant ocular pursuit but also to compare the dynamics of single model neurons with that of V1 and MT neurons.
CCW
CW
Figure 1: Sample stimuli and main associated results. First row: Translating diamonds stimuli and mean direction error for the clockwise and the counter-clockwise stimuli showing an exponential decay. Reproduced fromMasson and Stone (2002). Second row: Grating viewed through circular apertures of dif-ferent diameters. For a given time, the change in eye position depends on the aperture diameter. Reproduced fromBarthelemy et al.(2006).
A bio-inspired evaluation methodology for motion estimation 10
Gratings sizes
InBarthelemy et al.(2006), the authors use a drifting grating viewed through a circular aperture (see Figure 1). The orientation of the grating is constant and orthogonal to its drifting direction, but the diameter of the circular aperture varies among the stimuli. The authors quantify the change in eye direction during several time windows with respect to stimulus diameter. Their goal is to provide a quantitative measure of the spatial summation area, i.e. the smallest diameter leading to the strongest change in eye position. Such spatial summation functions can be seen as a global read-out of the motion integration performed in area MT. It is however also possible to look at the perceptual effects of such stimuli: varying sizes of grating patches affect motion detection as well as motion after effect. Many psychophysical studies have been conducted on the perceptual consequences of the centre-surround interactions in early visual areas (seeSeri`es et al.(2001) for a review) and it becomes possible to compare these results for the properties of neuronal receptive fields in area V1, MT or MST in macaque monkeys. Spatial summation properties and centre-surround interactions also another perfect examples of to the strongest change in eye position.
4
Evaluation methodology
4.1
Read-out definitions
The read-outs defined herein correspond to global motion estimations, since the notion of local measurement can not be clearly interpreted in term of the neural architecture or activity. For example, it is known that the preferred motion of neurons on both V1 and MT changes depending on the stimulus (Pack et al., 2005a), or that the perceived motion and the neural activity in MT can differ (Huang et al., 2008). Not considering only the local estimates makes an important difference with classical computer vision methodology for optical flow where only precision of local estimates matters.
Our goal is to define qualitatively which common output are needed from models (i.e. readout, inspired from real neuroscience experiments). However no general formula for readouts can be given for several reasons. The first reason is that the cortical mechanisms leading to a read-out from neural activity are usually not clearly established and a fortiori it is hard to model them rigorously. The second reason is that the variety of motion representations in models makes it impossible to write a general formula that would be valid for any kind of representation. The last reason is that read-outs defined here are sometimes inherent to models.
Common outputs are necessary in order to compare models together and abstract all implementation dependent issues coming from the large variety of motion models. For example, if eye-movement like output can be defined, then models can be compared together in term of dynamics. As illustrated by this example, our goal here is to propose output formats corresponding to classical read-outs as defined in psychophysics. Our goal is to describe for each read-out, what they are supposed to measure, and how they are measured in psychophysics.
Herein we discuss two types of read-outs: eye movements and motion per-ception.
• Eye movements: Voluntary eye movement to track motion are directly re-lated to our interpretation of the scene in term of motion content. Prim-ates use two types of voluntary eye movement to track objects of interest: smooth pursuit and saccades. Pursuit eye movements are driven visual motion and rely on both low-level and high-level motion processing. Pur-suit initiation is critically dependent upon visual motion processing in cortical areas MT and MST. It presents the interest of being a simple motor responses that requires an accurate estimate of the global direction and speed of a single object, despite its shape, colour and so on. It is therefore a good probe of object motion processing and in particular it reflects many of the dynamical properties of low level motion computa-tion. From a modelling point of view, eye movement read-out is a single velocity at each time step, and it will be essentially also here the direction in order to make comparisons with psychophysical data.
• Perceived motion: Given a stimulus, some experiments require subjects to give their impression concerning the motion they perceive. In general, this perceived motion read-out ignores its time evolution. From a modelling point of view, the perceived motion read-out is a velocity corresponding to the steady state. For the 2D motion integration tasks, we can assume that perceived motion corresponds to the final output from eye movement read-out. A future extension of the methodology would be to implement perceptual decision stages from the optical flow computations to match psychophysical results which are often expressed as gradual change in per-formance (e.g. percentage of correct responses).
4.2
Quantitative comparison
4.2.1 Fitting functions
As detailed in the previous section, in order to quantify the results presented in the literature, experimentalists generally provide data fitted to a function. For instance the difference between eye movements and the true movement of an object is often fitted to an exponentially decreasing function, as it appears that the eyes gradually catch up the moving object motion. Those fitting functions can serve as ground truth to evaluate motion model outputs. Note that these fitting procedure can be time-scale invariant by estimating two parameters for each fit, τ and t0, so that the time t is replaced by
˜ t = t
τ − t0
.
This time scale invariant measure can be used for models not having a strict input/output mapping to the real data.
4.2.2 Quantifying errors
Through the parameters of the fitting functions, we are able to quantify the errors made by motion models. Let us assume a fitting curve C with N para-meters pi=1..N as given in the literature. If we assume a normal law, we can
A bio-inspired evaluation methodology for motion estimation 12
quantify the error between pithe set of parameters found in the literature, and
e
pi the set of parameters resulting from a model by:
X
i
Gσi(pi−pei), (1)
where σi are the set of standard deviations associated with the parameters pi
in the literature, and Gσi(x) = exp(−
x2
2σ2
i) is a non-normalised Gaussian of
deviation σi.
In the following fitting function definition, we denote the fitting parameters as subscript.
4.3
Experimental protocol
Herein we choose to consider two main classes of stimuli, due to their pre-dominance in psychophysics: line-drawings and gratings. Those two classes of stimuli are often opposed, in particular since gratings can easily be interpreted in frequency space, but that this is more difficult for line-drawings. For each considered experiment, we give the original reference in which it appears, as well as a brief description, a motivation of its use, and expected results.
The standard protocol to evaluate a motion model is as follows: 1. Download the benchmark stimuli to be tested from our website 2. Apply your model on the benchmark stimuli.
3. Define and apply a read-out to convert your results into the common evaluable format.
4. Submit your results to the website, optionally allowing their publication on-line.
5. Alternatively you may want to download the software necessary to evalu-ate your read-out output and run it off-line.
More implementation details can be found in the software documentation.
4.4
State of the art results
We illustrate each of the proposed experiment of several classical approaches both from the computational neuroscience community (Simoncelli and Heeger,
1998; Bayerl and Neumann, 2004; Tlapale et al., 2008), and from the com-puter vision community (Horn and Schunck, 1981; Lucas and Kanade, 1981;
Farneb¨ack,2001)2. The classical computer vision approaches we tested herein
may look old but are still providing good results when applied to state of the art computer vision benchmarks (Baker et al.,2007). As we will discuss afterwards, the set of stimuli proposed herein provides a valuable benchmark for computer vision as well.
2Implementations forHorn and Schunck(1981);Lucas and Kanade(1981) are taken from the OpenCV library.
Horn and Schunck Lucas and Kanade Simoncelli and Heeger Tlapale et al. Barberpole ✔ ✔ ✔ ✔ Translating diamonds ✘ ✘ ✘ ✔ Translating dashed bars ✘ ✘ ✘ ✔ Grating size ✘ ✘ ✘ ✘
Table 1: Synthetic results for various algorithms and stimuli. ✘and ✔denotes failed and passed respectively.
Example: Translating diamonds
As an example of the proposed methodology, we now discuss the translating diamonds stimuli (Masson and Stone,2002) described in the previous sections. If we apply the stimuli as input to computer vision algorithms, we are given an optical flow (i.e. a vector field) v(t, x) : R+ ×
Ω → R2. For bio-inspired
models with a distributed velocity representation p(t, x, v) such as in Bayerl and Neumann(2004);Tlapale et al.(2008), we can compute a vector field by:
v(t, x) = R Vp(t, x, v) v dv R Vp(t, x, v)dv , (2)
where V is the set of velocities.
We can then average this flow field on the whole space, and compute a smooth pursuit like response w(t) by:
λ−1∂w ∂t(t) =
X
x∈Ω
v(t, x) − w(t). (3)
where Ω is the spatial domain, and λ is a smoothing parameter.
To characterise the dynamics in the translating diamonds stimuli, the half differential direction error is defined as half the difference between the direction errors observed for clockwise and counter clockwise diamonds, can be fitted to an exponential function. is fitted with the function:
fA,τ,B(t) = A exp(−t/τ ) + B. (4)
Since values and standard deviations are given for the parameters A, τ , and B, we can use them to obtain a quantitative quality measure, assuming a normal law (see Section4.2.2).
5
Discussion
5.1
Classical models failures
In this article we set the basis for a new benchmark methodology based on human visual performance as measured in psychophysics, ocular following, and neurobiology. This benchmark enables comparisons between two classes of mod-els: bio-inspired models and models coming from the computer vision literature. This benchmark reveals interesting differences between state of the art methods that we can summarize into two main observations.
A bio-inspired evaluation methodology for motion estimation 14
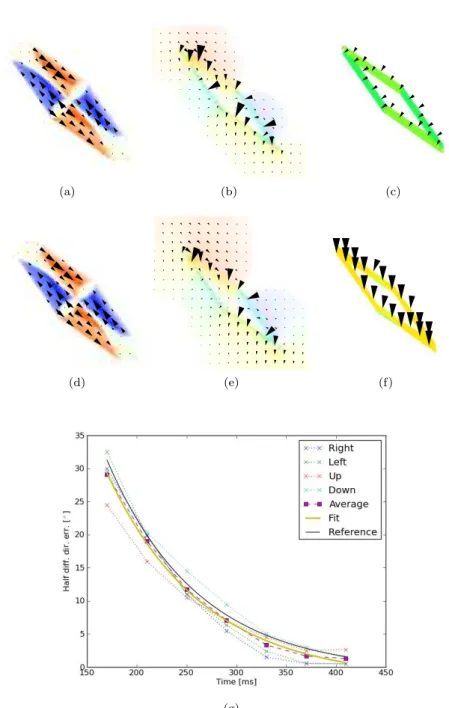
(a) (b) (c)
(d) (e) (f)
(g)
Figure 2: Effect of 2D cues in the translating diamonds byMasson and Stone
(2002). (a-c) Initial output for the model of Lucas and Kanade(1981); Horn and Schunck(1981);Tlapale et al.(2008) respectively. (d-f) Output after seven frames. Classical computer vision approaches do not integrate along objects.
The first observation is that the classical computer vision algorithms that we have tested showed a lower performance than bio-inspired models and there exists fundamental modelling features that could explain those differences. For example, considering type II diamonds stimuli, computer vision algorithms seem too influenced by local edge motions. This is probably due to the scale at which those algorithms operate and we can wonder if it would be solved by multi-scale optical flow algorithms. Indeed, it is one the strength of the models of the visual cortex proposed by, e.g., Bayerl and Neumann(2004);Tlapale et al.
(2010), which is to reproduce the multi-layer architecture of the brain so that the motion information is diffused on a wide range. Another distinguishing feature between the two classes of models is that feature detectors found in the visual cortex (such as junction detectors that prevent occlusion problems) are often found in elaborated visual cortex models Weiss and Adelson (1998);
Berzhanskaya et al.(2007);Bayerl and Neumann(2007).
The second observation is that most models proposed fail to reproduce a proper dynamical properties which are comparable to the visual system. Very few data concerning psychophysical, oculo-motor, or neural dynamics were avail-able when algorithms were proposed, so that models are often static, i.e. they only consider a pair of frames, or they converge towards the final percept with an arbitrary non-plausible dynamics. With respect to this criterion, it is the model described byTlapale et al.(2010) that gives the best results so far, based on recent neuronal, psychophysical, and behavioural findings Pack and Born
(2001);Pack et al.(2004);Masson and Stone(2002);Wallace et al.(2005).
5.2
Extending the methodology
Although proposing new approaches to evaluate current state-of-the-art models the proposed evaluation methodology is still extensible. For instance, it is well known in the literature that most of the motion stimuli are multi-stable. In the case of drifting plaids, one can perceive either two gratings with different velocities, or one single plaid motion Hup´e and Rubin (2003). Incorporating this multi-stability in models is still only at the sketch level in models Giese
(1998);Veltz and Faugeras(2009);Tlapale et al.(2010), and mostly ignored in motion benchmarks.
Among the considered stimuli, various properties affecting the motion integ-ration mechanisms are still ignored. For instance, disparity used in binocular experiments is still missing. However some models already use binocular cues as a way to depth-order motion information Beck and Neumann(2010). Another property ignored herein is the contrast. In a wide range of psychophysical and neurobiological stimuli, the contrast is shown to have a considerable effect on motion integration. For instance the receptive field size in area V1Sceniak et al.(1999) and area MT changes with contrastPack et al.(2005b). Contrast also influences behavioural resultsMasson and Stone (2002);Wallace et al.(2005);
Born et al.(2006a). Those kind of stimuli variations should also be considered in a more comprehensive data set.
A bio-inspired evaluation methodology for motion estimation 16
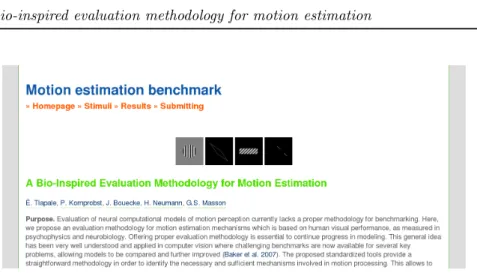
Figure 3: Screen shot of the website associated with the presented evaluation methodology. The full stimuli database as well as scoring instructions and res-ults can be found on it.
Acknowledgements
The authors particularly thank Pascal Mamassian for enriching thoughts re-lated to this project. This research work has received funding from the European Community’s Seventh Framework Programme under grant agreement N°215866, project SEARISE and the R´egion Provence-Alpes-Cˆote d’Azur. GMS was sup-ported by the CNRS, the European Community (FACETS, IST-FET, Sixth Framework, N°025213) and the Agence Nationale de la Recherche (ANR, NAT-STATS).
References
Adelson E, Bergen J (1985) Spatiotemporal energy models for the perception of motion. Journal of the Optical Society of America A 2:284–299.
Baker S, Scharstein D, Lewis J, Roth S, Black M, Szeliski R (2007) A database and evaluation methodology for optical flow In International Conference on
Computer Vision, ICCV’07.
Barron J, Fleet D, Beauchemin S (1994) Performance of optical flow techniques.
IJCV 12:43–77.
Barthelemy F, Vanzetta I, Masson G (2006) Behavioral receptive field for ocular following in humans: dynamics of spatial summation and center-surround interactions. Journal of neurophysiology 95:3712.
Bayerl P, Neumann H (2004) Disambiguating visual motion through contextual feedback modulation. Neural Computation 16:2041–2066.
Bayerl P, Neumann H (2007) Disambiguating visual motion by form-motion in-teraction—A computational model. International Journal of Computer
Vis-ion72:27–45.
Beck C, Neumann H (2010) Interactions of motion and form in visual cortex – a neural model. Journal of Physiology - Paris 104:61–70.
Berzhanskaya J, Grossberg S, Mingolla E (2007) Laminar cortical dynamics of visual form and motion interactions during coherent object motion perception.
Spatial Vision20:337–395.
Biber U, Ilg U (2008) Initiation of smooth-pursuit eye movements by real and illusory contours. Vision research 48:1002–13.
Born R, Pack C, Ponce C, Yi S (2006a) Temporal evolution of 2–dimen-sional direction signals used to guide eye movements. Journal of
Neuro-physiology95:284–300.
Born R, Pack C, Ponce C, Yi S (2006b) Temporal evolution of 2-dimensional direction signals used to guide eye movements. Journal of
neuro-physiology95:284–300.
Castet E, Charton V, Dufour A (1999) The extrinsic/intrinsic classification of two-dimensional motion signals with barber-pole stimuli. Vision Re-search39:915–932.
Cesmeli E, Lindsey D, Wang D (2000) An oscillatory correlation model of human motion perception In Neural Networks, 2000. IJCNN 2000, Proceedings of
the IEEE-INNS-ENNS International Joint Conference on, Vol. 4.
Farneb¨ack G (2001) Very high accuracy velocity estimation using orientation tensors, parametric motion, and simultaneous segmentation of the motion field In Proc. Eighth International Conference on Computer Vision, Vol. 1, pp. 171–177. Citeseer.
Giese M (1998) Dynamic Neural Field Theory for Motion Perception Springer. Grossberg S, Mingolla E, Pack C (1999) A neural model of motion processing
and visual navigation by cortical area MST. Cerebral Cortex 9:878–895. Horn B, Schunck B (1981) Determining optical flow. Artificial
Intelli-gence17:185–203.
Huang X, Albright T, Stoner G (2008) Stimulus dependency and mechanisms of surround modulation in cortical area MT. Journal of Neuroscience 28:13889. Hup´e J, Rubin N (2003) The dynamics of bi-stable alternation in ambiguous
motion displays: a fresh look at plaids. Vision Research 43:531–548.
Kooi T (1993) Local direction of edge motion causes and abolishes the barber-pole illusion. Vision Research 33:2347–2351.
Lorenceau J, Shiffrar M, Wells N, Castet E (1993) Different motion sensitive units are involved in recovering the direction of moving lines. Vision
Re-search33:1207–1217.
Lucas B, Kanade T (1981) An iterative image registration technique with an application to stereo vision. Proceedings of Imaging understanding
work-shoppp. 121–130.
Masson G, Ilg U, editors (2010) Dynamics of Visual Motion Processing Neur-onal, Behavioral, and Computational Approaches. Springer Verlag, 1 edition.
A bio-inspired evaluation methodology for motion estimation 18
Masson G, Rybarczyk Y, Castet E, Mestre D (2000) Temporal dynamics of motion integration for the initiation of tracking eye movements at ultra-short latencies. Visual Neuroscience 17:753–767.
Masson G, Stone L (2002) From following edges to pursuing objects. Journal
of neurophysiology88:2869.
Montagnini A, Mamassian P, Perrinet L, Castet E, Masson G (2007) Bayesian modeling of dynamic motion integration. Journal of Physiology-Paris . Pack C, Born R (2001) Temporal dynamics of a neural solution to the aperture
problem in visual area MT of macaque brain. Nature 409:1040–1042. Pack C, Gartland A, Born R (2004) Integration of contour and
termin-ator signals in visual area MT of alert macaque. The Journal of
Neuros-cience24:3268—3280.
Pack C, Hunter J, Born R (2005a) Contrast dependence of suppressive influences in cortical area MT of alert macaque. Journal of Neurophysiology 93:1809. Pack C, Hunter J, Born R (2005b) Contrast dependence of
suppress-ive influences in cortical area MT of alert macaque. Journal of Neuro-physiology93:1809–1815.
Sceniak MP, Ringach DL, Hawken MJ, Shapley R (1999) Contrast’s effect on spatial summation by macaque V1 neurons. Nature Neuroscience 2:733—-739. Seri`es P, Georges S, Lorenceau J, Fr´egnac Y (2001) A network view of the structure of center/surround modulations of V1 receptive field properties in visual and cortical spaces. Neurocomputing 38:881–888.
Simoncelli E, Heeger D (1998) A model of neuronal responses in visual area MT. Vision Research 38:743–761.
Tlapale ´E, Masson G, Kornprobst P (2008) Motion integration modulated by form information In NeuroComp.
Tlapale ´E, Masson G, Kornprobst P (2010) Modelling the dynamics of mo-tion integramo-tion with a new luminance-gated diffusion mechanism. Vision
Research.
Veltz R, Faugeras O (2009) Local/global analysis of the stationary solutions of some neural field equations Technical report, arXiv.
Wallace J, Stone L, Masson G (2005) Object motion computation for the initiation of smooth pursuit eye movements in humans. Journal of
Neuro-physiology93:2279–2293.
Wallach H (1935) ¨Uber visuell wahrgenommene Bewegungsrichtung.
Psycholo-gical Research20:325–380.
Weiss Y, Adelson E (1998) Slow and smooth: A Bayesian theory for the com-bination of local motion signals in human vision. Center for Biological and
Computational Learning Paper158.
Centre de recherche INRIA Bordeaux – Sud Ouest : Domaine Universitaire - 351, cours de la Libération - 33405 Talence Cedex Centre de recherche INRIA Grenoble – Rhône-Alpes : 655, avenue de l’Europe - 38334 Montbonnot Saint-Ismier Centre de recherche INRIA Lille – Nord Europe : Parc Scientifique de la Haute Borne - 40, avenue Halley - 59650 Villeneuve d’Ascq
Centre de recherche INRIA Nancy – Grand Est : LORIA, Technopôle de Nancy-Brabois - Campus scientifique 615, rue du Jardin Botanique - BP 101 - 54602 Villers-lès-Nancy Cedex
Centre de recherche INRIA Paris – Rocquencourt : Domaine de Voluceau - Rocquencourt - BP 105 - 78153 Le Chesnay Cedex Centre de recherche INRIA Rennes – Bretagne Atlantique : IRISA, Campus universitaire de Beaulieu - 35042 Rennes Cedex Centre de recherche INRIA Saclay – Île-de-France : Parc Orsay Université - ZAC des Vignes : 4, rue Jacques Monod - 91893 Orsay Cedex
Éditeur
INRIA - Domaine de Voluceau - Rocquencourt, BP 105 - 78153 Le Chesnay Cedex (France)