HAL Id: cea-01495020
https://hal-cea.archives-ouvertes.fr/cea-01495020
Submitted on 23 Jun 2020
HAL is a multi-disciplinary open access
archive for the deposit and dissemination of
sci-entific research documents, whether they are
pub-lished or not. The documents may come from
teaching and research institutions in France or
abroad, or from public or private research centers.
L’archive ouverte pluridisciplinaire HAL, est
destinée au dépôt et à la diffusion de documents
scientifiques de niveau recherche, publiés ou non,
émanant des établissements d’enseignement et de
recherche français ou étrangers, des laboratoires
publics ou privés.
Very high resolution study of high Rydberg levels of the
configurations 4f
14
6snd of Yb I
Luc Barbier, René-Jean Champeau
To cite this version:
Luc Barbier, René-Jean Champeau.
Very high resolution study of high Rydberg levels of the
configurations 4f
146snd of Yb I. Journal de Physique France, 1980, 41 (9), pp.947 - 955.
Very
high
resolution
study
of
high
Rydberg
levels
of the
configurations
4f14
6snd of Yb I
L. Barbier and R.-J.
Champeau
Laboratoire Aimé Cotton, C.N.R.S. II (*), Batiment 505, F 91405 Orsay Cedex, France
(Reçu le 17 mars 1980, accepté le 8 mai 1980)
Résumé. 2014 Les niveaux de
Rydberg élevés de l’ytterbium ont été étudiés sur un jet d’atomes métastables. Les niveaux de la série 4f14 6snd ont été peuplés à
partir
du niveau métastable 4f14 6s 6p3P0
grâce à la lumière ultra-violette d’ùn laser à colorant monomode double enfréquence
et détectés par la méthode d’ionisation par unchamp
électrique. Les champs critiques d’ionisation Fc des niveaux 4f14 6snd3D1
(24 ~ n ~ 57) ont été mesures; ils obéissent à la loi ducol(Fc =
(16n*4)-1).
Les structureshyperfines
des isotopes impairs ont été analysées; commel’interaction
hyperfine
est du même ordre de grandeur que les interactions électrostatiques etspin-orbite
(ou même pour les valeurs de n les plus élevéesplus importantes
que ces dernières), ces structures ont un aspect trèsparticulier.
Les structures observées ont été interprétées théoriquement par la méthode paramétrique de Slater-Condon. Les influences respectives de l’électron optique excité (nd) et de l’électronoptique
non excité (6s) ont ainsi pu êtreétudiées. De
plus, l’influence
d’un niveau de valence perturbant seulement les composantes des isotopes impairsa été mise en évidence pour le nombre quantique n = 26.
Abstract. 2014
High Rydberg levels of ytterbium were studied in a beam of metastable atoms. Levels of the series 4f14 6snd were populated from the metastable 4f14 6s
6p
3Po
level by means of the U.V. light of afrequency-doubled single-mode dye laser and detected using the field ionization technique. The critical ionization fields Fc
of the levels 4f14 6snd
3D1
(24 ~ n ~ 57) were measured and found to obey the saddle point law(Fc =
(16n*4)-1).
Thehyperfine
structures of the oddisotopes
were investigated. They are very peculiar due to the fact that thehyperfine
interaction is of the same order of magnitude as (or even for the highest n values, much moreimportant
than) the spin-orbit and electrostatic interactions. A theoretical account of the observed structures using the Slater-Condon parametric method is given. The relative influence of the excited (nd) and of the non-excited (6s) optical electron could thus be studied. Furthermore the influence of a valence levelperturbing
only the oddisotopes
components for n = 26 was demonstrated.
Classification Physics Abstracts 32.20J - 32.60
1. Introduction. -
During
the last few years, thestudy of high lying Rydberg
levels of atoms has becomea field of
increasing
interest in atomic spectroscopy.The spectra of one-electron atoms have been the
subject
of a verylarge
amount ofexperimental
and theoretical work.Comparatively,
rather few veryhigh-resolution
studies have beenperformed
onmany-electron atoms. Technical as well as theoretical difficulties
easily
explain
this fact. However thestudy
of
high Rydberg
levels ofmany-electron
atoms isparticularly
interesting
because of thespecific
cha-racteristics
they
possess :(i)
theirproperties
are influencedby
the presenceof the non-excited
optical
electrons ;
(ii)
in the energy range wherehigh
Rydberg
levelsare located there can also exist levels
belonging
to(*) Laboratoire associé à 1Université Paris-Sud.
doubly
excited electronicconfigurations
that interact with the usualRydberg
series,
thusleading
to theso-called
perturbed
series.The purpose of this work on the
ytterbium
atomwas to
investigate
the twoforegoing
phenomena
and moreprecisely
toinvestigate
their influence on thecritical ionization fields and on the
hyperfine
struc-tures of the
Rydberg
levels.2.
Energy
spectrum
ofytterbium
I. - The atomicnumber of
ytterbium
is 70. Ytterbium possesses sevenstable
isotopes
with mass numbersranging
from 168to
176 ;
thecorresponding
natural relative abundancesare
given
in table I. The nuclearspins
of "’ Yb
and of"3Yb
are1/2
and5/2 respectively.
A part of the level scheme of Yb 1 is
given
infigure
1.For some of the levels of Yb 1 located below the first ionization limit
and,
inparticular,
for theRydberg
series
converging
towards thislimit,
the 4f shell is948
Table 1. -
Isotopic composition
of
naturalytterbium.
Fig. 1. - Part of the level-scheme of Yb 1
showing the levels of interest for the present experiment. The metastable 4f " 6s 6p
3Po
level is populated inside the atomic beam by means of a discharge.High Rydberg levels belonging to the configurations 4f 14 6snd are
excited from this level by the U.V. light of a frequency-doubled
dye-laser. Atoms in the other, higher lying, metastable levels are
directly photoionized by the U.V. beam.
closed : these levels can be considered as
being
thoseof a two-electron atom. The other levels below the first ionization limit are those of a four-electron
spectrum
(in
fact one hole in the 4f shell and threeelectrons in other open
shells).
3.
Expérimental
set-up.
- Theexperimental set-up
we used for
studying high Rydberg
levels ofytterbium
is
quite
analogous
to that describedby
H. T.Duong,
S. Liberman and J. Pinard in their work on
rubi-dium
[1].
The atoms of a beam are excitedby
afre-quency-doubled
single-mode dye
laser[2] (this
laser isbasically
a CWdye
laser but it ispumped
simulta-neously by
a CWargon-ion
laser andby
apulsed
NdYag laser)
providing
U.V.pulses
of 50 Wpeak
powerand 50 ns duration with a
repetition
rate ofapproxi-mately
50 Hz. Atomic - and laser - beamscross at
right
angle
so as to get rid of theDoppler broadening
of the lines.By
those means, both veryhigh
resolution andgood efficiency
can be achieved.In
fact,
due to the ratherhigh
value of the ionizationenergy of
ytterbium,
the atoms cannot be exciteddirectly
from theground
levelby
thefrequency-doubled laser beam as was done in the rubidium
experiment
[1].
We therefore had to takeadvantage
of the existence of metastable levels
(Fig.
1).
These levels can beefficiently
populated
inside the atomicbeam itself
by
means of adischarge
produced
at theexit aperture of the oven
[3].
The energy differencebetween the
Rydberg
levels understudy
and themetastable level 4f 14 6s
6p
3pO
is about 33 000 cm-l.The
corresponding wavelength
close to 600 nm, beforefrequency doubling,
is in thespectral
range of Rhoda-mine 6 Gdye
lasers ;
single-mode
CWdye
lasers areparticularly
easy to operate in thisspectral region.
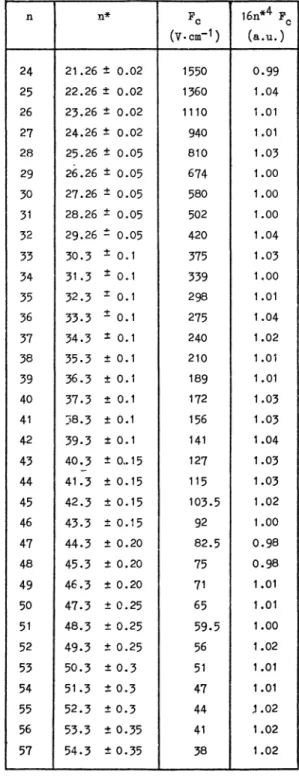
Table II. - Critical ionization
fields
in the series4f146snd
3D
1of
Yb 1. The valuesof
the criticalionization
fields
(Fc)
aregiven
as afunction
of
theprincipal
quantum number(n)
orof
theeffective
princi-pal
quantum number(n*).
The relativeuncertainty
on the measured
Fc
values is about 2%.
Thequantity
in the last column
(16
n*4Fe)
isexpressed
in atomicunits ;
according
to the classical(saddle-point) formula,
thisquantity
should beequal
to 1.The excited atoms are detected
by
the field ioni-zationtechnique [1, 4].
Thepositive
ionsresulting
from the field ionization process are acceleratedby
the
ionizing
field and collectedby
the firstdynode
ofan electron
multiplier.
Thepulses
provided
by
themultiplier
are countedduring
the aperture time of agate, the
delay
and duration of which areadjusted
so that the ions of interest are all counted whereas theparasitic
counts arerejected
asthoroughly
aspossible.
The excitation spectrum we have
investigated
corresponds
to the line series :4f 14
6s6p
3Po-4f14
6sndF,
Fbeing
the totalangular
momentum ofthe atom
(electrons
+nucleus).
4. Critical ionization fields. - The critical
ioniza-tion fields of all levels with n
ranging
from 24 to 57have been measured. The results are
given
in table II.As is well
known,
in a classicalpicture
the value ofthe critical ionization
field,
Fc,
corresponding
to a level with effectiveprincipal
quantum number n* isgiven
in atomic unitsby
the formula :Fc
=1/16
n*4.This limit
corresponds
to the value of thepotential
energy at the saddlepoint
of thepotential
energysurface of the atom submitted to a static electric
field F.
To check the saddle
point
formula,
the n* values areneeded. For the lowest n values
(24 n 33), they
were deduced from the measurement of the
wave-length
of the laser in resonance with the transition understudy ;
forhigher n
values(n
>33)
we used n*values derived from the work of P.
Camus,
A. Débarreand C. Morillon
[5].
According
to the saddlepoint
formula,
thequantity
a =
Fe X 16
n*4
shouldequal
1 forevery level.
This was verified
by
plotting
the measured a values versus n infigure
2. As can be seen the law isobeyed
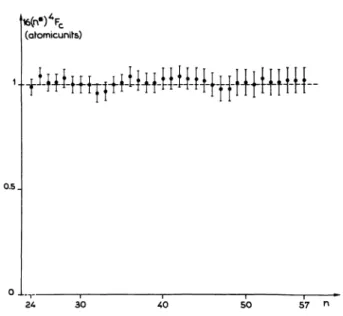
Fig. 2. - Check of the
saddle-point formula relating the critical ionization field F, to the effective principal quantum number n* of the level of interest. For every investigated level, the quantity
16(n*)4 Fc which should equal 1 (in atomic units) according to the classical theory has been plotted versus n.
within the
experimental
uncertainties for allinvesti-gated
levels. This is not toosurprising
since none ofthese levels turned out to be
perturbed.
Infact,
as we shall see inparagraph
11,
the levels n = 26 areslightly perturbed
butonly
for the oddisotopes.
However,
critical field measurementsperformed
on these components do not show any noticeablediffe-rence with the values measured on the
unperturbed
even
isotope
levelscorresponding
to the same valueof n. But it must be
kept
in mind that first the pertur-bation isonly
weak and second critical fieldmeasu-rements made on the odd
isotopes
are not veryprecise
due to the weakintensity
of thesignal (cf.
§"5).
5.
Hyperfine
structure measurements. -By
scann-ing continuously
thefrequency
of thelaser,
one canrecord the structure of the transition under
study.
Figure
3gives typical
recordings corresponding
to the levels n = 30 and n = 38.The most intense components near the centre of
each
recording
are due to the evenisotopes ;
in the direction ofincreasing
wavenumbers,
onesuccessively
finds
17°Yb,
172Yb,
174Yb
and176Yb.
The linewidth of asingle
component isapproximately
60 MHz dueto the
spectral
width of the laserlight
and to theresidual
Doppler
broadening corresponding
to thedivergence
of the atomic beam. Theremaining,
lessintense,
components make up the structure of the oddisotopes.
Theintensity
of the weakest recordedcomponent
is less than 1%
of the totalintensity
of theline.
For
measuring
the distances between the compo-nents of the structure, the wavenumber scale of therecordings
was calibratedby simultaneously
recording
the
fringes
of aspherical
Fabry-Pérot
interferometerproviding
frequency
markers with an interval of1.5 GHz
(Fig.
3).
Theposition
of agiven
componentis obtained
by
a linearinterpolation
between the twoadjacent
referencefringes.
Theposition
of allcompo
nents are referred to the component of the
isotope
176Yb
.The uncertainties in the
position
measurementshave two
origins :
the noise and other fluctuations(of
the atomic andlaser-beams)
and thenon-linearity
of thescanning
of the laserfrequency.
For the oddisotopes
components theuncertainty
is estimated tobe
approximately
3mK ;
for the components of theeven
isotopes
which are more intense and less distantfrom one
another,
theuncertainty
isonly
1 mK.The final results are
given
in table III and aplot
ofthe structures of all recorded transitions is
given
onfigure
4. The structures of the four evenisotopes
remain
remarkably unchanged
as nvaries ;
in contrast, one observes that those of the oddisotopes
change
considerably
as n isincreasing ;
inparticular,
thestructures become much
simpler
for thehighest n
values,
as will beexplained
in the next section. One should also notice that the structureschange
smoothly
950
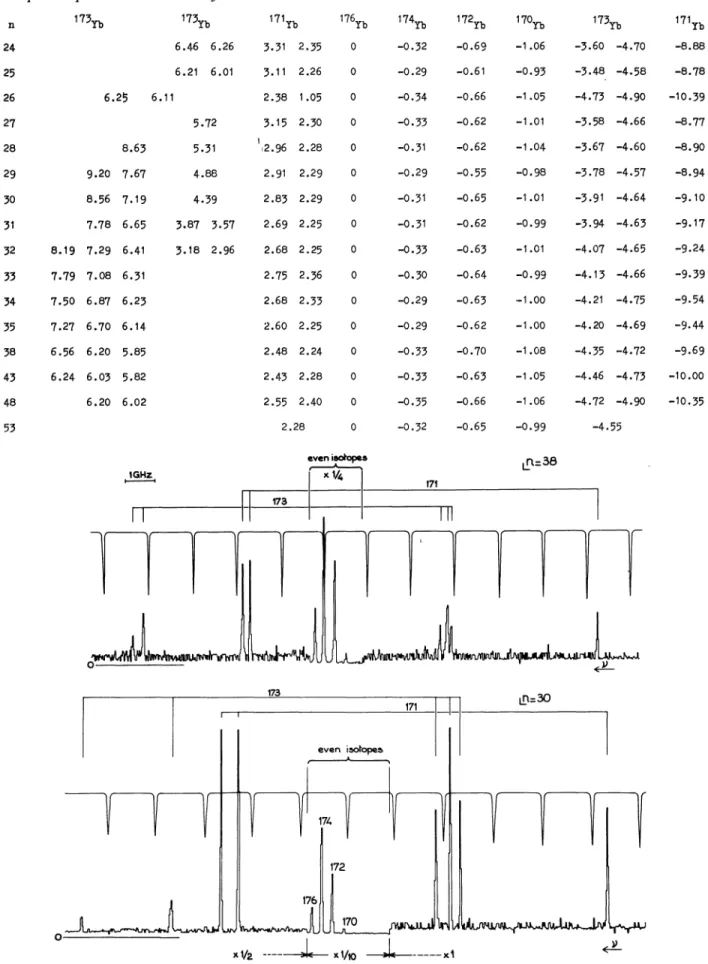
Table III. - Structures
of Rydberg
levelsbelonging
to theconfigurations
4f"
6snd. Thepositions
of
the recorded componentsreferred
tothe 176Yb
component areexpressed
in GHz. Each lineof
the tablecorresponds
to agiven
value
of
theprincipal
quantum number n. Each column in the tablecorresponds
to a groupof
components as itappears in the
recording (see
Figs.
3 and4).
Theexperimental
uncertainty
isapproximately
0.03 GHzfor
the evenisotopes
components and 0.1 GHzfor
the odd ones.Fig. 3. - Recordings of the structures of the transitions 4f14 6s 6p
3Po-4f14
6s 30d and 4fi4 6s 6p3Po-4f14 bs
38d F. In the region of theeven isotopes, the ordinates have been divided by 10 in the first recording, by 5 in the second one. In the former recording the components
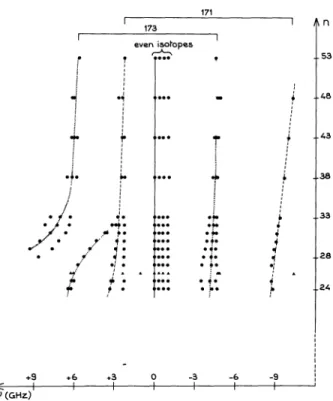
Fig. 4. - Plot of the recorded
structures. For the perturbed n-26
level, triangles are used instead of circles for representing the
components of the structure.
this is due to the presence of a
perturbing
level(cf.
§ 11).
6. Interactions
responsible
for the level structure.-For the considered
transitions,
4f 14 6s6p
3Po-4f 14 6snd,
the structure isentirely
due to the upperlevel ; the lower level
having
J = 0 issimple
even inthe case of the odd
isotopes.
In order to understand the observed structures, it is first necessary to list the relevant interactions. There are three main
perturbing
terms in the hamil-tonian :(i)
the electrostatic interaction between thetwo
optical
electrons G =e2/r 12,
where e is theelectron
charge
and rl2 the relative distance of thetwo
electrons,
(ii)
thespin-orbit
interactionwhere
li
and s, are the orbital andspin
angular
momenta of electron i and
ç(ri)
a scalar function ofthe
distance r;
of electron i from theorigin,
(iii)
themagnetic
hyperfine
interaction(Fermi
contactterm)
which can be accounted for
by
the effective operatorH.
=as I.
ss, whereas is a constant
(hyperfine splitting
factor of the 6s
electron),
1 the nuclearspin
and ss thespin
angular
momentum of the 6s electron.Other
interactions,
e.g. themagnetic
dipole
and electricquadrupole
hyperfine
interactions associated with the nd electron as well as thespin-spin
andspin-other-orbit interactions are
supposedly
negligible.
For each of the
important
operators,only
oneradial
integral
plays
a role in the level structure of theconfiguration
4f14 6snd : the Slaterintegral G2(6s,
nd)
for operatorG,
thespin-orbit
intervalfactor
of the ndelectron,
(nd,
for operator A and the constant as foroperator
Hm.
The radial function of the nd electron is involved in the first two parameters, G2 and
(,,d,
but not, ofcourse, in the third one, as. In a
hydrogenic
picture,
it is well known that
(nd
varies as(n*) - 3
withincreasing
n ; it can be shown that
G2
alsoobeys
the same law.In contrast, the parameter a.
only depends
on thewavefunction of the 6s
electron,
moreprecisely
as isproportional
to theprobability
density
of this electronat the nucleus. For the values of n that have been
investigated,
theprobability
density
of the nd electron near the nucleus is verysmall ;
as a consequence thescreening
effectproduced
by
the nd electron on the 6selectron is
negligible ;
therefore with verygood
accu-racy as has the same value for all
investigated high
Rydberg
lévels and also for theground
level4f 14 6s
2S 1/2
of Yb II.7.
Qualitative
interprétation
of the structures of thehighest
levels. - Theprevious
considerations enablethe structures encountered for the
highest n
valuesto be understood. For these cases the interactions G and A can be
neglected
as a firstapproximation.
Foreach odd
isotope,
theconfiguration
4f14
6snd is thussplit
into two levels whose interval should beequal
to as
x(I
+1/2)
as theground configuration
4f14
6s of Yb II, whosehyperfine
structure was measuredby
Chaiko
[6].
These values arecompared
in table IV with thecorresponding
values that we have measuredTable IV. -
Comparison
of
the structuresof
theRydberg
levels4f14
6s 53d and4f14
6s 48d with thehyperfine
structureof
theground
level4f14
6s2S1/2
of
Yb II. All values aregiven
in GHz.Hyperfine splitting
(GHz)
in the
configurations
4f14 6s 48d and 4f14 6s 53d.For each
isotope,
the values are rather close to oneanother,
thusgiving
a strong support to the952
8. Theoretical
interprétation
of theexperimental
resultsby
theparametric
method. - Togive
aquanti-tative theoretical account of all the measurements
we have made use of the
semi-empirical
Slater-Condonparametric
method.It must be first recalled that the
hyperfine
operatorHm
does not commute with the totalangular
momen-tum J of the electrons.
As,
furthermoreHm
is notsmall
compared
to G and A, none of the usualcoupling
schemes
(e.g.
Russell-Saunders, jj
and also J - Ifor the
coupling
between electrons andnucleus)
corresponds
to thephysical
situation ;
for the oddisotopes,
even J is not agood
quantum number.Except
for thehighest n
values(see § 7),
none of the threeperturbing
hamiltoniansG,
A andHm
can be considered as much moreimportant
than the other two ; we have therefore to consider the entireconfi-guration
4f14
6snd as theunperturbed
level and tohandle the total
perturbation
H’ =H.
+ G + Aas a whole.
To
apply
theparametric
method,
the matrix of the hamiltonian H’ is builtusing
the basis set14f14
6snd(SLJ,
I) FMF >. By diagonalizing
thismatrix,
one obtains theperturbed
energy levels thatdepends
onparameters
(d,
G2,
as(171), as(173)
and one additional constant(ADD(171)
orADD(173))
foreach odd
isotope. Physically
each of the last two constants determines theposition
of the structureof one odd
isotope
with respect to thecorresponding
level of116 Yb
taken as reference.The
parameters
are fitted to theexperimental
valuesby
comparing
the theoretical andexperimental
values of the energy. Infact, only G2(6s, nd), ’ncb
ADD(171)
andADD(173)
werefree;
the two para-metersas(171)
andas(173)
were fixed to the valuesthey
assume in the
ground
level of YbII,
respectively
12.7 GHz and 3.51 GHz. In the
fitting procedure,
the levels of the two odd
isotopes
were treatedsimul-taneously
so as to avoid that the parametersG2
and,,d
which have noisotopic dependence
take different values for the twoisotopes.
9. Results. - For all
investigated
levels,
except
n = 26 and n
= 48,
asatisfactory
agreement between
experiment
andtheory
has been achieved since the mean square difference betweenexperimental
and theoretical values of the energy levels isapproximately
equal
to theexperimental uncertainty.
We first comment on the
special
cases. For n =48,
the
fitting procedure
did not converge : this may be due to the fact that the values ofG2
and’nd
are notlarge enough
incomparison
to theexperimental
uncertainties. The case of n = 26 which isperturbed
will be discussed in
paragraph
11. For n =53,
theobserved structure can be
interpreted
by
putting
G2 = (d
= 0(cf. § 6).
The final values of the parameters
G2
and’nd
obtained for all the otherinvestigated n
values arelisted in table V. These values are
plotted
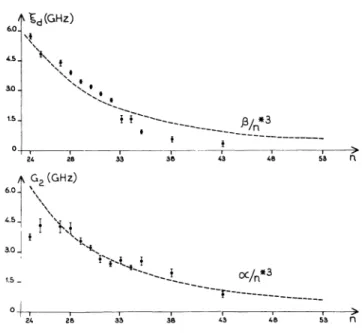
versus nTable V. - Values
of
the parametersG2
and’d
for
theconfigurations
4f14
6snd as afunction of
theprincipal
quantum number n. These values aregiven
inGHz.
in
figure
5. As can be seenthey
follow ratheraccurately
an
(n*)-3
law,
in agreement withtheory (cf. §6).
However,
a sudden decrease of the valuesof (d
andG2
is observed at n =
33 ;
this isobviously
related to thequalitative
change
in the recorded structures(in
particular
thecomponents
for173Yb
located on thelarge
wavenumbersside)
which can be noticed inFig. 5. - Evolution with n of the
parameters G2 and ’do In a
hydro-genic scheme, the parameters G2 and ’d should vary like (n*)- 3. To check this, we have drawn on each diagram (dotted line) the
graph of the function (n*)- 3 multiplied by the factor a (resp. fui
which provides the best agreement with the values obtained for G2
figure
4 for the same value of n but noexplanation
ofthis
phenomenon
could be found.For a
given
n, the values obtained forG2(6s,
nd)
and
(00
areapproximately
equal.
This is at first rathersurprising
because Hartree-Fock calculations of the ratio(nd/G2 (which
should beindependent
ofn*,
as noticed
above)
performed
in theconfiguration
4f14
6s 6dyield
the value 0.15.But,
on the onehand,
the
configuration
4f14
6s 6d may be not excitedenough
to fit in the normal characteristics of theRydberg
seriesand,
on the otherhand,
for the n values weconsider,
the distance between two successive 6sndconfigurations
is not muchlarger
than the rangeoccupied
by
eachconfiguration
(for
instance,
the distance betweenconfigurations
6s 38d and 6s 39dis 5
cm-1,
the overall width of each structurebeing
0.6
cm-1)
so thatconfiguration
interaction effectsmay be
appreciable.
It is therefore mostprobable
that the values of the parameters are
effective
valuestaking
into account at leastpartially
the effect of suchinteractions. It would be more
appropriate
to treattogether
allconfigurations
6sndusing
the Multi-channelQuantum-Defect
Theory. Unfortunately
theapplication
of theMQDT
method tohyperfine
sublevels is not
straightforward.
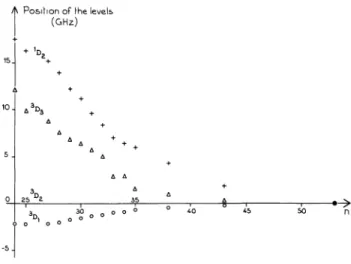
10. Fine structure of the
configurations
4f14
6snd.-Once the values of the parameters
G2 and (00
have been obtained for agiven
n, one can compute the relativeenergies
of the four levels’D2, 3D1, 3D2
and
3D3
withouthyperfine
structureby
putting
as = 0in the energy
matrix,
diagonalizing
it andtaking
itseigenvalues.
Theenergies
so obtained areplotted
in
figure
6 with respect to the energy of the level3D
1taken as
origin.
Our measurements allow us to obtain the
complete
level structure
resulting
from the electrostatic andspin-orbit
interactions for allinvestigated
4f " 6sndFig. 6. - Level scheme of the
configurations 4f 14 6snd. The relative positions of the four levels of each investigated configuration
4f 14 6snd (without hyperfine structure) have been obtained as a
result of the parametric analysis of the recorded structures (cf. § 10).
These positions are plotted versus n (the level 3D2 is taken as a
reference).
configurations,
inspite
of the electricdipole
radiation selection rules that prevent the levels3D2, 3D3
and’D2
being
excited from the3Po
level. This ispossible
because,
due to thehyperfine
structureoperator,
theeigenstates
of severalhyperfine
levels of the oddisotopes
contain asignificant
admixture of a statecorresponding
to3D 1.
Nevertheless,
as thepreceding
resultsrely
ontheoretical
assumptions
(interactions
have beenneglected),
it would be worthwhile to have a directexperimental
check of thepreceding
resultsby exciting
the even
isotopes
levelsID2,
3D2
and3D3
andmeasuring
theirenergies.
In order toperform
thosemeasurements, it would be
possible
to choose one ofthe two metastable levels
having
J = 2(Fig. 1)
aslower level instead of the 6s
6p
3Po
level.11. Perturbation of the
configuration
4f14
6s 26d.-As was mentioned before
(cf. § 9),
it was notpossible
togive
a theoreticalinterpretation
of the structure ofthe
configuration
4f14
6s 26d. As canclearly
be seenon the
plot
offigure
4,
this structure does not follow the normal evolution with n. This is due to the presence of aperturbing
level with J = 2belonging
to theconfiguration
4f 13
5d 6s6p
[7]
and located about5
cm-1
above
theconfiguration
4f14
6s 26d. The evenisotopes
levels whoseeigenstates
arepurely
J = 1states are not influenced
by
thisperturber,
but the odd ones can beperturbed
because theireigenstates
contain admixtures of
3D2
or1 D 2
states. Asexpected,
the odd levels are shifted(with
respect to theunshifted
even
levels)
towards lowerfrequencies
as aconse-quence of the
repulsion
of theperturbing
level. Nofurther
analysis
of thephenomenon
wasattempted.
As far as we know this is the first
reported
evidence of the influence of aperturbing
level on thehyperfine
structure of a
high
Rydberg
level.12.
Isotope
shifts. - The shifts of theeven
isotopes
are
given
in table III. Those of the oddisotopes
can be deduced from the theoreticalstudy
of the structures(cf. § 8)
asexplained
inparagraph
10.By definition,
the energy of the
3Dl
level withouthyperfine
structure obtained for eachisotope,
gives
the shift of thatisotope.
The shifts of both oddisotopes
referred to176Yb
aregiven
in table VI.As can be seen the shift of a
given isotope
does notdepend
on n, at least within theexperimental
uncer-tainties. This is not
surprising
because the field effectas well as the mass effect must have
approximately
constant values for all
investigated
transitions. Thefield effect is determined
by
theprobability
density
at the nucleus of the electrons that should remain constant for all n values
(cf. § 5) ;
the normal masseffect
(Bohr
effect)
proportional
to the wavenumber ofthe considered lines varies
only
by
0.01 mK(0.3 MHz),
for an
isotopic
pair
whose mass numbers differenceis
2,
when n varies from 24 to53 ;
it is more difficult to954
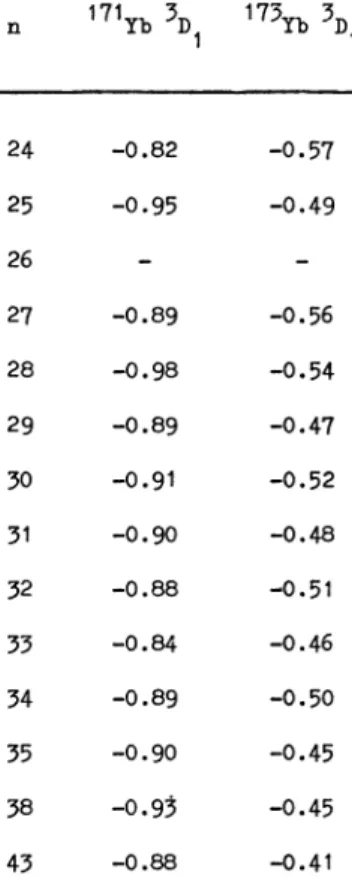
Table VI. -
Isotope
shifts
of
the oddisotopes
of
ytterbium.
In this table aregiven
the positions the levels4f14 6snd
3Dl
of
the oddisotopes
of
Yb would occupyif
thehyperfine
structure were zero ; these values areobtained as
explained
inparagraph
10.They
areexpressed
in GHz andreferred
to thecorresponding
component
of 176Yb.
Theuncertainty
is about 0.1 GHz.but on a theoretical basis this effect is
expected
to besmall and almost constant for all concerned transi-tions
[8].
It is therefore
justified
to take for eachisotope
theaverage values of the shifts of all transitions
(Table VII).
In table VII can also be found the so-called residual shift obtainedby
subtracting
the normal mass effect from the total measured shift.Considering
that theisotope
shifts so obtained are dominatedby
the field
shift,
it isinteresting
to check if their valuescan be
interpreted
in terms of theempirical screening
factors well known in theanalysis
of the field shift[8].
The field shift of each
investigated
transition ispro-portional
to the difference of the 6s electronprobability
densities at the nucleus for the upper and lower
levels ;
it therefore
directly
reflects thescreening
effect of the6p
electron in the level 4f14 6s6p
3Pl
since the nd electron has anegligible screening
effect. It is known from theanalysis
of the fieldisotope
shifts in alarge
variety
of atoms that the presence of a np electron decreases theprobability density
at the nucleus of a nselectron of about 10
%.
If the residual shifts in table VIIwere
entirely
due to fieldeffects, they
should thus beequal
to1/10
of the field effect of a 6s electron that is to say to - 0.10 times the field effect of the resonance lines4f 14 6s-4f 14
6p
of Yb II. The shifts of a transition of this type were measuredby
Chaiko[6]
and the valuescan be found in table VII. As can be seen, the ratio of
the residual shifts of the
Rydberg
lines and of theresonance line of Yb II is in fact - 0.22 instead of
- 0.1. This
disagreement
should not be taken tooseriously
since we haveneglected
thespecific
massshifts in the
Rydberg
as well as in the resonance Yb IIline,
and also because the 10% screening
factor isonly
anapproximate
empirical
value ;
it issatisfactory
that thesigns
and orders ofmagnitude
are inagree-ment.
13. Conclusion. - The values of the critical
ioniza-tion fields we obtained in this work
only
lead to theexpected
results that the classical saddlepoint
law isvalid also in the case
of many
electron atoms. In factas was discussed
above,
the series weinvestigated
isonly slightly
andindirectly
perturbed;
theproblem
of the influence of aperturber
on the critical ionizationfields remains therefore an open one.
The
analysis
of the structures is much more fruitful.It
gives
thepossibility
ofdescribing
the evolution ofthe
hyperfine
structures ofhigh
Rydberg
levels and ofstudying
the relative influence of the excited(nd)
and of the non-excited(6s) optical
electrons on thesestructures.
Furthermore,
the influence of a levelperturbing
only
the oddisotopes
via thehyperfine
interaction has been observed for the first time.Table VII.
- Average
valuesof
theisotope
shifts of
the transitions4f14 6snd-4fl4
6s6p
of
Yb 1. In thefirst
lineof
the table are the average valuesof
themeasured position of
eachisotope
referred
to l’6Yb
and in the secondline the
corresponding
residualshifts.
Forcomparison,
the residualshifts of
the line  = 369 nmof
Yb II aregiven
in the third line
and,
in the lastline,
the ratiosfor
the residualshifts of
theRydberg
lines andof
the Yb II line. Allshifts
are given in GHz.Measured shift
of Rydberg
linesResidual shift of
Rydberg
lines Residual shift for Yb Il  = 369 nmFor the
highest investigated n
values,
we were ableto
reach the limit where all interactionsresponsible
for the structure except thehyperfine
interaction arenegligible.
It would be worthwhile tostudy
thestruc-tures for lower n values in order to reach another
limiting
situation where, as is the more usual case, thehyperfine
interaction becomes smaller than the otherinteractions ;
in this way the evolution of the observedstructure between the two
limiting
coupling
schemes could be followedcompletely.
Acknowledgments.
- It isa
pleasure
for the authorsto thank Drs S. Liberman and J. Pinard who
provided
continuous
help
and adviceduring
theexperiment
and Prof. J. Bauche who took aleading
part in thetheo-retical
analysis.
References
[1] TUAN, D. H., LIBERMAN, S. and PINARD, J., Opt. Commun. 18 (1976) 533.
[2] PINARD, J. and LIBERMAN, S., Opt. Commun. 20 (1977) 344.
[3] BRINKMANN, U., GOSCHLER, J., STEUDEL, A. and WALTHER, H.,
Z. Phys. 228 (1969) 427.
CHILDS, W. J., POULSEN, O. and GOODMAN, L. S., Opt. Lett. 4 (1979) 35.
[4] DUCAS, T. W., LITTMAN, M. G., FREEMAN, R. R. and KLEPPNER,
D., Phys. Rev. Lett. 35 (1975) 366.
AMBARTSUMYAN, R. V., BEKOV, G. I., LETOKHOV, V. S. and
MISHIN, V. I., J.E.T.P. Lett. 21 (1975) 279.
[5] CAMUS, P., DÉBARRE, A. and MORILLON, C., J. Phys. B, to be published.
[6] CHAIKO, Y., Opt. Spektr. 20 (1966) 760.
[7] WYART, J.-F. and CAMUS, P., Phys. Scr. 20 (1979) 43. [8] BLAISE, J. and STEUDEL, A., Z. Phys. 209 (1968) 311.