HAL Id: hal-02872392
https://hal.archives-ouvertes.fr/hal-02872392
Submitted on 17 Jun 2020
HAL is a multi-disciplinary open access
archive for the deposit and dissemination of
sci-entific research documents, whether they are
pub-lished or not. The documents may come from
teaching and research institutions in France or
abroad, or from public or private research centers.
L’archive ouverte pluridisciplinaire HAL, est
destinée au dépôt et à la diffusion de documents
scientifiques de niveau recherche, publiés ou non,
émanant des établissements d’enseignement et de
recherche français ou étrangers, des laboratoires
publics ou privés.
multi-model investigation
D Koch, Yves Balkanski, S. E. Bauer, R. C. Easter, S. Ferrachat, S. J. Ghan,
C. Hoose, T. Iversen, A. Kirkevåg, J Kristjansson, et al.
To cite this version:
D Koch, Yves Balkanski, S. E. Bauer, R. C. Easter, S. Ferrachat, et al.. Soot microphysical effects on
liquid clouds, a multi-model investigation. Atmospheric Chemistry and Physics, European Geosciences
Union, 2011, 11 (3), pp.1051-1064. �10.5194/acp-11-1051-2011�. �hal-02872392�
doi:10.5194/acp-11-1051-2011
© Author(s) 2011. CC Attribution 3.0 License.
Chemistry
and Physics
Soot microphysical effects on liquid clouds, a multi-model
investigation
D. Koch1,2,*, Y. Balkanski3, S. E. Bauer1,2, R. C. Easter8, S. Ferrachat4, S. J. Ghan8, C. Hoose7,10, T. Iversen5, A. Kirkev˚ag5, J. E. Kristjansson10, X. Liu8, U. Lohmann4, S. Menon9, J. Quaas6, M. Schulz3,10, Ø. Seland5, T. Takemura11, and N. Yan3
1Columbia University, New York, NY, USA 2NASA GISS, New York, NY, USA
3Laboratoire des Sciences du Climat et de l’Environnement, Gif-sur-Yvette, France 4Institute of Atmospheric and Climate Science, ETH Zurich, Switzerland
5Norwegian Meteorological Institute, Oslo, Norway 6Max Planck Institute for Meteorology, Hamburg, Germany
7Karlsruhe Institute of Technology, Institute for Meteorology and Climate Research, Karlsruhe, Germany 8Pacific Northwest National Laboratory, Richland, USA
9Lawrence Berkeley National Laboratory, USA
10Department of Geosciences, University of Oslo, Oslo, Norway 11Kyushu University, Fukuoka, Japan
*now at: Department of Energy, DC, USA
Received: 22 September 2010 – Published in Atmos. Chem. Phys. Discuss.: 13 October 2010 Revised: 17 January 2011 – Accepted: 21 January 2011 – Published: 7 February 2011
Abstract. We use global models to explore the
microphys-ical effects of carbonaceous aerosols on liquid clouds. Al-though absorption of solar radiation by soot warms the atmo-sphere, soot may cause climate cooling due to its contribu-tion to cloud condensacontribu-tion nuclei (CCN) and therefore cloud brightness. Six global models conducted three soot experi-ments; four of the models had detailed aerosol microphysi-cal schemes. The average cloud radiative response to biofuel soot (black and organic carbon), including both indirect and semi-direct effects, is −0.11 Wm−2, comparable in size but opposite in sign to the respective direct effect. In a more idealized fossil fuel black carbon experiment, some mod-els calculated a positive cloud response because soot pro-vides a deposition sink for sulfuric and nitric acids and sec-ondary organics, decreasing nucleation and evolution of vi-able CCN. Biofuel soot particles were also typically assumed to be larger and more hygroscopic than for fossil fuel soot and therefore caused more negative forcing, as also found in previous studies. Diesel soot (black and organic carbon) experiments had relatively smaller cloud impacts with five
Correspondence to: D. Koch ([email protected])
of the models <±0.06 Wm−2from clouds. The results are subject to the caveats that variability among models, and re-gional and interrannual variability for each model, are large. This comparison together with previously published results stresses the need to further constrain aerosol microphysical schemes. The non-linearities resulting from the competition of opposing effects on the CCN population make it difficult to extrapolate from idealized experiments to likely impacts of realistic potential emission changes.
1 Introduction
Black carbon, generated by incomplete combustion of fos-sil and biofuels, is dark and therefore absorbs radiation in the atmosphere and on snow, promoting warming of the air and melting of the snow. Through these mechanisms it con-tributes to global warming. However black carbon, together with other aerosol species, also affects clouds, and these cloud perturbations may alter climate more than the aerosol direct radiative changes do. Black carbon has multiple ef-fects on clouds and some of these are potentially cooling.
However, black carbon (BC) is not emitted in isolation, therefore the climate impacts of black carbon cannot be isolated from co-emitted species. Organic carbon (OC), a brighter and more hygroscopic carbonaceous aerosol species (e.g. Kanakidou et al., 2005), is commonly co-emitted with BC, especially from burning of biofuels. Sulfur dioxide, gaseous precursor to sulfate, may also be co-emitted, par-ticularly in some fossil fuel sources such as coal. Here we loosely refer to BC and OC together as soot and focus par-ticularly on the impacts of soot on some of its cloud effects. We note that soot from fossil fuel generally has smaller OC to BC ratio compared with biofuel, where biofuels sources include combustion of domestic wood, agricultural and ani-mal waste and charcoal (e.g. Bond et al., 2004).
Soot may affect clouds in at least three ways. First, aerosol absorption of solar radiation in the atmosphere perturbs the thermal structure of the atmosphere and changes cloud dis-tribution. This has been called the semi-direct effect and the soot semi-direct effect may either promote or reduce cloud cover, depending upon the altitude of the aerosol relative to the cloud layer and meteorological conditions (e.g. reviewed by Koch and Del Genio, 2010). Second, black carbon par-ticles may act as ice nuclei and change ice or mixed-phase clouds, resulting in positive (e.g. Lohmann and Hoose, 2009 for mixed; Liu et al., 2009 for ice) or negative (e.g. Penner et al., 2009 for ice) cloud effect depending mostly on the back-ground ice nucleation mechanism. In this study we do not consider the effects of BC on ice clouds, but rather focus on the effects of BC on liquid droplets within liquid or mixed phase clouds. We also note that the effects of BC on ice-phase clouds as observed in the field and laboratory are very uncertain (e.g. K¨archer et al., 2007).
Our primary interest is the effect of soot on liquid clouds due to its alteration of the aerosol cloud condensation nu-clei (CCN) population. Increased numbers of CCN generally increase the cloud droplet number concentration (CDNC), which then enhance cloud brightness and possibly increase cloud lifetime, commonly referred to as cloud albedo and lifetime effects (or more generally, indirect effects). The im-pact of soot on CCN may depend on at least four factors. First, soot is a primary particle, meaning that it is emitted in particulate form; secondary aerosols are first emitted as a gas that later converts to particulate form. As a primary particle, soot may increase aerosol number. Secondly, however, soot forms a deposition site for sulfuric acid gas and other sec-ondary species which might otherwise nucleate or condense upon other particles; a soot-sulfate particle may be an infe-rior CCN compared with the alternative particles. Thirdly, the larger the OC to BC ratio, the better its CCN activity due to increased hygroscopicity. Fourthly, larger particles acti-vate more easily, so a tiny (e.g. diesel) particle is less likely to form a CCN than a larger (e.g. biofuel) particle would. Thus, in general, particle activation (conversion of the parti-cle to a CCN) requires that the partiparti-cle be large enough and sufficiently hygroscopic. We rely on global aerosol-climate
models to estimate aerosol indirect effects. In order to study the multiple and complex effects of soot on CCN, models with aerosol microphysics, including information on particle mixing state and size, are required.
Three previous studies using global models with aerosol microphysical schemes have isolated soot indirect effects. Kristjansson (2002) used the NCAR CCM3 and estimated the cloud radiative response (change in cloud radiative ef-fect) to all black carbon (fossil, biofuel and open biomass) to be −0.1 Wm−2. Bauer et al. (2010) performed four soot reduction experiments in the GISS GCM with the MATRIX aerosol microphysical scheme, reducing 50% of all BC, all fossil fuel BC, all biofuel BC and OC, and all diesel BC and OC. The respective cloud radiative responses to soot (in-cluding indirect and semi-direct effects) were −0.12, +0.05,
−0.20 and +0.05 Wm−2 (where we reverse the sign in or-der to provide soot effect rather than soot reduction effect). For all experiments except the biofuel experiment, the cloud droplet number concentration decreased as soot increased because soot provided increased surface for sulfate conden-sation, while reduced soot increased the number of viable CCN. However the biofuel soot was relatively hygroscopic and therefore had a stronger indirect effect. The negative cloud response to the 50% BC experiment was apparently a semi-direct effect. A third study is Chen et al. (2010) in a different version of the GISS model with the TOMAS aerosol microphysical scheme. They calculated a −0.13 and −0.31 Wm−2indirect effect (isolated from semi-direct effects) cloud response to 50% of fossil fuel BC and OC and to 50% of all sources of BC and OC respectively. The stronger response in the second experiment was attributed to the larger sizes of biofuel soot; these particles were proba-bly also more hygroscopic. Another study, Jacobson (2010), used the GATOR model to simulate soot effects on climate. Although he did not isolate the liquid cloud microphysical effects of soot, he did find that biofuel soot increased liq-uid cloud cover while fossil fuel soot decreased cloud cover. These studies (Bauer et al., 2010; Chen et al., 2010; Jacob-son, 2010) found that the cloud response is more negative for biofuel compared with fossil fuel soot. However while Chen et al. (2010) calculated negative response for both fossil fuel and biofuel, Bauer et al. (2010) and Jacobson (2010) found positive response to fossil fuel.
If the BC indirect effect is sufficiently negative, this cloud response could cancel much of the direct radiative benefits of BC reduction. Given the variety of results from the previ-ous soot indirect effect studies and the uncertainties associ-ated with the aerosol microphysical schemes and in the indi-rect effect generally, it is helpful to consider multiple mod-els’ clouds responses to soot. Here we analyze and com-pare the responses of six models (including that of Bauer et al., 2010) to reductions of black carbon using three different soot-reduction experiments.
This study is largely a follow-up to the earlier AeroCom study of Quaas et al. (2009) that considered the liquid cloud
Table 1. Soot emissions (not included are the non-soot emis-sions: sulfur (145 Tg S y−1 for 2000 and 34 Tg S y−1for 1750), dust (1680 Tg y−1), sea-salt (7900 Tg y−1) and 14 Tg OC from nat-ural terpene sources).
Description BC Emission OC Emission OC/BC
Tg yr−1 Tg yr−1
Fossil fuel (reduced in FF) 3.0 0. 0
Biofuel (reduced in BF) 1.6 6.4 4
Diesel (reduced in D) 1.3 0.5 0.4
Biomass burning in 2000 3.1 24 7.7
Biomass burning in 1750 1.0 9 9
Year 2000 total particulate (PD) 7.7 32.9 6.1
Year 1750 total particulate (PI) 1.4 9.7 17
indirect effect response to all aerosols in ten global models, and compared these responses to satellite retrievals. The study indicated a positive relation between cloud droplet number concentration (CDNC) and aerosol optical depth (AOD) that was generally well captured by the models. The models generally overestimated a positive relation between cloud liquid water path (LWP) and AOD, suggesting possible deficiencies in their cloud water conversion to rain, or auto-conversion parameterizations. On the other hand, the models generally underestimated the positive relation between cloud cover (CC) and AOD. The modeled global mean cloudy sky forcing due to all aerosols, scaled to the satellite CDNC-AOD regression slopes, was −1.2 ± 0.4 Wm−2.
2 Experimental design 2.1 Experiments
The model experiments for the full year 2000 and pre-industrial are as defined in Quaas et al. (2009). All of the models participated in the Quaas et al. (2009) experiments, however many of them have evolved since.
Six models performed the three soot-reduction experi-ments. The models’ analyses were based on five-year ex-periments, following one year of spin-up (four months for CAM-Oslo). Climatological sea-surface temperatures were prescribed, so that spin-up was only needed for the aerosol concentrations, and several months is sufficient for this. Ta-ble 1 provides the BC and OC emissions for each experiment. The first (FF) reduced all fossil-fuel BC and is therefore an idealized experiment of an extreme impact of BC on indi-rect effects. The second (BF) reduced all biofuel BC and OC and is also idealized especially because it is a partic-ularly large reduction; however it is more realistic because biofuel BC and OC are typically co-emitted. The third (D) reduced diesel BC and OC. The OC to BC ratio is 4 and 0.4 for the biofuel and diesel emissions, respectively. The emis-sions are from Dentener et al. (2006), including
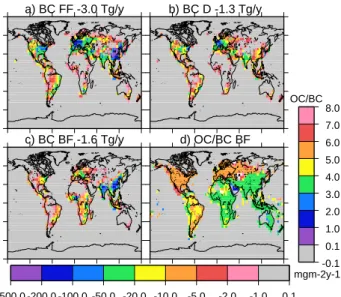
a) BC FF -3.0 Tg/y b) BC D -1.3 Tg/y c) BC BF -1.6 Tg/y d) OC/BC BF -500.0 -200.0 -100.0 -50.0 -20.0 -10.0 -5.0 -2.0 -1.0 0.1 mgm-2y-1 -0.1 0.1 1.0 2.0 3.0 4.0 5.0 6.0 7.0 8.0 OC/BC
Fig. 1. Emission reductions for the three experiments (scale below): (a) fossil fuel BC, (b) Diesel BC, (c) Biofuel BC and (d) the ratio
OC/BC that is reduced in the biofuel experiment (scale on side).
ceous aerosol pollution emissions from an updated version of Bond et al. (2004). Other aerosol species emissions that are unchanged in the experiments include sulfur (145 Tg S y−1 for 2000 and 34 Tg S y−1for 1750), dust (1680 Tg y−1) and sea-salt (7900 Tg y−1), with most sulfur emitted as gaseous SO2 that then oxidizes to form sulfate. Most models as-sume that secondary organic aerosols are emitted as partic-ulate OC (14 Tg y−1); CAM-PNNL includes secondary or-ganic aerosol (SOA) formation from reversible SOA conden-sation integrated over the size distribution of each mode.
Figure 1 shows the global distributions of the soot emis-sions reduced for the FF, BF and D experiments. The largest reductions occur for FF in southeast Asia, Europe and east-ern North America and for BF in south and southeast Asia and for D in Europe. Figure 1d has the global distribution of the ratio of OC to BC for biofuel. Biofuel OC/BC is largest in North America and Europe, followed by South America and then by Asia and Africa. The OC/BC ratio for diesel does not vary as much geographically and is much smaller than for biofuel.
All models saved diagnostics for cloud optical depth, cloud droplet number concentration, liquid and total cloud cover, liquid water path, aerosol optical depth and top-of-atmosphere radiative net forcing and clear-sky forcing (some models provided these only in the short-wave). Some of the models saved CCN, cloud droplet radius, information on ice clouds, cloud albedo and more specific information on aerosol composition. We worked primarily with diagnostics common to the models.
2.2 Models
The six global models had aerosol schemes that resolved par-ticle number, hygroscopicity and aerosol cloud indirect ef-fects. The model cloud and aerosol microphysical schemes are summarized in Tables 2 and 3.
All models simulate stratiform and convective clouds. All models applied indirect effects to stratiform clouds with three models also including convective indirect effects, GISS, LSCE and SPRINTARS (for cloud albedo effect only). All models except CAM-PNNL and CAM-Oslo assumed a lower limit to their cloud droplet number concentration in order to avoid very small values under clean conditions which would then cause very large radiative effects. In all models, aerosols are taken into cloud droplets during cloud formation and then rained out following autoconversion; aerosols are also scav-enged by falling rain below-cloud.
The top-of-atmosphere (TOA) radiative flux changes re-sult from a combination of changes in cloud lifetime, cloud albedo, and cloud response to the soot absorption and direct aerosol forcing above cloud. The radiative effects resulting from interstitial treatment of BC within clouds is included in some models however BC within cloud droplets is not in-cluded in these models. The latter effect was estimated to enhance BC absorption by about 5% according Chuang et al. (2002). Jacobson (2006) found that surface warming by BC was enhanced about 10% due to BC inclusions in both cloud liquid droplets and ice particles. Note that the radia-tive flux changes resulting from the cloud changes are not strictly climate forcings, because the cloud changes include fast responses and feedbacks of the climate system.
Four of the models, CAM-Oslo, CAM-PNNL, ECHAM5 and GISS, have detailed microphysical schemes in which carbonaceous particle hygroscopicity depends upon mixing with more hygroscopic species, including deposition of sul-furic (all four models) or nitric acids (GISS), secondary organics (CAM-PNNL), or coagulation with other aerosol species (all four models). These four also include particle nucleation schemes. The other two, LSCE and SPRINTARS, have hygroscopity that is fixed or time-dependent. Most of the models assume larger biofuel than fossil fuel particle size upon emission, however a variety of sizes are assumed. There is some disparity in assumption about OC icity among the models (Table 3), with emitted hygroscop-icity ranging from 0 to 70%. We note that low hygroscopic-ity is generally appropriate for fossil fuels while higher val-ues are appropriate for most biofuels. All models except the LSCE and ECHAM5 model (see below) use K¨ohler theory to determine particle activation, in which CCN activation de-pends on particle size, chemical properties, and cloud updraft velocity. We now provide some more detail for each model aerosol microphysical scheme.
CAM-Oslo (CO) uses the NCAR CAM3 global model. The model aerosol microphysics is described by Seland et al. (2008) and the aerosol indirect effects by Hoose et
al. (2009). The aerosol population includes 16 process modes and 44 size bins with process-determined mixing states. Pro-cesses include nucleation, coagulation, condensation and de-position. Emitted fossil fuel BC and OC are assumed to be externally mixed, while biofuel BC and OC are assumed in-ternally mixed. Exin-ternally mixed BC is hydrophobic and OC is 25% as hygroscopic as sulfate. Particles become hydrophilic through sulfate condensation or by coagulation with sulfate or seasalt. Hygroscopicity of the mixed particles is determined by the volume mixing ratio of the species.
CAM-PNNL (CP) uses the NCAR CAM model with a 7 mode modal aerosol scheme (MAM-7) (Easter et al., 2004). Primary organic and black carbon are emitted into a primary carbon mode, which ages to a mixed accumulation mode by condensation of sulfate, ammonia or secondary organics or by coagulation with other accumulation mode particles. The model emits condensable secondary organic aerosol gas (SOAG), predicts SOAG in the model and the partition of SOAG to aerosol phase to form SOA. Boundary layer nucle-ation is included in the aerosol scheme.
ECHAM5 (E) uses the ECHAM5-HAM model (Stier et al., 2005) with the indirect effects described by Lohmann and Hoose (2009). Cloud droplet activation is based on K¨ohler theory, but is simplied such that it only depends on particle size and cloud updraft velocity, while the chemical properties are neglected (Lin and Leatch, 1997; Lohmann et al., 2007). The activation thresholds are 35 nm and 25 nm for particles activating in stratiform and detraining convective clouds, re-spectively. BC and 35% OC are emitted into an insoluble mode and 65% OC is emitted into a soluble mode. The insol-uble mode transfers to solinsol-uble as coagulation and deposition renders it hygroscopic.
GISS-MATRIX (G) uses the GISS ModelE GCM, with the MATRIX aerosol microphysical scheme (Bauer et al., 2008, 2010) and aerosol indirect effects (Bauer et al., 2010). The microphysical scheme uses method of moments and BC and OC may exist in 8 possible “populations”. Fossil and bio-fuel BC is emitted into BC1 (with less than 5% acids) and OC into OCC. As BC1 ages, condensation of sulfate, nitrate or water moves it to BC2 (5–20% inorganics) and then to BC3 (>20% inorganics); coagulation with sulfate moves it to BCS, with dust to DBC, with OC to OCB and with sea-salt to MXX. OCC coagulation with BC moves it to BOC and with other species to MXX. The hygroscopic fraction is set to 0 for BC1 and DBC, 0.5 for BOC, 0.7 for OCC and 1 for all other populations with carbonaceous components.
LSCE (L) uses the LMDZ GCM with the INCA aerosol scheme. The INCA scheme represents aerosols in five sep-arate modes that are either insoluble or soluble. Eighty per-cent of BC and 50% of OC are emitted as insoluble; as these aerosols age, they become hygroscopic with a half-life of 1.1 day. The CDNC is based on aerosol mass according to the relationships inferred from MODIS retrievals (Quaas et al., 2009).
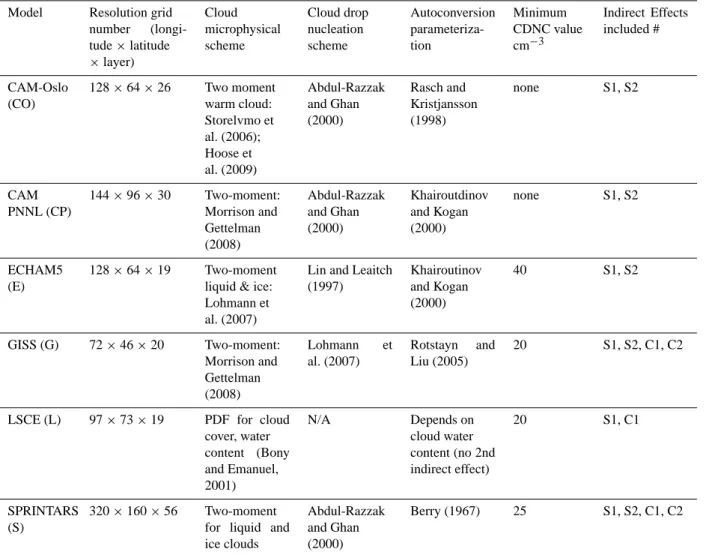
Table 2. Model and cloud microphysical information.
Model Resolution grid number (longi-tude × lati(longi-tude ×layer) Cloud microphysical scheme Cloud drop nucleation scheme Autoconversion parameteriza-tion Minimum CDNC value cm−3 Indirect Effects included # CAM-Oslo (CO) 128 × 64 × 26 Two moment warm cloud: Storelvmo et al. (2006); Hoose et al. (2009) Abdul-Razzak and Ghan (2000) Rasch and Kristjansson (1998) none S1, S2 CAM PNNL (CP) 144 × 96 × 30 Two-moment: Morrison and Gettelman (2008) Abdul-Razzak and Ghan (2000) Khairoutdinov and Kogan (2000) none S1, S2 ECHAM5 (E) 128 × 64 × 19 Two-moment liquid & ice: Lohmann et al. (2007)
Lin and Leaitch (1997) Khairoutinov and Kogan (2000) 40 S1, S2 GISS (G) 72 × 46 × 20 Two-moment: Morrison and Gettelman (2008) Lohmann et al. (2007) Rotstayn and Liu (2005) 20 S1, S2, C1, C2
LSCE (L) 97 × 73 × 19 PDF for cloud cover, water content (Bony and Emanuel, 2001) N/A Depends on cloud water content (no 2nd indirect effect) 20 S1, C1 SPRINTARS (S) 320 × 160 × 56 Two-moment for liquid and ice clouds
Abdul-Razzak and Ghan (2000)
Berry (1967) 25 S1, S2, C1, C2
# S = stratiform, C = convective, 1 = cloud albedo (1st indirect), 2 = cloud lifetime (2nd indirect).
SPRINTARS (S) uses the MIROC GCM. Fossil fuel BC is assumed to be 50% externally mixed and the rest is mixed with OC. Biofuel BC and OC are assumed to be co-emitted. BC mode radius is 0.0118 um and dry mixed BC/OC is 0.1 um but grows to 0.2 and 0.3 as relative humidity increases to 95% and 98%. The hygroscopicity is 5 × 10⁻⁷ for BC and 0.14 for OC.
3 Results
3.1 Impacts on cloud droplet number concentration, liquid water path and cloud optical depth
The cloud radiative flux response to aerosol changes re-sults from changes in cloud droplet number concentration (CDNC) which in turn affects the cloud optical depth (COD) and albedo (cloud albedo effect) and cloud cover (cloud life-time effect). Typically the COD is proportional to the liquid
water path (LWP) and inversely proportional to the droplet effective radius. The effective radius decreases as CDNC in-creases, and the COD increases with LWP and CDNC. Fig-ures 2, 3 and 4 show the changes in CDNC, LWP and COD from the carbonaceous aerosol reduction experiments. COD changes, where systematically due to aerosol perturbations, result mostly from changes in CDNC and LWP. Table 4 has the changes in COD, LWP and CDNC for the reduction ex-perients, as well as the difference between pre-industrial and year 2000, or the impact of reducing all pollution.
The impact of LWP and CDNC changes on COD are apparent from comparing Figs. 2, 3 and 4, which in most cases are highly correlated. Many of the models have rela-tively stronger LWP changes over ocean and stronger CDNC changes over land, with the CDNC changes dominating in influence on COD. The geographical distributions of COD reduction are quite diverse among the models, in part due to differing wavelength responses and model resolutions.
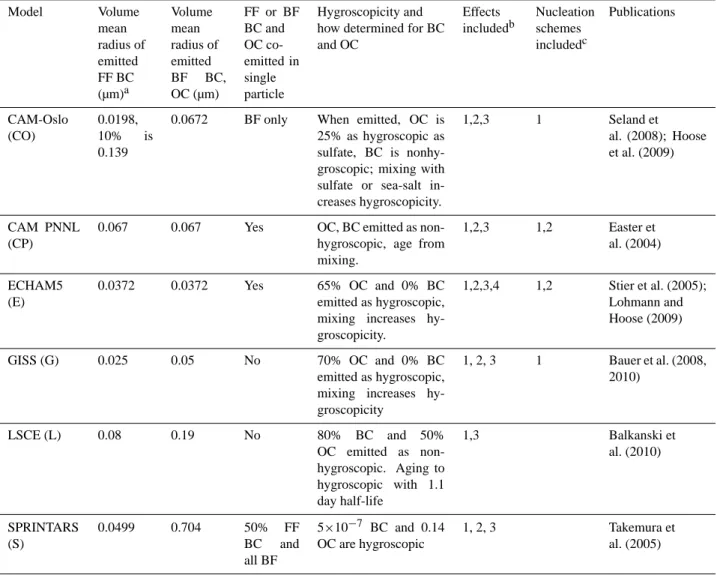
Table 3. Model soot microphysical characteristics. Model Volume mean radius of emitted FF BC (µm)a Volume mean radius of emitted BF BC, OC (µm) FF or BF BC and OC co-emitted in single particle Hygroscopicity and how determined for BC and OC Effects includedb Nucleation schemes includedc Publications CAM-Oslo (CO) 0.0198, 10% is 0.139
0.0672 BF only When emitted, OC is 25% as hygroscopic as sulfate, BC is nonhy-groscopic; mixing with sulfate or sea-salt in-creases hygroscopicity. 1,2,3 1 Seland et al. (2008); Hoose et al. (2009) CAM PNNL (CP)
0.067 0.067 Yes OC, BC emitted as
non-hygroscopic, age from mixing. 1,2,3 1,2 Easter et al. (2004) ECHAM5 (E) 0.0372 0.0372 Yes 65% OC and 0% BC emitted as hygroscopic, mixing increases hy-groscopicity. 1,2,3,4 1,2 Stier et al. (2005); Lohmann and Hoose (2009) GISS (G) 0.025 0.05 No 70% OC and 0% BC emitted as hygroscopic, mixing increases hy-groscopicity 1, 2, 3 1 Bauer et al. (2008, 2010) LSCE (L) 0.08 0.19 No 80% BC and 50% OC emitted as non-hygroscopic. Aging to hygroscopic with 1.1 day half-life 1,3 Balkanski et al. (2010) SPRINTARS (S) 0.0499 0.704 50% FF BC and all BF 5×10⁻⁷ BC and 0.14 OC are hygroscopic 1, 2, 3 Takemura et al. (2005)
a(volume-mean radius)3= (mass emissions)/[(number emissions) × density × (4π /3)];
beffects: 1 Cloud albedo effect, 2 Cloud lifetime effect, 3 semi-direct effect, 4 mixed-phase cloud effects; c1 = binary sulfate-water or ternary sulfate-nitrate-water homogeneous, 2 = boundary layer.
However, in most (17 out of 24) cases, the aerosol reduction experiments result in decreased COD and in most of these cases these changes are related to decreased particle num-ber and CDNC. The CP, S and L models all have decreased CDNC and COD for all experiments (except the L BF exper-iment with small increase in CDNC).
However for the models that include particle nucleation, deposition and coagulation, reduction of carbonaceous pri-mary aerosols can result in increased viable CCN. For two models that saved CCN diagnostics (CP and CO), the CCN changes were distributed similarly to the CDNC changes, with increased CCN in some regions and decreased CCN in others (not shown). The increased CCN from soot reduc-tion results from the liberated secondary species such as sul-furic acid that would have deposited on the soot, but may
now either nucleate new particles or deposit on other parti-cles that can form CCN more readily than the original soot-sulfate mixture would have. The CO and G models had in-creased sulfate distributed over their CCN in the FF experi-ment (not shown). For the G model FF experiexperi-ment, sulfate deposited on other particles instead of BC, mostly on OC, and the OC-sulfate mixtures made better CCN than the BC-sulfate particles did. This occurs both because the OC are larger and more hygroscopic. These highly hygroscopic par-ticles grow and activate more readily than the carbonaceous aerosols would, so that the CDNC and COD can increase. This impact, of soot reduction enhancing CCN, is more likely to occur for BC reduction than OC, because BC is assumed to have lower hygroscopicity and/or smaller size. For example, in G model FF and D experiments, the CDNC and COD both
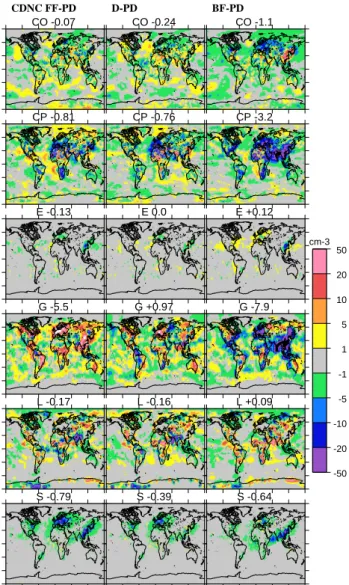
CO -0.07 CDNC FF-PD CP -0.81 E -0.13 G -5.5 L -0.17 S -0.79 CO -0.24 D-PD CP -0.76 E 0.0 G +0.97 L -0.16 S -0.39 CO -1.1 BF-PD CP -3.2 E +0.12 G -7.9 L +0.09 S -0.64 -50 -20 -10 -5 -1 1 5 10 20 50 cm-3
Fig. 2. Difference in annual mean cloud droplet number
concen-tration (CDNC) between the fossil fuel (left), diesel (middle) and biofuel (right) reduction experiments and the full simulation. Each row is one model.
increase. For CO model FF and D experiments, the CDNC decreases less than for BF, and the COD increases. For CP model FF and D experiments the CDNC and COD decrease less than for BF. All three of these models include nucleation schemes and particle mixing.
In addition to hygroscopicity changes from the carbona-ceous aerosol emissions, size also plays an important role in the COD response. The simulations for models with nucle-ation schemes that have small emitted soot particles sizes, radius ≤0.04 µm (CO FF, E FF and BF, G FF; see Table 3) all have a positive COD change. Apparently the production of viable CCN is greater when there are fewer small particles competing for condensation of H2SO4and other precursors. Because of the competition between primary particle loss and shift toward more hygroscopic particle population, it
be-CO +1.0 LWP FF-PD CP -0.47 E +0.14 G -0.04 L -0.53 S 0.01 CO +0.53 D-PD CP -0.11 E +0.1 G +0.1 L -0.24 S 0.0 CO -3.3 BF-PD CP -1.1 E +0.28 G -0.25 L -1.1 S -0.05 -100 -50 -10 -5 -1 1 5 10 50 100 kg/m2
Fig. 3. Difference in annual mean liquid water path (LWP) between
the fossil fuel (left), diesel (middle) and biofuel (right) reduction experiments and the full simulation. Each row is one model. The CO model fields are reduced by a factor of 10 to plot on same color scale.
comes difficult to discern clear geographical patterns in COD change (Fig. 4). However nearly all models have large re-ductions in CDNC and COD for the BF reduction experi-ment over Asia where the soot reductions are large (Fig. 1c). The S model has clear correlations between COD reductions and aerosol emission reductions, however this model does not have aerosol nucleation effects competing with soot par-ticle reduction effects.
More than half of the experiments have stronger COD and CDNC signals in the Northern (NH, given in parentheses in Table 4) than Southern Hemisphere (SH), which is expected because the emissions are greater in the north. On the other hand, the SH may have more sensitivity to small pollution reductions because it is typically cleaner.
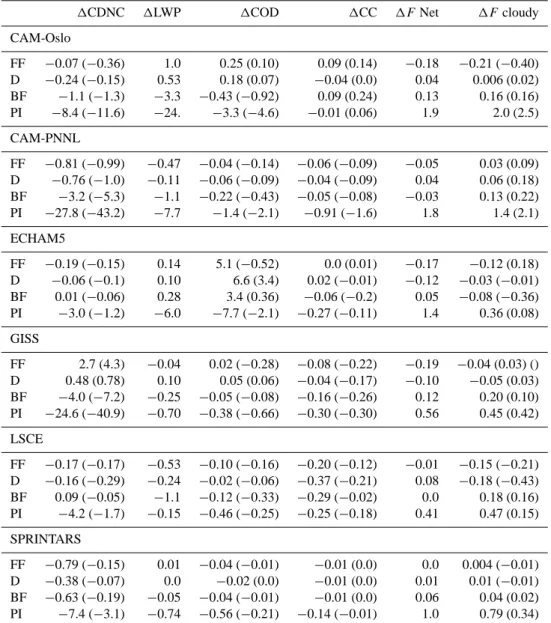
Table 4. Global mean (NH mean) model cloud responses due to reductions of fossil fuel (FF), diesel (D) and biofuel (BF) soot (BF), and all
pollution (PI).
1CDNC 1LWP 1COD 1CC 1FNet 1Fcloudy
CAM-Oslo FF −0.07 (−0.36) 1.0 0.25 (0.10) 0.09 (0.14) −0.18 −0.21 (−0.40) D −0.24 (−0.15) 0.53 0.18 (0.07) −0.04 (0.0) 0.04 0.006 (0.02) BF −1.1 (−1.3) −3.3 −0.43 (−0.92) 0.09 (0.24) 0.13 0.16 (0.16) PI −8.4 (−11.6) −24. −3.3 (−4.6) −0.01 (0.06) 1.9 2.0 (2.5) CAM-PNNL FF −0.81 (−0.99) −0.47 −0.04 (−0.14) −0.06 (−0.09) −0.05 0.03 (0.09) D −0.76 (−1.0) −0.11 −0.06 (−0.09) −0.04 (−0.09) 0.04 0.06 (0.18) BF −3.2 (−5.3) −1.1 −0.22 (−0.43) −0.05 (−0.08) −0.03 0.13 (0.22) PI −27.8 (−43.2) −7.7 −1.4 (−2.1) −0.91 (−1.6) 1.8 1.4 (2.1) ECHAM5 FF −0.19 (−0.15) 0.14 5.1 (−0.52) 0.0 (0.01) −0.17 −0.12 (0.18) D −0.06 (−0.1) 0.10 6.6 (3.4) 0.02 (−0.01) −0.12 −0.03 (−0.01) BF 0.01 (−0.06) 0.28 3.4 (0.36) −0.06 (−0.2) 0.05 −0.08 (−0.36) PI −3.0 (−1.2) −6.0 −7.7 (−2.1) −0.27 (−0.11) 1.4 0.36 (0.08) GISS FF 2.7 (4.3) −0.04 0.02 (−0.28) −0.08 (−0.22) −0.19 −0.04 (0.03) () D 0.48 (0.78) 0.10 0.05 (0.06) −0.04 (−0.17) −0.10 −0.05 (0.03) BF −4.0 (−7.2) −0.25 −0.05 (−0.08) −0.16 (−0.26) 0.12 0.20 (0.10) PI −24.6 (−40.9) −0.70 −0.38 (−0.66) −0.30 (−0.30) 0.56 0.45 (0.42) LSCE FF −0.17 (−0.17) −0.53 −0.10 (−0.16) −0.20 (−0.12) −0.01 −0.15 (−0.21) D −0.16 (−0.29) −0.24 −0.02 (−0.06) −0.37 (−0.21) 0.08 −0.18 (−0.43) BF 0.09 (−0.05) −1.1 −0.12 (−0.33) −0.29 (−0.02) 0.0 0.18 (0.16) PI −4.2 (−1.7) −0.15 −0.46 (−0.25) −0.25 (−0.18) 0.41 0.47 (0.15) SPRINTARS FF −0.79 (−0.15) 0.01 −0.04 (−0.01) −0.01 (0.0) 0.0 0.004 (−0.01) D −0.38 (−0.07) 0.0 −0.02 (0.0) −0.01 (0.0) 0.01 0.01 (−0.01) BF −0.63 (−0.19) −0.05 −0.04 (−0.01) −0.01 (0.0) 0.06 0.04 (0.02) PI −7.4 (−3.1) −0.74 −0.56 (−0.21) −0.14 (−0.01) 1.0 0.79 (0.34)
CDNC = cloud droplet number concentration, # cm−3, is for top of cloud for all models except GISS which is average over cloud depth. COD = cloud optical depth. CC = cloud
cover %, in all cases this is liquid cloud only except ECHAM5 is low cloud. 1F Net is the net change in TOA radiative flux, Wm−2; 1F cloudy is the TOA flux change in the cloudy sky, Wm−2; LSCE and ECHAM5 models use short-wave flux only.
3.2 Impacts on cloud cover
For models that include the aerosol cloud lifetime effect (all except L), meaning they allow the conversion of cloud droplets to rainwater to depend upon the aerosols, the cloud cover (CC) can change due to the aerosol microphysical changes. All models also include semi-direct effects, or the change in cloud distribution resulting from aerosol direct ra-diative perturbation of the atmospheric thermal structure (e.g. Hansen et al., 1997; Koch and Del Genio, 2010). The models include radiative interactions among BC and cloud particles
within a cloud, but do not account for the effects of absorp-tion enhancement of BC within cloud droplets as described and treated in Jacobson (2002, 2006). Scattering between cloud and aerosol layers are typically included. Therefore cloud cover changes in the experiments due to both the life-time and semi-direct effects.
For most experiments (20 out of 24), aerosol reduction also decreases cloud cover (CC, shown in Fig. 5). For cases that had increased COD due to reduced soot (see previous section, Fig. 4) we might also expect increased cloud cover. However the semi-direct effect is often negative in global
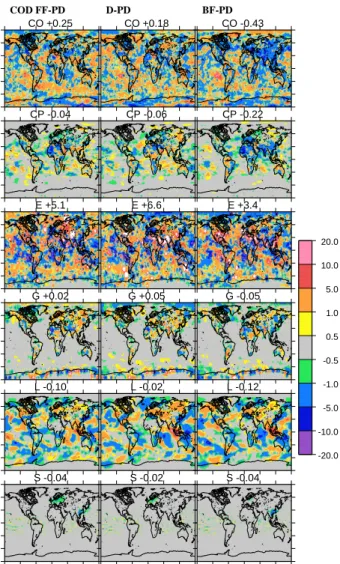
CO +0.25 COD FF-PD CP -0.04 E +5.1 G +0.02 L -0.10 S -0.04 CO +0.18 D-PD CP -0.06 E +6.6 G +0.05 L -0.02 S -0.02 CO -0.43 BF-PD CP -0.22 E +3.4 G -0.05 L -0.12 S -0.04 -20.0 -10.0 -5.0 -1.0 -0.5 0.5 1.0 5.0 10.0 20.0
Fig. 4. Difference in annual mean cloud optical depth (COD)
be-tween the fossil fuel (left), diesel (middle) and biofuel (right) reduc-tion experiments and the full simulareduc-tion. Each row is one model.
models (Koch and Del Genio, 2010), meaning that reduc-tion in absorbing aerosols also decreases cloud cover. This effect is most potent for strongly absorbing aerosols (e.g. the FF, D experiments). Therefore, for example, the G model cases FF and D have decreased CC even though the COD increases. On the other hand the CO model has increased CC for FF, and for BF even though COD, CDNC and LWP decrease, so that this model may have a positive semi-direct effect especially noticable over the continents (Fig. 5). Most of the FF experiments have decreased CC in the Arctic, a re-mote region where the strongly absorbing BC would tend to be above cloud. Soot above stratocumulus clouds can have a semi-direct cloud cover enhancement (Koch and Del Genio, 2010), so that soot removal in this region could cause CC reduction.
Table 5. Correlation coefficients between CC and COD changes
from PD and each experiment.
Model BF FF D CO −0.99 0.99 −0.96 CP 0.98 0.97 0.96 E −0.86 −0.57 0.82 G 0.98 0.91 0.59 L 0.99 0.95 0.25 S 0.87 −0.41 −0.76
The regional patterns of CC change in individual models tend to be similar for their three experiments. For example, CO (first row of Fig. 5) has increased CC over Europe and the north Atlantic in all experiments but reduced CC to the south of these regions. CP (2nd row) has increased CC in the Arctic but decreased CC over Europe and the Atlantic. Model L (5th row) also has reduced CC over much of Eu-rope and the North Pacific but increased CC over northwest-ern North America and northeastnorthwest-ern Eurasia. Therefore it appears that the model cloud responses have a characteristic dynamical and/or semi-direct component. The CC responses are stronger in the NH than SH for the G, CP, two of the CO and one of the E experiments.
Correlation between the COD (Fig. 4) and CC (Fig. 5) changes are strong in many cases (Table 5), perhaps domi-nated by regions of strongest changes. The BF experiment has correlation coefficient ≥0.98 for three models; the CO model has very strong anti-correlation, −0.99. Most models also have fairly strong and positive correlation for FF. For the D experiment the correlations are weaker.
3.3 Cloudy-sky radiative effects
Figure 6 shows the TOA radiative flux changes in the cloudy atmosphere from the BC-reduction experiments. This flux change is a combination of cloud lifetime, cloud albedo, cloud response to the soot absorption effects on the thermal structure of the atmosphere, and the direct aerosol forcing above cloud.
Although the magnitude and distribution of the flux changes differ greatly among the models, there are some ro-bust features. The BF experiment radiative effect is positive for all models except E and is the most positive of the three experiments for each model. The FF experiment response is more diverse among the models, but all models have negative or very small positive responses. The net magnitudes of the responses to the diesel-reduction experiment are generally smaller, less than ±0.06 Wm−2, except for the L model with
−0.18 Wm−2. The geographical pattern of flux change for each model are generally similar across the experiments, as we also noted for the cloud cover changes (previous section).
In general the cloudy-sky radiative flux changes can be explained in terms of the changes in CC (Fig. 5) and in COD (Fig. 4), so that the TOA radiative flux changes are anti-correlated with either or both of these. For example, the CO and CP BF experiment has generally positive flux change over much of Eurasia, due mainly to reduced COD but with some areas (e.g. southern Europe) having negative flux from increased cloud cover. The E model radiative ef-fect is strongly influenced by the changes in CC for all ex-periments, with increased Arctic CC (negative forcing) but decreased CC at mid-latitudes of the north and positive ra-diative effect.
The largest BC reductions are for FF in Europe and south-east Asia and the BF reductions in southsouth-east Asia (Fig. 1). Most of the models have negative forcing over most of Eu-rope for FF and D. For some of the models (CO, CP, G), there is also a tendency to have (more) positive forcing over Eurasia for the BF experiment.
Although there is large diversity in model responses to soot reduction, there is also large diversity in the response of present-day relative to pre-industrial, i.e. for the (PD vs PI) indirect effects generally (Table 4). The cloudy TOA radiative flux change from PI to PD ranges from −0.36 to
−2.0 Wm−2, about a factor of six, similar to the range given in Quaas et al. (2009, −0.27 to −1.9 Wm−2). The BF to PD change (now in terms of pollution addition) ranges from
−0.20 to +0.08 Wm−2 and the FF to PD from −0.03 to +0.21 Wm−2, each with spread of about 0.25 Wm−2but with the BF more negative. The BF-PD flux change percentage of the PI-PD flux change for each model is −22, 5, 8, 8, 38, 44% for E, S, CO, CP, L and G. This can be thought of as the size of the contribution of BF soot to the indirect effect. The two models that did not apply a minimum CDNC con-straint, CO and CP, did have larger PD vs PI response com-pared with other models, but their soot-reduction responses were not particularly enhanced.
About half of the model simulations have NH forcing greater than or equal to SH (Table 4). However the order of the bio-diesel-fossil fuel from most to least negative gen-erally remains preserved for NH as for the global average.
The interannual variability and the resulting standard de-viation for the experiments is large. We calculated standard deviation for the changes from BF to PD over the five years of simulation in the L, E and G models, the only models that contributed results for individual years. The standard deviation for the TOA radiative flux change was 0.25 Wm−2 for L, 0.46 Wm−2for E, and 0.05 Wm−2for G compared to the mean flux changes of 0.18, −0.08 and 0.20 Wm−2 re-spectively. In the L model, the standard deviations for CC and COD changes for the BF vs PD were 0.11% and 0.07, compared to mean changes of −0.29% and −0.12. In the E model these standard deviations for CC and COD changes were 0.02% and 5.9, compared to mean changes of −0.06% and 3.4. So both models had larger variability in COD than CC changes.
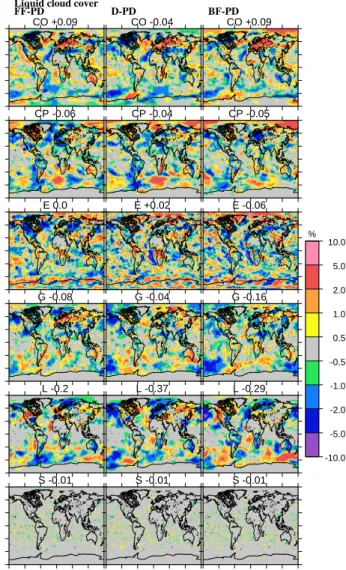
CO +0.09
Liquid cloud cover FF-PD CP -0.06 E 0.0 G -0.08 L -0.2 S -0.01 CO -0.04 D-PD CP -0.04 E +0.02 G -0.04 L -0.37 S -0.01 CO +0.09 BF-PD CP -0.05 E -0.06 G -0.16 L -0.29 S -0.01 -10.0 -5.0 -2.0 -1.0 -0.5 0.5 1.0 2.0 5.0 10.0 %
Fig. 5. Difference in annual cloud cover from the fossil fuel (left),
diesel (middle) and biofuel (right) reduction experiments and the full simulation. All results are for liquid cloud cover except E which is low cloud cover. Each row is one model.
All-sky (net) TOA flux changes for the experiments are also provided in Table 4. The average all-sky flux change for FF is −0.1 Wm−2and for BF is +0.06 Wm−2. The re-spective average cloudy-sky flux changes are −0.08 Wm−2 and +0.11 Wm−2, and the all-sky and the cloudy-sky val-ues generally have the same sign for most experiments. There is large variation among the models and the exper-iments in the relative importance of clear and cloudy sky flux changes. Note that it is not straightforward from our experiments to provide direct effects distinct from indirect effects, again because the cloudy-sky fluxes include above-cloud soot absorption.
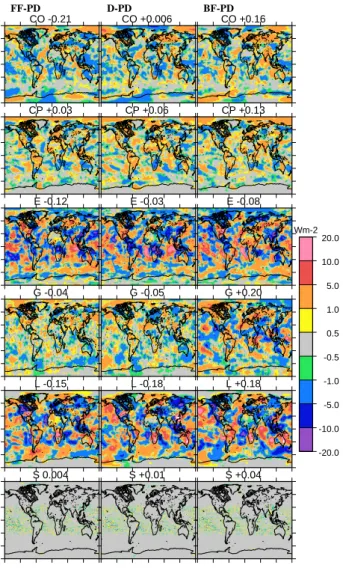
CO -0.21 FF-PD CP +0.03 E -0.12 G -0.04 L -0.15 S 0.004 CO +0.006 D-PD CP +0.06 E -0.03 G -0.05 L -0.18 S +0.01 CO +0.16 BF-PD CP +0.13 E -0.08 G +0.20 L +0.18 S +0.04 -20.0 -10.0 -5.0 -1.0 -0.5 0.5 1.0 5.0 10.0 20.0 Wm-2
Fig. 6. Annual mean radiative flux change at top-of-atmosphere
for cloudy-sky between the fossil fuel (left), diesel (middle) and biofuel (right) reduction experiments and the full simulation. L and E models use short-wave flux only. Each row is one model.
4 Discussion and conclusions
We have provided a multi-model investigation of how soot may affect liquid-clouds, by comparing results from three soot-reduction experiments in six global models. We have presented the results for top-of-atmosphere cloudy-sky ra-diative flux and other cloud changes, due to a combination of indirect and semi-direct effects. The experiments indicate a large diversity in response, but with some robust tenden-cies.
Reductions of all biofuel BC and OC (BF), which ac-counts for approximately 20% and 10% of all respective BC and OC sources, results in a positive cloudy-sky radiative response in all models except one, ranging from -0.08 to +0.20 Wm−2. Removal of biofuel soot decreased the CCN and CDNC population because the biofuel
BC-OC particles were generally sufficiently large and hygro-scopic. The average cloud response to biofuel soot (addition) is −0.11 Wm−2. This can be compared to the direct radia-tive effect of about +0.08 Wm−2(Schulz et al., 2006; using the AeroCom model estimates and enhancing the BC compo-nent by 50% to account for internal mixing enhancement of absorption as recommended by Bond and Bergstrom, 2006). Therefore it appears that removal of biofuel soot could cause a warming due to the concurrent cloud effects.
A more idealized experiment, reducing all fossil fuel BC (FF), resulted in negative or small positive cloudy-sky radia-tive responses, from −0.28 to +0.03 Wm−2. The negative re-sponses, obtained for four of the models, occured mostly be-cause the removal of soot enabled growth of bigger, more hy-groscopic particles, resulting in increased CDNC and cloud optical depths. The average cloudy-sky radiative flux change to fossil fuel BC addition is +0.08 Wm−2 and therefore a contributor to global warming. However, to treat the fos-sil fuel experiments realistically we should change OC and SO2co-emissions as well. For example coal combustion has large SO2emission, and it is possible that reduction of co-emmitted SO2 would largely eliminate the cloud enhance-ment the models found in their FF experienhance-ments.
For most models, the diesel-reduction experiments tended to have small cloudy-sky radiative response (less than
±0.06 Wm−2in all but one model), in part because the emis-sion magnitude is smaller. The reduced emisemis-sions for D are also intermediate in properties between those for BF and F, with a small amount of OC enhancing hygroscopicity but with the smaller particle size as assumed for fossil fuel com-bustion. For most models the cloudy radiative flux changes for D are similar to the FF experiment, however two mod-els had much smaller response, so the average radiative flux change was −0.03 Wm−2. However the signal to noise ratio may be small in these experiments.
Overall, the results of these experiments are consistent with the previous studies. As in Chen et al. (2010), Bauer et al. (2010) and Jacobson (2010), biofuels are found to en-hance cloud, and consistent with the first two of these, bio-fuel soot has a negative cloud radiative response. Consistent with all three studies, all models have less negative response to fossil fuel compared to biofuel soot.
Our experiments highlight several uncertainties in the cloud-soot responses. Most obvious is the diversity in sponse among and within models. The experiment cloud re-sponses had large interannual variability and standard devi-ation. Two of the models had standard deviation larger than the radiative response and one had standard deviation smaller by a factor of four. These are similar to what was found by Chen et al. (2010) in which their biofuel and fossil fuel exper-iments had respective standard deviation smaller by one-third and about equal to the radiative flux changes. Our simula-tions were performed for five years, and longer experiments should be conducted when considering the effects on clouds from relatively small aerosol perturbations.
Detection of similarities may also be hindered by variation in wavelength of cloud responses, possibly resulting from different model resolutions. Some models also had larger changes over land or ocean while others had similar changes over both. There was very little robustness in how models responded in particular regions to soot reductions. Rather, the responses may largely reflect cloud changes character-istic for the model, as seen in the similarity in CC changes for the three soot-reduction experiments conducted by each experiment (Fig. 5).
While both COD and CC changes apparently influence the cloudy-sky radiative flux changes, Quaas et al. (2009) found that the models generally overestimated the LWP-AOD re-lation but underestimated the CC-AOD rere-lation, compared with satellite retrievals. Since most of the soot-reduction ex-periments (14 out of 18) had reduced cloud cover, stronger cloud cover response would tend to cause more positive ra-diative flux change.
The CC responses for these experiments also included a combination of cloud-lifetime change from aerosol micro-physics and the response of the clouds to aerosol absorp-tion perturbaabsorp-tion of the atmospheric thermal structure (semi-direct effect). The semi-(semi-direct effect responses probably in-volve a combination of cloud increase and decrease for var-ious regions, however some global models have a net neg-ative cloud response to absorbing aerosols, which increases with aerosol absorption (Koch and Del Genio, 2010). This semi-direct effect may therefore contribute to the negative cloud forcing response, or to a cloud cover loss (positive re-sponse) from the soot-reduction experiments, although we cannot at this point document the impact of the semi-direct effect on these experiments. Future experiments might iso-late the indirect from the semi-direct effect, as was done in Chen et al. (2010) by switching off the aerosol-radiation in-teraction. However these cloud effects probably interact and therefore do not add linearly. Furthermore, ultimately we are interested in the net effect of soot and co-emitted species on climate, including semi-direct, direct, indirect and snow/ice-albedo effects together.
The radiative effects also include the direct effect occur-ring above-cloud in the cloudy-sky region. This effect would cause the cloudy-sky flux to be more negative in the soot re-moval experiments. The effect would tend to be proportional to the change in BC emission, which was largest for the FF experiment (BC emission change is 3, 1.6 and 1.3 for FF, BF and D).
Our experiments suggest the importance of several influ-ences on CCN activity. These conclusions are qualitative because we did not have CCN diagnostics from all models to help quantify the changes. CDNC was reduced most ef-fectively by biofuel removal, due to the larger sizes and hy-groscopicity of the BC-OC particles. In addition, the emis-sion reduction was greatest for the BF experiment. CDNC was reduced less or even increased when fossil fuel BC was removed. These particles are smaller, less hygroscopic
and therefore less active CCN. When these particles were removed, secondary species (e.g. sulfate) nucleated more and/or condensed on other particles such as OC, and this par-ticle population was sometimes more easily activated than the population including fossil fuel BC. Such non-linear in-teractions between soot and sulfate have also been observed in the field (Lee et al., 2006). In order for models to cap-ture these effects, their aerosol microphysical schemes need to accurately simulate particle size, hygroscopicity, mixing and nucleation. Global models are only beginning to com-pare their aerosol mixtures with relevant field measurements; more testing of the microphysical schemes is needed before we can be confident in how they simulate cloud responses to soot reduction.
One difficulty highlighted by these simulations are the sig-nificant non-linearities, not only those resulting from the in-direct effect itself, but also those due to competing effects that influence the CCN population. It is already known that the indirect effect is most potent in clean conditions, so that removing particles from a highly polluted environment would have a relatively smaller impact. Here we have argued that soot removal can either increase or decrease CCN and the size and sign of the cloud response depend on the compo-sition of the soot (OC to BC ratio, with OC usually assumed to be more hygroscopic), the size of the particles, as well as the magnitude of the soot change. Future experiments should focus on controlling these variables individually in order to quantify the non-linearities. A challenge will be to define the non-linearities by making incremental changes in emissions, and yet obtain statistically significant cloud responses. And yet, with the need to understand whether reductions of soot sources benefits climate, it is these smaller emission changes that are most relevant for policy purposes.
Acknowledgements. We acknowledge two anonymous review-ers for their helpful comments on our manuscript. We thank Tami Bond for providing diesel emissions for the experiments and for comments on the manuscript. D. Koch was supported by the NASA MAP Program and the Clean Air Task Force. The work with CAM-Oslo was supported by the projects EUCAARI (European Integrated project No. 036833-2), IPY POLARCAT and NorClim (Norwegian Research Council grants No. 178246 and 460724) and by the Norwegian Research Council’s program for Supercomputing through a grant of computer time. R. C. Easter, S. J. Ghan, and X. Liu were funded by the US Department of Energy, Office of Science, Scientific Discovery through Advanced Computing (SciDAC) program. The Pacific Northwest National Laboratory is operated for DOE by Battelle Memorial Institute under contract DE-AC06-76RLO 1830. The work at LBNL was supported by US DOE under Contract No. DE-AC02-05CH1123. S. Menon acknowledges support from the NASA MAP and the DOE ASR and Global Climate Modeling Program.
References
Abdul-Razzak, H. and Ghan, S. J.: A parameterization of aerosol activation, 2. Multiple aerosol types, J. Geophys. Res., 105(D5), 6837–6844, 2000.
Balkanski, Y., Myhre, G., Gauss, M., R¨adel, G., Highwood, E. J., and Shine, K. P.: Direct radiative effect of aerosols emitted by transport: from road, shipping and aviation, Atmos. Chem. Phys., 10, 4477–4489, doi:10.5194/acp-10-4477-2010, 2010. Bauer, S. E., Wright, D. L., Koch, D., Lewis, E. R., McGraw,
R., Chang, L.-S., Schwartz, S. E., and Ruedy, R.: MATRIX (Multiconfiguration Aerosol TRacker of mIXing state): an aerosol microphysical module for global atmospheric models, Atmos. Chem. Phys., 8, 6003–6035, doi:10.5194/acp-8-6003-2008, 2008.
Bauer, S. E., Menon, S., Koch, D., Bond, T. C., and Tsigaridis, K.: A global modeling study on carbonaceous aerosol microphysi-cal characteristics and radiative effects, Atmos. Chem. Phys., 10, 7439–7456, doi:10.5194/acp-10-7439-2010, 2010.
Berry, E. X.: Cloud droplet growth by collection, J. Atmos. Sci., 24, 688–701, 1967.
Bond, T. C. and Bergstrom, R. W.: Light absorption by carbona-ceous particles: An investigative review, Aerosol Sci. Technol., 40, 27–67, 2006.
Bond, T. C., Streets, D. G., Yarber, K. F., Nelson, S. M., Woo, J.-H., and Klimont, Z.: A technology-based global inventory of black and organic carbon emissions from combustion, J. Geo-phys. Res., 109, D14203, doi:10.1029/2003JD003697, 2004. Bony, S. and Emanuel, K. E.: A parameterization of the cloudiness
associated with cumulus convection; evaluation using TOGA COARE data, J. Atmos. Sci., 58, 3158–3183, 2001.
Chen, W.-T., Lee, Y. H., Adams, P. J., Nenes, A., and Seinfeld, J. H.: Will black carbon mitigation dampen aerosol indirect forcing?, Geophys. Res. Lett., 37, L09801, doi:10.1029/2010GL042886, 2010.
Chuang, C. C., Penner, J. E., Prospero, J. M., Grant, K. E., Rau, G. H., and Kawamoto, K.: Cloud susceptibility and the first aerosol indirect forcing: Sensitivity to black carbon and aerosol concentrations, J. Geophys. Res., 107(D21), 4564, doi:10.1029/2000JD000215, 2002.
Dentener, F., Kinne, S., Bond, T., Boucher, O., Cofala, J., Generoso, S., Ginoux, P., Gong, S., Hoelzemann, J. J., Ito, A., Marelli, L., Penner, J. E., Putaud, J.-P., Textor, C., Schulz, M., van der Werf, G. R., and Wilson, J.: Emissions of primary aerosol and pre-cursor gases in the years 2000 and 1750 prescribed data-sets for AeroCom, Atmos. Chem. Phys., 6, 4321–4344, doi:10.5194/acp-6-4321-2006, 2006.
Easter, R. C., Ghan, S. J., Zhang, Y., Saylor, R. D., Chapman, E. G., Laulainen, N. S., Abdul-Razzak, H., Leung, L. R., Bian, X., and Zaveri, R. A.: MIRAGE: Model description and evalua-tion of aerosols and trace gases, J. Geophys. Res., 109, D20210, doi:10.1029/2004JD004571, 2004.
Hansen, J., Sato, M., and Ruedy, R.: Radiative forcing and climate response, J. Geophys. Res.-Atmos., 102, 6831–6864, 1997. Hoose, C., Kristjansson, J. E., Iversen, T., Kirkevag, A., Seland, O.,
and Gettelman, A.: Constraining cloud droplet number concen-tration in GCMs suppresses the aerosol indirect effect, Geophys. Res. Lett., 36, L12807, doi:10.1029/2009GL038568, 2009. Jacobson, M. Z.: Control of fossil-fuel particulate black
car-bon and organic matter, possibly the most effective method of
slowing global warming, J. Geophys. Res., 107(D19), 4410, doi:10.1029/2001JD001376, 2002.
Jacobson, M. Z.: Effects of absorption by soot inclusions within clouds and precipitation on global climate, J. Phys. Chem., 110, 6860–6873, 2006.
Jacobson, M. Z.: Short-term effects of controlling fossil-fuel soot, biofuel soot and gases, and methane on climate, Arctic ice, and air pollution health, J. Geophys. Res., 115, D14209, doi:10.1029/2009JD013795, 2010.
Kanakidou, M., Seinfeld, J. H., Pandis, S. N., Barnes, I., Dentener, F. J., Facchini, M. C., Van Dingenen, R., Ervens, B., Nenes, A., Nielsen, C. J., Swietlicki, E., Putaud, J. P., Balkanski, Y., Fuzzi, S., Horth, J., Moortgat, G. K., Winterhalter, R., Myhre, C. E. L., Tsigaridis, K., Vignati, E., Stephanou, E. G., and Wilson, J.: Organic aerosol and global climate modelling: a review, At-mos. Chem. Phys., 5, 1053–1123, doi:10.5194/acp-5-1053-2005, 2005.
K¨archer, B., M¨ohler, O., DeMott, P. J., Pechtl, S., and Yu, F.: In-sights into the role of soot aerosols in cirrus cloud formation, At-mos. Chem. Phys., 7, 4203–4227, doi:10.5194/acp-7-4203-2007, 2007.
Khairoutdinov, M. and Kogan, Y.: A new cloud physics parameteri-zation in a large-eddy simulation model of marine stratocumulus, Mon. Weather Rev., 128, 229–243, 2000.
Koch, D. and Del Genio, A. D.: Black carbon semi-direct effects on cloud cover: review and synthesis, Atmos. Chem. Phys., 10, 7685–7696, doi:10.5194/acp-10-7685-2010, 2010.
Kristjansson, J.: Studies of the aerosol indirect effect from sulfate and black carbon aerosols, J. Geophys. Res., 107(D15), 4246, doi:10.1029/2001JD000887, 2002.
Lee, Y. S., Collins, D. R., Li, R., Bowman, K. P., and Feingold, G.: Expected impact of an aged biomass burning aerosol on cloud condensation nuclei and cloud droplet concentrations, J. Geo-phys. Res., 111, D22204, doi:10.1029/2005JD006464, 2006. Lin, H. and Leaitch, R.: Development of an in-cloud aerosol
acti-vation parameterization for climate modelling. In: Proc. WMO Workshop on Measurements of Cloud Properties for Forecasts of Weather, Air Quality and Climate, Mexico City, 1997.
Liu, X., Penner, J. E., and Wang, M.: Influence of anthropogenic sulfate and soot on upper tropospheric clouds using CAM3 cou-pled with an aerosol model, J. Geophys. Res., 114, D03204, doi:10.1029/2008JD010492, 2009.
Lohmann, U., Stier, P., Hoose, C., Ferrachat, S., Kloster, S., Roeck-ner, E., and Zhang, J.: Cloud microphysics and aerosol indi-rect effects in the global climate model ECHAM5-HAM, At-mos. Chem. Phys., 7, 3425–3446, doi:10.5194/acp-7-3425-2007, 2007.
Lohmann, U. and Hoose, C.: Sensitivity studies of different aerosol indirect effects in mixed-phase clouds, Atmos. Chem. Phys., 9, 8917–8934, doi:10.5194/acp-9-8917-2009, 2009.
Morrison, H. and Gettelman, A.: A new two-moment bulk strati-form cloud microphysics scheme in the Community Atmosphere Model, version 3 (CAM3), Part I: Description and numerial tests, J. Climate, 21, 3642–3659, 2008.
Penner, J. E., Chen, Y., Wang, M., and Liu, X.: Possible influence of anthropogenic aerosols on cirrus clouds and anthropogenic forc-ing, Atmos. Chem. Phys., 9, 879–896, doi:10.5194/acp-9-879-2009, 2009.
J. E., Gettelman, A., Lohmann, U., Bellouin, N., Boucher, O., Sayer, A. M., Thomas, G. E., McComiskey, A., Feingold, G., Hoose, C., Kristj´ansson, J. E., Liu, X., Balkanski, Y., Donner, L. J., Ginoux, P. A., Stier, P., Grandey, B., Feichter, J., Sednev, I., Bauer, S. E., Koch, D., Grainger, R. G., Kirkev˚ag, A., Iversen, T., Seland, Ø., Easter, R., Ghan, S. J., Rasch, P. J., Morrison, H., Lamarque, J.-F., Iacono, M. J., Kinne, S., and Schulz, M.: Aerosol indirect effects general circulation model intercompar-ison and evaluation with satellite data, Atmos. Chem. Phys., 9, 8697–8717, doi:10.5194/acp-9-8697-2009, 2009.
Rasch, P. J. and Kristj´ansson, J. E.: A comparison of the CCM3 model climate using diagnosed and predicted condensate param-eterizations, J. Climate, 11, 1587–1614, 1998.
Rotstayn, L. D. and Liu, Y.: A smaller global estimate of the sec-ond indirect aerosol effect, Geophys. Res. Lett., 32, L05708, doi:10.1029/2004GL021922, 2005.
Schulz, M., Textor, C., Kinne, S., Balkanski, Y., Bauer, S., Berntsen, T., Berglen, T., Boucher, O., Dentener, F., Guibert, S., Isaksen, I. S. A., Iversen, T., Koch, D., Kirkev˚ag, A., Liu, X., Montanaro, V., Myhre, G., Penner, J. E., Pitari, G., Reddy, S., Seland, Ø., Stier, P., and Takemura, T.: Radiative forc-ing by aerosols as derived from the AeroCom present-day and pre-industrial simulations, Atmos. Chem. Phys., 6, 5225–5246, doi:10.5194/acp-6-5225-2006, 2006.
Seland, Ø, Iversen, T., Kirkev˚ag, A., and Storelvmo, T.: On basic shortcomings of aerosol-climate interactions in atmo-spheric GCMs, Tellus, 60A, 459–491, doi:10.1111/j.1600-0870.2008.00318.x, 2008.
Stier, P., Feichter, J., Kinne, S., Kloster, S., Vignati, E., Wilson, J., Ganzeveld, L., Tegen, I., Werner, M., Balkanski, Y., Schulz, M., Boucher, O., Minikin, A., and Petzold, A.: The aerosol-climate model ECHAM5-HAM, Atmos. Chem. Phys., 5, 1125– 1156, doi:10.5194/acp-5-1125-2005, 2005.
Storelvmo, T., Kristj’ansson, J. E., Ghan, S. J., Kirkev˚ag, A., Se-land, Ø., and Iversen: Predicting cloud droplet number concen-tration in Community Atmosphere Model (CAM)-Oslo, J. Geo-phys. Res., 111, D24208, doi:10.1029/2005JD006300, 2006. Takemura, T., Nozawa, T. T., Emori, S., Nakajima, T. Y., and
Naka-jima, T.: Simulation of climate response to aerosol direct and in-direct effects with aerosol transport-radiation model, J. Geophys. Res., 110, D02202, doi:10.1029/2004JD005029, 2005.