HAL Id: cea-02972133
https://hal-cea.archives-ouvertes.fr/cea-02972133
Submitted on 20 Oct 2020
HAL is a multi-disciplinary open access
archive for the deposit and dissemination of
sci-entific research documents, whether they are
pub-lished or not. The documents may come from
teaching and research institutions in France or
abroad, or from public or private research centers.
L’archive ouverte pluridisciplinaire HAL, est
destinée au dépôt et à la diffusion de documents
scientifiques de niveau recherche, publiés ou non,
émanant des établissements d’enseignement et de
recherche français ou étrangers, des laboratoires
publics ou privés.
LTE-V2X performance evaluation for cooperative
collision avoidance (CoCA) systems
Arturo Guizar, Valerian Mannoni, Federico Poli, Benoit Denis, Vincent Berg
To cite this version:
Arturo Guizar, Valerian Mannoni, Federico Poli, Benoit Denis, Vincent Berg. LTE-V2X performance
evaluation for cooperative collision avoidance (CoCA) systems. VTC2020-Fall - The 2020 IEEE 92nd
Vehicular Technology Conference, Nov 2020, Victoria, Canada. �cea-02972133�
LTE-V2X performance evaluation for cooperative
collision avoidance (CoCA) systems
Arturo Guizar, Valerian Mannoni, Federico Poli, Benoit Denis and Vincent Berg
CEA, LETI, Minatec Campus, 17 rue des Martyrs, 38054 Grenoble, France {arturo.jimenezguizar, valerian.mannoni, federico.poli, benoit.denis, vincent.berg}@cea.fr
Abstract—The interest for communications between vehicles and the infrastructure or other vehicles (V2X) has recently increased towards connected vehicle applications, and partic-ularly cooperative collision avoidance (CoCA). In this paper, we evaluate the performance of LTE-V2X networks in the context of Intelligent Transportation Systems for traffic collision avoidance applications based on sharing occupancy maps between the infrastructure and the vehicles. We compare by simulation different LTE-V2X configurations under realistic conditions in an intersection scenario. Then, we evaluate every type of com-munication link (V2I and V2V) as a function of the density of vehicles. The results show the potential of the concept for V2X and the trade-offs in terms of reliability, capacity and latency.
Keywords—V2X communication, LTE-V2X, ITS, Sensing-Based Semi-Persistent Scheduling, Performance Evaluation
I. INTRODUCTION
Recent advances in vehicle communications have con-firmed the potential gains in considering real-time exchange of information between vehicles to improve road safety and reduce traffic. The adoption of mature dedicated standards [1], such as the Intelligent Transportation System (ITS)-G5 protocol from the European Telecommunications Standards Institute and the adoption of new 3GPP vehicular modes, also called LTE-V2X [2] [3], are deemed to facilitate the adoption of massive autonomous and assisted driving vehicles. LTE-V2X is very flexible and can adapt according to the network density and coverage conditions. It can adapt using different modulation and coding schemes (MCS) and two deployment configuration modes (Mode 3 for centralized scheduled com-munication or Mode 4 for distributed autonomous transmis-sions). It has been showed that LTE-V2X outperforms the ITS-G5 protocol in terms of reliability and latency [4], two important indicators for traffic collision avoidance applications. LTE-V2X has already been evaluated for road safety sce-narios in [5] [6]. One approach consists in the transmission of cooperative awareness messages (CAM) to share general information between vehicles such as the position, heading or speed. These packets are collected by the eNodeB or a Road Side Unit (RSU) to monitor the road traffic. If the RSU/eNodeB considers a high risk of car collision, it imme-diately sends a warning using a Decentralized Environmental Notification Message (DENM). However, such a centralized approach can only work when all the vehicles are connected to the same network. Another approach relies on a more complex system where vehicles have the capacity to detect obstacles around them and share the information through specific mes-sages to the whole network as introduced in [7]. This approach is possible if a large number of vehicles have advanced sensor capabilities (e.g. LiDAR, radar, etc.) so that vulnerable road users and non-equipped vehicles can be detected.
In this paper, we evaluate the performance of a Cooperative Collision Avoidance (CoCA) system based on the calculation of occupancy maps using LTE-V2X communication for an ur-ban intersection scenario. The aim of this service is to provide
network-assisted safety information to connected/automated vehicles via the available infrastructure to ensure efficient nav-igation through intersections, lane changing, overtaking, etc. Depending on the vehicle capabilities, the CoCA information can include precise digital maps of nearby intersections, as proposed in [7], warning messages to announce a risk of collision and the location of other vehicles and vulnerable users on the road (pedestrians or cyclists). We built and simulated the V2X connectivity using the event-driven simulator (NS3) [8] and a mobility model calculated with Simulation of Urban Mobility (SUMO) traces [9]. We then evaluated the impact of the communication on the CoCA application using different LTE-V2X configurations in terms of reliability, scalability and latency.
The paper is structured as follows. Section II describes the system model from the physical to the application layers. In Section III, we give the details of the methodology and the simulation framework used in this work. Section IV evaluates the performance of the LTE-V2X network supporting the CoCA system. Section V concludes the paper.
II. V2XSYSTEM MODEL FORCOCAAPPLICATION
We considered that both user equipment (UE) and RSU are equipped with a communication system based on the LTE-V2X PC5 mode 4 [2] [3]. They support an ITS protocol architecture and the CoCA system can be integrated at the application layer. A. Cooperative Collision Avoidance (CoCA) system model
The CoCA system model relies on sharing a Local Dy-namic Map (LDM) between road-users and infrastructure to decide on an avoidance maneuver. The LDM is a compressed representation of a probabilistic occupancy map estimated by each user. By cooperatively sharing LDM, each road user benefits from a more accurate and reliable prediction of its surroundings. Users (RSU or UE) may share and use different types of information depending on their built-in physical sensors and their ability to fusion information. We considered three different levels of capabilities. The first level corresponds to a basic vehicle that can only rely on its navigation sys-tem and broadcast periodic-CAM messages. The second level corresponds to a vehicle having more powerful capabilities combined with different physical sensors (e.g. radar, camera, Lidar). Consolidated probabilistic occupancy maps are sent through the V2X communication system. The final level cor-responds to legacy vehicles without any ITS capabilities or vulnerable users that cannot share any information through the network. Connected vehicles and RSU cooperate to detect the type of road users of the last level to prevent any possible collision. Accordingly, we considered two use case scenarios. In the first scenario, we considered that all the vehicles have a LTE-V2X system and can broadcast LDM based information through CAM messages in the network. The RSU collects and processes these messages in order to create a global occupancy map (LDM). This map uses the information sent
in the CAM of each vehicle in order to calculate a vector and predict the possible trajectory of these vehicles. These trajectory predictions are then used to evaluate the probability of collision between the vehicles. If the RSU finds a high risk of car collision, it immediately sends a warning message (i.e. embedded in a DENM message) to avoid the collision.
In the second scenario, we considered the case where some users cannot support a V2X communication nor share a LDM. In this case, the connected vehicles and the infrastructure rely on their on-board sensors (e.g. radar or LiDAR) to detect non-cooperative users and share their trajectory information in their broadcasted occupancy map. To do so, the connected vehicles will calculate a local occupancy map using the measurements coming from their sensors in their on-board LDM application. Then, the connected vehicles broadcast the local occupancy maps through larger dedicated messages for in the network. Finally, the RSU can merge the information from every vehicle to build the global occupancy map and recreate a reliable picture of the whole scene. At this stage, the RSU can either share the global map through dedicated messages or send a simple DENM to warn the vehicles of a risk of collision. Alternative schemes consider the merge of local maps by the vehicles themselves. In this work, we considered that connected UEs and RSUs send LDM information every 100ms. B. LTE-V2X communication system
The LTE-V2X communication system is composed of a physical layer derived from LTE release 15 with a dedicated medium access control (MAC) mechanism.
For the physical layer [2], LTE-V2X operates using a waveform based on Single Carrier Frequency Division Mul-tiplexing Access (SC-FDMA). Channel occupation is defined by three main elements: sub-frames defining the Transmission Time Interval (TTI), subcarriers defining the Resources Blocks (RBs) and channels defining the group of RBs in a sub-frame to transmit user and control information. A TTI has a fixed duration of 1 ms and a RB has a bandwidth of 180 kHz (i.e. group of 12 sub-carriers of 15 kHz). When a user wants to communicate, it must send (in the same sub-frame) the control information (e.g. modulation and RBs used) in Sidelink Control Information (SCI) messages and the data in dedicated Transport Blocks (TBs). The SCI (resp. TBs) transits over the Physical Sidelink Control Channel (PSCCH) (resp. Physical Sidelink Shared Channels (PSSCH)). In order to send the TBs, LTE-V2X defines different MCS, leading to a trade-off between throughput, range and capacity [4].
We considered a 10 MHz bandwidth divided in 50 RBs in the 5.9 GHz band with a power transmission PT x= 23dBm.
We used MCS-1 for SCI, MCS-3 for the small packets of size ∼300 Bytes (such as CAM or DENM messages) and MCS-7 / MCS-15 for the large packets of MCS-700 Bytes or more (for messages dedicated to occupation maps). We considered 50 RBs (48 RBs for TB and 2 RBs for SCI) for 3 and MCS-7 which enables one user per TTI. Moreover, we considered 22 RBs (20 RBs + 2 RBs) for MCS-15 allowing to 2 users per TTI. Thus, MCS-15 can increase the capacity but with a lower range.
For the MAC layer [3], LTE-V2X PC5 mode 4 lets UEs/RSUs autonomously select their radio resources following the Sensing-based Semi-Persistent Scheduling (SB-SPS) [3]. In this scheme, UEs/RSUs can transmit packets every 100 sub-frames (i.e 10 packets per second (pps)) or in multiples of 100 sub-frames (i.e. 1 packet per second minimum). To do so, they reserve a group of sub-channels over a number of consecutive transmissions. A Reselection Counter (RC) is set randomly between 5 and 15 and is decremented by one
for each transmission. When the counter is equal to zero, the vehicle must select and reserve new sub-channels if a probability condition is met (i.e. 1-P, where P is set between 0 and 0.8). The selection of new resources is based on the observation of the previous 1000 sub-frames (i.e. selection window of 1s). Thus, vehicles can estimate which sub-channels are free and therefore, they can select one resource among the free sub-channels to reduce the risk of packet collisions. Here, we considered P=0 which means that vehicles will reselect resources every time the RC decreases to 0.
III. SIMULATIONFRAMEWORK ANDASSUMPTIONS
A. Mobility Model
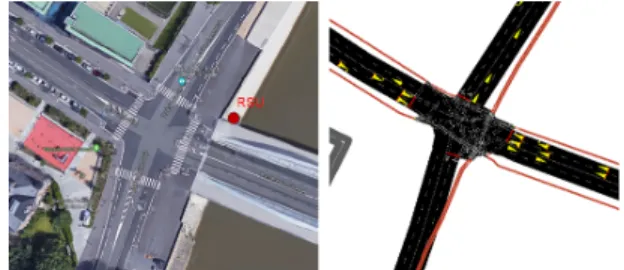
In order to evaluate the performance of a CoCA system, we considered an intersection scenario where a high den-sity of vehicles and vulnerable road users (e.g. cyclists and pedestrians) can be found. To do so, we emulated the road traffic using SUMO [9]. We modelled a road intersection crossing of two main streets located in Lyon, France. Each street is composed of 2+2 lanes in a two-way direction. This intersection crossing is located in a square of 400m x 400m. As shown in Figure 1, the RSU (in red) is placed at the north-west of the intersection and the vehicles and its associated traffic are randomly generated but the density of vehicles is constant. In this deployment, vehicles can reach a speed of up to 50 km/h and respect the traffic lights according to the city regulation. Accordingly, the position of vehicles is reported every 10 milliseconds by SUMO. Thus, we generated different mobility traces over different simulations and set the vehicle density between 0.0001 - 0.01 vehicles/m2. Each simulation had a duration of 60 seconds.
Fig. 1. Representation of the intersection considered in the study with Google Maps (left) and SUMO (right)
B. Network simulation
To evaluate the large-scale performance of V2X networks, we implemented several models in the discrete-event NS3 simulator [8]. To do so, we followed a cross-layer simulation approach between the physical and higher layers to exploit the mobility traces from SUMO. At the application layer, the vehicles generate packets that vary in size (e.g. 300 Bytes for CAM or 700 Bytes for occupancy map messages [7]) and frequency (e.g. 10 pps). These packets are broadcasted following the SB-SPS mechanism and using the MCS defined at the PHY layer. Then, each active UE or RSU receiving a packet estimates the Signal to Interference Noise Ratio (SINR) and derives a Packet Error Rate (PER) depending on the link condition and path loss attenuation. In the end, we obtain a Packet Delivery Ratio (PDR) and latency measure for each UE/RSU over the time and depending on the network density. Successfully received packets can be used by the CoCA fusion application to calculate the global occupancy map depending on the connectivity between vehicles and RSU.
C. Link condition and channel model
Path loss attenuation is necessary to evaluate the link condition for all vehicles using the SUMO traces. To do so, we
consider a path loss model with the following hypothesis: the antenna is placed on the top of the vehicle at 1.7m and the RSU antenna height is 5m. Three types of link condition have been considered: Line of Sight (LoS) to represent direct visibility between the RSU and vehicles; ii) Non-Line of Sight (NLoS) to represent shadowing effect of a building located between UEs; and iii) Obstructed Line of Sight (OLoS) to represent vehicle obstructions between UEs. In our scenario, the RSU and UEs will always communicate in LoS. The UEs navigating in streets that are perpendicular to each other’s will encounter NLoS condition, whereas UEs driving in the same street or in the intersection will experience either LoS or OLoS condition. For the propagation model, we considered the path loss model Winner B1 as defined in [10] and the fast fading model based on the 3GPP Extended Vehicular Model (EVA) as defined in [11]. In the case of OLoS condition, we took the following model, P LOLoS = 23P LLoS + 13P LN LoS, where
P LLoS and P LN LoS represent the pathloss calculated in LoS
and NLoS respectively using the Winner B1 model [10]. For each receiver, we calculate the SINR as a function of the received power, the noise (N) and the sum of interference (PI) as SIN R = N +ΣPPRxI. The signal received power (PRx)
is derived from PRx(d) = PT x− P L(d), where the pathloss
(P L(d)) depends on the link condition and the distance be-tween the transmitter and receiver. We consider an interference (PI) occurred when another UE or RSU used the same RB as
the useful signal. Finally, the noise of each received signal is obtained using N = N F · kT B ·RBs(B)nRBs , where N F is a noise factor figure set to 9dB, kTB represents the thermal noise (i.e. −174dBm/Hz) over the bandwidth (B = 10MHz) and nRBs
RBs(B)
is the ratio between the RB occupied by the received signal and the total number of RBs available in the 10MHz bandwidth.
The calculated SINR is used to estimate a PER on the message. A Look Up Table (LUT) calculated for each MCS (based on the number of RBs and the packet size) is integrated in the NS-3 simulator. These LUT (shown in Figure 2) consider the performance results obtained by following the same methodology as in [4] and assume an EVA fading model. We consider that a LTE-V2X packet is received when the SCI and the TB are correctly decoded using their respective MCS. Note that the MCS-20 used in [5] does not converge through the EVA channel, this is why it is not considered in our study.
Fig. 2. LTE-V2X physical layer performances over the EVA channel
IV. PERFORMANCE EVALUATION
We divided the LTE-V2X communication performance simulations over three types of links: i) The Vehicle to the infrastructure (V2I) connectivity that can be considered as the ”uplink (UL)” to evaluate the capacity of the RSU to collect the CAM messages or the local occupancy maps generated from the vehicles; ii) the V2I connectivity considered as the ”downlink (DL)” to evaluate the capacity of the RSU to
transmit a DENM message or share the global occupancy map (fusion map) with all the vehicles in the intersection; and iii) the Vehicle to vehicle (V2V) connectivity to evaluate the capacity of UEs to share its local information and perform a cooperative LDM with an on-board system.
To do so, we calculate the PDR at the end of each simulation for each type of link. We define the PDR in UL as the number of packets received by the RSU over the number of packets sent by the UEs during a same selection window. The PDR in DL is the number of packets received by the UEs over the number of active UEs located at the intersection when the RSU sends its packets. Finally, we calculate the PDR for V2V links over different distances (d): first considering the whole intersection surface (i.e. 400m x 400m) and secondly considering a fixed range equal to 150 m between the UEs. A. Evaluation of a single simulation
For our first results, we evaluate the performance of a single simulation to identify the different limitations of LTE-V2X connectivity for the CoCA application in terms of PDR and number of packet collisions for each type of link. We considered that a packet collision occurred when two or more UEs/RSU use the same TTI and RBs. During a packet colli-sion, only one transmission is recovered. For this evaluation, we consider the first use case scenario, where all UEs are able to be connected to the network to share LDM information through CAM messages of 300 Bytes in MCS-3 and 50RBs.
Our simulation scenario considers one RSU placed at the intersection (Figure 1) and up to 100 UEs that gradually appear from each sides of the roads. Thus, we identify three main stages as shown in Figure 4: i) Initialization stage (0s-20s) where few UEs were present (low network density). The distance between the UEs and RSU can be relatively high (between 400m and 170m); ii) Established stage (20s-40s) where most of UEs arrived to the crossroad intersection zone (high network density). The distance between the UEs and RSU was reduced (between 100m and 170m) during this stage; and iii) Transitory stage (40s-60s) where some UEs disappeared from the simulation. Most UEs were at the intersection zone (high network density) close to the RSU (average distance around 100m).
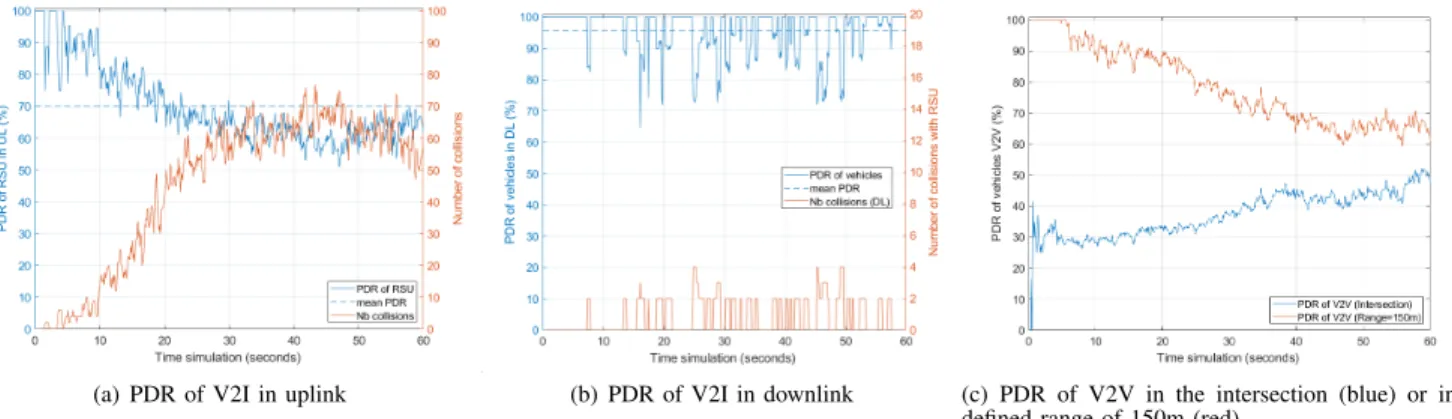
Figure 3 shows the evolution of the PDR for the three different types of link. We can observe that the PDR decreased when the number of UEs increased as the number of vehicles at the intersection is increased. For the PDR of V2I in UL (Figure 3(a)), we measured a PDR of 69.8% over the simulation. The PDR decreased as the number of packet collisions between the UEs is increased. The influence of the path loss between RSU and UEs is low in the intersection scenario compared to the impact of packet collisions. During the initialization stage, the PDR of V2I in UL is high (> 80%). The collisions occurring during this stage are due to the hidden terminal problem. UEs that come from a different street are in NLoS, the SB-SPCS mechanism cannot detect that the selected SB is already in use. It is possible that multiple UEs select the same TTI and cause an interference at the RSU.
For V2I communications in DL (Figure 3(b)), we observe an average PDR of 95.6% over the simulation duration. PDR is high because the RSU is strategically located in visibility of all the road users. During the initialization, the PDR is most of the time at 100%. Interference occurred because of a limitation in the reselection process of the SB-SPS process. When the UEs perform a TTI reselection process at the same time, multiple elements may identify the same channel as free and can select the same TTI for the next transmissions. If this happens, the UE will not be able to receive messages from the RSU.
(a) PDR of V2I in uplink (b) PDR of V2I in downlink (c) PDR of V2V in the intersection (blue) or in a defined range of 150m (red)
Fig. 3. Nb. of packet collisions and PDR comparison of V2I (UL/DL) and V2V links over one simulation of 60s using MCS-3 & 50RBs for packets of 300B.
Fig. 4. Evolution of the average distance (blue) between RSU-UEs and the number of UEs (max. 100) during the simulation.
For V2V communications (Figure 3(c)), we observe an average PDR of 73.5% (resp. 37.5%) over the simulation duration when UEs try to cooperate with other UEs in a range of 150m (resp. for the whole intersection). When the density of vehicles is relatively low, communication between vehicles at short range can be reliably delivered. This is because collisions are seldom and NLoS conditions reduce communication range between UEs. However, when the number of active UEs is in-creased interference due to collisions is significantly inin-creased causing the PDR of V2V to decrease even at short ranges.
From this study, we can conclude that the CoCA system can be possible under limited conditions when all the UEs are connected. Considering a network of 100 UEs, the RSU will be able to share important information to 95% of UE with a period of 100ms. This information may be partially limited because it will be calculated with information coming from ∼60% of the UEs in the 100 ms period. However, we can easily imagine that in a slightly longer period of time, the RSU will be able to receive enough local LDM maps so that it can broadcast a merged map that is sufficiently accurate in terms of location and thus improve security.
B. Evaluation of multiple simulations
We extended our analysis to a larger number of simulations to evaluate the PDR and the refresh rate (Trr) as a function
of the number of UEs at the intersection. Each simulation changes its communication behaviour depending on the en-abled MCS and the UEs density (10-100 UEs). MCS-3 is used to evaluate the transmission of CAM/DENM messages (<300Bytes), while MCS-7 and MCS-15 are used to evaluate the transmission of occupancy map messages (<700Bytes). Thus, we compared the LTE-V2X connectivity for each type of link V2I in UL/DL and V2V.
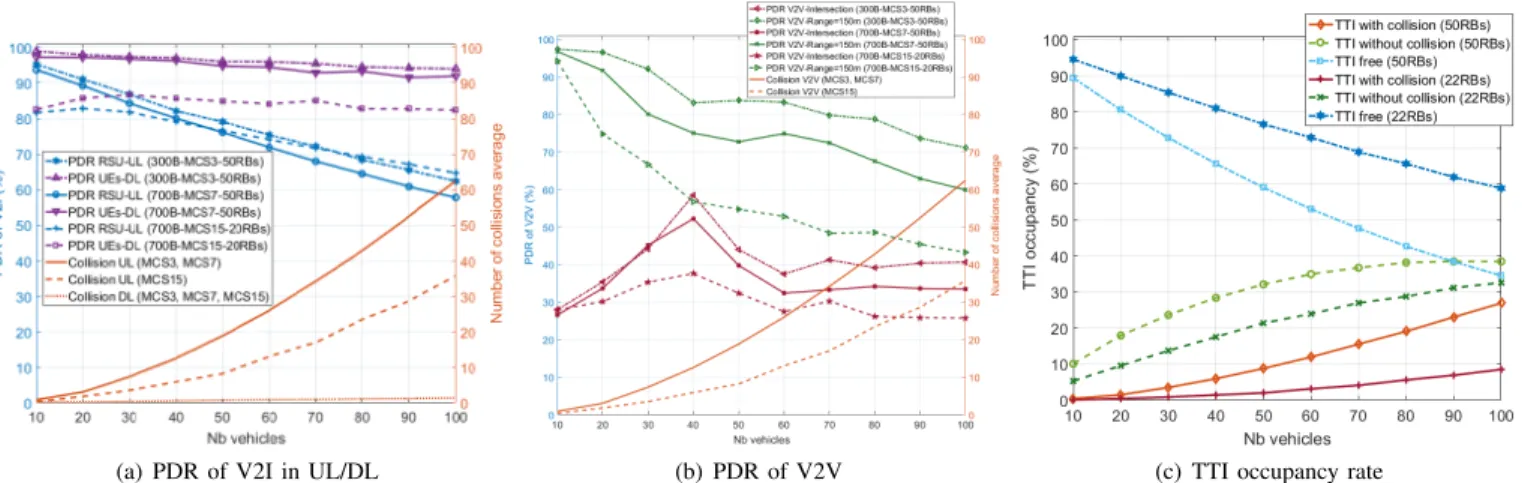
Figure 5(a) shows the PDR of the V2I connectivity in UL and DL as a function of the number of UEs and the MCS configuration. We observed that the PDR decreased for all the MCS when the density increased. In the case of low density (¡20 UEs), MCS-3 and MCS-7 showed a better PDR (>90%) compared to MCS-15. This is because MCS-3 and MCS-7 provide a better performance range compared to MCS-15 at the physical layer (Figure 2). In the case of high density (>80 UEs), we observed the same behavior for the V2I in DL. However, MCS-15 communications perform better for the V2I in UL when compared to MCSs-3 and 7. This is because MCS-15 has a higher capacity as only 22RBs per UE transmission are used when in this mode compared to 50RBs for the other selected modes. Hence, half as many resources need to be shared between the same number of UEs, and therefore less packet collisions. Figure 5(c) shows the average TTI occupancy rate with and without collisions over 100 milliseconds of selection window as a function of the number of UEs for packets with 50RBs and 22RBs. We observe that MCS-15 packets (22RBs) exhibited a significantly lower number of collisions between UEs than MCS-3 and 7 packets and therefore MCS-15 packets were more reliable.
Figure 5(b) shows the PDR for V2V communications as a function of the number of UEs and the MCS configuration. We observe that the PDR at short ranges (¡150m) decreased when the UEs density increased. Moreover, the best PDR to send packets of sizes 300B and 700B respectively are observed for MCS-3 and MCS-7. Indeed, path loss has a more dominant effect for V2V communication as previously mentioned. For instance, when 100 UEs are present, UEs can share CAM information (resp. local occupancy map messages) with a PDR of ∼70% (∼60%) at a range of 150m. When considering the whole intersection the PDR goes down to ∼40% (∼35%). Note that the PDR for V2V communication for the whole intersection remained almost constant during the high density phase (>60 UEs). For lower densities (¡60 UEs), it showed a peak at 40 UEs. This is because at low density, UEs are further apart and the pathloss has a higher influence than collisions while at higher densities, the interference becomes dominant. Finally, Figure 6 shows the refresh rate, Trr , defined as
the average duration between two successful LDM messages for the different communication links. The Trr is calculated
for each type of link as follows: Trr = L + ΣKi=1(1 −
P DRj)i· P DRj· (i · L), where P DRj represents the PDR
for a defined type of link j (i.e. DL, UL or V2V), L represents the application latency to recover the CAM/map messages from vehicles or the global map messages from the RSU and i ∈ [1, K] is a positive integer number defining the probability of receiving the message during the next K selection windows. A selection window lasts for 100 ms and therefore represents
(a) PDR of V2I in UL/DL (b) PDR of V2V (c) TTI occupancy rate
Fig. 5. PDR of (a) V2I in UL/DL and (b) V2V links as a function of the number of UEs using different MCS. (c) TTI occupancy rate (over 100 ms) as a function of the number of UEs using 50 RBs or 22 RBs per TTI.
the minimum latency L to retrieve the LDM information. For V2I communications in DL, we observed that the latency to retrieve LDM information from the RSU is less than 120ms for all MCS. For V2I communications in UL, we observed that the latency to retrieve a CAM (MCS-3) from UEs is 106ms (resp. 160ms) for 10 connected UEs (resp. 100 UEs). However, the latency to retrieve a local occupancy map in V2I UL will take 108ms (resp. 158ms) for 10 (resp. 100) connected UEs using MCS7 (resp. MCS-15). Finally for V2V communications, we observed that the latency to share CAM (resp. local maps) between UEs at a range of 150m is 103ms (resp. 105ms) with 10 UEs and 140ms (resp. 164ms) with 100 UEs. However, the latency to share LDM information between the UEs (red curve) of the whole intersection would be larger than 210ms.
Fig. 6. Refreshment rate as a function of the number of UEs at the intersection
In an emergency situation, the average human reaction time is about 1 second before emergency braking can be applied. An LDM application based on the principle of cooperative exchange of information between vehicles and an RSU will improve this reactivity and thus reduce the number of acci-dents. Indeed, a vehicle using this type of LDM application will be able to have a precise vision of the scene (e.g. the intersection) and therefore of the potential dangers in less than 206 ms for 10 vehicles and 275 ms for 100 vehicles for the 700B/MC7/50RBs configuration. Even if we add a processing time of about 200 ms for merging and interpreting the information, the use of an LDM application is still relevant in the context of improving road safety.
V. CONCLUSION
In this study, we introduced a cooperative traffic collision avoidance system using LTE-V2X in the intersection scenario. To do so, we evaluated different LTE-V2X configurations by simulation using a realistic mobility and channel models.
The results show the trade-offs in terms of capacity, range, reliability and latency for each type of link (V2I or V2V) depending on the density of vehicles in the intersection. Thus, we showed that it is better to send the local occupancy maps in UL using MCS-7 (resp. MCS-15) when the network presents a low UEs (resp. high UEs) density. However, it is preferable that the RSU sends the global occupancy map in DL using MCS-7 to reach the UEs in all the intersection. If the connection between UEs and RSU is limited, UEs can still cooperate by sharing their local occupancy maps using MCS-7. Future work will consist in evaluating the LDM CoCA application in terms of positioning accuracy and traffic collision detection.
ACKNOWLEDGMENTS
This work was supported by the European Union’s Horizon 2020 research and innovation programme under 5G-HEART project (grant agreement No 857034).
REFERENCES
[1] K. Abboud, H. A. Omar, and W. Zhuang, “Interworking of dsrc and cellular network technologies for v2x communications: A survey,” IEEE Trans. Veh. Technol., vol. 65, no. 12, pp. 9457–9470, Dec. 2016. [2] 3GPP, “Technical Specification Group Radio Access Network; Evolved
Universal Terrestrial Radio Access (E-UTRA); Physical layer proce-dures,” Release 15, TS 36.213, v 15.2.0., Tech. Rep., June 2018. [3] 3GPP, “Technical Specification Group Radio Access Network; Evolved
Universal Terrestrial Radio Access (E-UTRA); Medium Access Control (MAC) protocol specification ,” Rel. 15, TS 36.321, Tech. Rep., 2018. [4] V. Mannoni, V. Berg, S. Sesia, and E. Perraud, “A comparison of the V2X communication systems: ITS-G5 and C-V2X,” in 2019 IEEE 89th Vehicular Technology Conference (VTC2019-Spring), April 2019. [5] F. Eckermann, M. Kahlert, and C. Wietfeld, “Performance analysis
of V2X mode 4 communication introducing an open-source C-V2X simulator,” in 2019 IEEE 90th Vehicular Technology Conference (VTC2019-Fall), Sept. 2019.
[6] J. Zang, V. Towhidlou, and M. Shikh-Bahaei, “Collision avoidance in V2X communication networks,” in 2019 IEEE Wireless Communica-tions and Networking Conference (WCNC), Apr. 2019.
[7] A. Pereira da Silva, I. Horiya Brahmi, S. Leirens, and B. Denis, “System-level simulation of cooperative sensor data fusion strategies for improved vulnerable road users safety,” in IEEE Workshop on Positioning, Navigation and Communications (WPNC), Oct. 2019. [8] NS-3, “The network simulator,” [online] https://www.nsnam.org/, 2020. [9] P. A. Lopez, M. Behrisch, L. Bieker-Walz, J. Erdmann, Y.-P. Fl¨otter¨od, R. Hilbrich, L. L¨ucken, J. Rummel, P. Wagner, and E. Wießner, “Micro-scopic traffic simulation using SUMO,” in The 21st IEEE International Conference on Intelligent Transportation Systems, 2018.
[10] P. Kyosti, J. Meinila, L. Hentila, X. Zhao, T. Jamsa, C. Schneider, M. Narandzic, M. Milojevic, A. Hong, J. Ylitalo, V.-M. Holappa, M. Alatossava, R. Bultitude, Y. de Jong, and T. Rautiainen, “WINNER II Channel Models,” in D1.1.2 V1.2, IST-4-027756, Sept. 2007. [11] 3GPP, “Technical Specification Group Radio Access Network; Evolved
Universal Terrestrial Radio Access (E-UTRA); User Equipment (UE) Radio Transmission and Reception ,” TS 36.101, Tech. Rep., 2018.