HAL Id: hal-00328537
https://hal.archives-ouvertes.fr/hal-00328537
Submitted on 27 Sep 2007
HAL is a multi-disciplinary open access
archive for the deposit and dissemination of
sci-entific research documents, whether they are
pub-lished or not. The documents may come from
teaching and research institutions in France or
abroad, or from public or private research centers.
L’archive ouverte pluridisciplinaire HAL, est
destinée au dépôt et à la diffusion de documents
scientifiques de niveau recherche, publiés ou non,
émanant des établissements d’enseignement et de
recherche français ou étrangers, des laboratoires
publics ou privés.
atmosphere based on an instrumented container: The
new CARIBIC system
C. A. M. Brenninkmeijer, P. Crutzen, F. Boumard, T. Dauer, B. Dix, R.
Ebinghaus, D. Filippi, H. Fischer, H. Franke, U. Frieß, et al.
To cite this version:
C. A. M. Brenninkmeijer, P. Crutzen, F. Boumard, T. Dauer, B. Dix, et al.. Civil Aircraft for the
regular investigation of the atmosphere based on an instrumented container: The new CARIBIC
system. Atmospheric Chemistry and Physics, European Geosciences Union, 2007, 7 (18), pp.4976.
�10.5194/acp-7-4953-2007�. �hal-00328537�
www.atmos-chem-phys.net/7/4953/2007/ © Author(s) 2007. This work is licensed under a Creative Commons License.
Chemistry
and Physics
Civil Aircraft for the regular investigation of the atmosphere based
on an instrumented container: The new CARIBIC system
C. A. M. Brenninkmeijer1, P. Crutzen1, F. Boumard5, T. Dauer2, B. Dix3, R. Ebinghaus4, D. Filippi5, H. Fischer6, H. Franke7, U. Frieß3, J. Heintzenberg8, F. Helleis1, M. Hermann8, H. H. Kock4, C. Koeppel1, J. Lelieveld1, M. Leuenberger9, B. G. Martinsson10, S. Miemczyk11, H. P. Moret9, H. N. Nguyen10, P. Nyfeler9, D. Oram12,
D. O’Sullivan12, S. Penkett12, U. Platt3, M. Pupek1, M. Ramonet5, B. Randa1, M. Reichelt8, T. S. Rhee1,*, J. Rohwer11, K. Rosenfeld11, D. Scharffe1, H. Schlager13, U. Schumann13, F. Slemr1, D. Sprung6, P. Stock13, R. Thaler11,
F. Valentino9, P. van Velthoven14, A. Waibel15, A. Wandel16, K. Waschitschek17,**, A. Wiedensohler8, I. Xueref-Remy5, A. Zahn6, U. Zech18, and H. Ziereis13
1Max-Planck-Institut f¨ur Chemie (MPI), Air Chemistry Division, Joh.-J.-Becherweg 27, 55128 Mainz, Germany 2Lufthansa Technik, Lufthansa Base, Frankfurt Airport, FRA WE 24, 60546 Frankfurt, Germany
3Institut f¨ur Umweltphysik, Universit¨at Heidelberg, INF229, 69120 Heidelberg, Germany
4GKSS-Research Centre, Institute for Coastal Research (GKSS), Max-Planck-Str. 1, 21502 Geesthacht, Germany 5Laboratoire des Sciences du Climat et de l’Environnement (CNRS), Unit´e mixte CNRS/CEA, CEA Saclay Orme des
Merisiers – Bat.703, Pi`ece 26, 91191 Gif sur Yvette Cedex, France
6Institut f¨ur Meteorologie und Klimaforschung (IMK), Forschungszentrum Karlsruhe, Weberstr. 5, 76133 Karlsruhe,
Germany
7Enviscope GmbH, Arnoldhainer Str. 5, 60489 Frankfurt, Germany
8Leibniz-Institut f¨ur Troposph¨arenforschung (IFT), Permoserstr. 15, 04318 Leipzig, Germany 9University Bern, Institut f¨ur Klima- und Umweltphysik, Sidlerstr. 5, 3012 Bern, Switzerland 10University of Lund, Division of Nuclear Physics, P.O. Box 118, 22100 Lund, Sweden
11Lufthansa Technik, VIP & Government Jet Maintenance, Weg beim Jaeger 193, 22335, Hamburg, Germany 12University of East Anglia, School of Environmental Sciences, Norwich, NR4 7TJ, UK
13Deutsches Zentrum f¨ur Luft- und Raumfahrt (DLR), Institut f¨ur Physik der Atmosph¨are, 82230 Wessling, Germany 14Royal Netherlands Meteorological Institute (KNMI), P.O. Box 201, NL-3730 AE, de Bilt, the Netherlands
15Lufthansa, Environmental Division, Frankfurt Airport Center, Hugo-Eckener-Ring B.649, 60549 Frankfurt, Germany 16Heggeman Aerospace AG, Zeppelinring 1–6, 33142 B¨uren, Germany
17Garner CAD Technik GmbH, Argelsrieder Feld 2/4, 82234 Oberpfaffenhofen, Germany 18KOLT Engineering GmbH, Argelsrieder Feld 20, 82234 Oberpfaffenhofen, Germany *now at: Korean Polar Research Institute, Sangrokgu Sa-2-dong 1270, Ansan 426-744, Korea **now at: RUAG Aerospace Services GmbH, P.O.Box 1253, 82231 Wessling, Germany
Received: 13 March 2007 – Published in Atmos. Chem. Phys. Discuss.: 18 April 2007 Revised: 30 July 2007 – Accepted: 18 September 2007 – Published: 27 September 2007
Abstract. An airfreight container with automated
instru-ments for measurement of atmospheric gases and trace com-pounds was operated on a monthly basis onboard a Boe-ing 767-300 ER of LTU International Airways durBoe-ing long-distance flights from 1997 to 2002 (CARIBIC, Civil Aircraft for Regular Investigation of the Atmosphere Based on an Instrument Container, http://www.caribic-atmospheric.com). Subsequently a more advanced system has been developed, using a larger capacity container with additional equipment
Correspondence to: F. Slemr
(slemr@mpch-mainz.mpg.de)
and an improved inlet system. CARIBIC phase #2 was im-plemented on a new long-range aircraft type Airbus A340-600 of the Lufthansa German Airlines (Star Alliance) in De-cember 2004, creating a powerful flying observatory. The in-strument package comprises detectors for the measurement of O3, total and gaseous H2O, NO and NOy, CO, CO2, O2,
Hg, and number concentrations of sub-micrometer particles (>4 nm, >12 nm, and >18 nm diameter). Furthermore, an optical particle counter (OPC) and a proton transfer mass spectrometer (PTR-MS) are incorporated. Aerosol samples are collected for analysis of elemental composition and par-ticle morphology after flight. Air samples are taken in glass
containers for laboratory analyses of hydrocarbons, halo-carbons and greenhouse gases (including isotopic composi-tion of CO2) in several laboratories. Absorption tubes
col-lect oxygenated volatile organic compounds. Three differ-ential optical absorption spectrometers (DOAS) with their telescopes mounted in the inlet system measure atmospheric trace gases such as BrO, HONO, and NO2. A video
cam-era mounted in the inlet provides information about clouds along the flight track. The flying observatory, its equipment and examples of measurement results are reported.
1 Introduction
In view of the ever more detailed questions about the myriad of coupled chemical and physical processes in the global at-mosphere, while witnessing human induced disturbances of this system that affect climate within a human’s lifetime, the need for advancing observational capacities is evident. Be-sides intensive atmospheric chemistry research largely based on national and international measurement campaigns us-ing ship, aircraft, satellites and ground stations, there is a need for systematic approaches in observing the chemistry and composition of the atmosphere with sufficient detail. To some degree the making of “observations” is moving from the realm of science to that of technology and engineering. Our understanding of atmospheric processes, be it chemical or physical, has grown enormously, and further advancement is based on improved models and an adequate supply of suf-ficiently detailed, relevant data. Next to the understanding of processes, there is a clear need for monitoring to compre-hend the entire system. Besides this, for systems as complex and variable as the Earth’s atmosphere (not to mention its coupling with the other complex components of the plane-tary system, like the biosphere) the need for monitoring in terms of meteorology and chemistry, and detecting changes is evident (www.ipcc.ch).
One has indeed seen an increasing number of surface based monitoring sites (e.g., ESRL-GMD, http://www.cmdl. noaa.gov/, GAW, http://www.wmo.ch (Montzka et al., 2003; WMO, 2004)), and the detailed information we have about H2, CH4, halocarbons and CO2 is by virtue of this
excel-lent work of monitoring. At several of such observato-ries the number of trace gases measured has been increased by installing sophisticated systems for measuring a host of trace gases in real time (the ALE/GAGE/AGAGE network http://cdiac.ornl.gov/ndps/alegage.html (Prinn et al., 2000)). Thus, next to the basic, yet powerful process of collecting air samples on a weekly to monthly basis, highly detailed high frequency information becomes available. This all enables a better understanding of trace gas sources, transport, chem-istry, and mixing. Generally, observatories are on mountains or in coastal regions for the purpose of obtaining data repre-senting air masses that are not affected by immediate input from nearby sources of air pollution. Next to these stationary
and dedicated sites, platforms of opportunity such as ships are used by which the marine boundary layer can be probed (Lelieveld et al., 2004). Even the Trans-Siberian railroad with an instrumented observation wagon transported over the 9000 km long track from Moscow to Vladivostok and back is used (http://www.troica-environmental.com; Crutzen et al., 1998; Hurst et al., 2004).
Remote optical sensing from the surface is a power-ful technique that can deliver vertical profiles or column integrated data for aerosols and certain trace gases con-tinuously (e.g., NDSC, EARLINET, http://lidarb.dkrz.de/ earlinet/index.html). Remote sensing from satellites for tro-pospheric composition has been increasing strongly and its near global coverage is its major advantage.
Although the need for monitoring can be made clear with relative ease, the idea has really never thrilled science fund-ing agencies since long-term commitments are involved. This forces us to be creative in developing affordable tech-nologies. Atmospheric monitoring using civil aircraft is in-herently a logical concept and in the mean time constitutes a valuable component in the colorful spectrum of global observation systems (see also IGACO, Integrated Global Chemistry Observations, http://www.igospartners.org/). The civil aircraft based projects offer the advantage of regular, long-distance, and long-term coverage. In particular the 10 to 12 km cruising altitude range which interestingly coin-cides with the upper troposphere/lower stratosphere region (UT/LS) at mid- to high latitudes is of high relevance. The UT/LS plays an important role in terms of radiative forcing by infrared-active species, such as water vapor, ozone, cirrus cloud particles which are strong absorbers of outgoing long-wave radiation. At the same time, the complex UT/LS still is one of the less well documented and understood regions of the atmosphere. Main reasons for this gap in our knowl-edge are the extreme dynamical and chemical complexity of the UT/LS and of course the difficulty to regularly monitor the UT/LS at affordable cost. Although long-range aircraft spent most time cruising, vertical profiles of trace gases near airports can also be obtained.
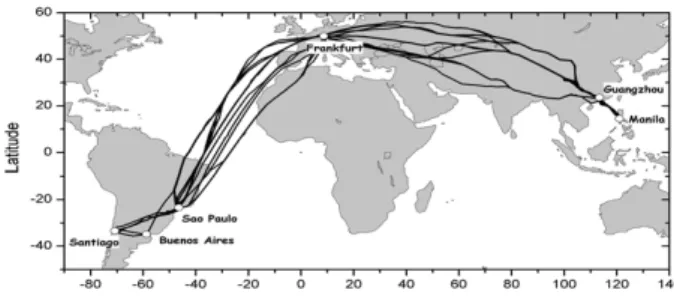
Of course, the use of civil aircraft also involves some re-strictions. As elucidated, the cruising altitude is limited, giving UT/LS information at mid-latitudes, and free tropo-sphere information in the tropics. Furthermore, having a sin-gle home airport, such as Frankfurt as a base, only a lim-ited albeit large region of the globe can be covered. Fig-ure 1 shows the CARIBIC flight patterns which obviously are somewhat Eurocentric. A more global coverage can be obtained when combining such projects stationed in different continents. Since there is some spread in actual trajectories, the coverage is not limited to narrow corridors. Local peaks of aerosols and trace gases indicate that exhaust plumes of other aircraft are occasionally encountered, but most air in-tercepted is representative for the background air. The ef-fects of other aircraft can be easily identified. The reason for the quite different flight routes to distant destinations is that
some airlines can economize on fuel usage by using optimal meteorological conditions.
Using civil aircraft as a measurement platform is not a new idea. Walter Bischof in his 1970 Tellus paper already refers to the collection of air samples in flight for CO2
measure-ments in 1962, and the practice of using commercial airlin-ers gained some momentum in the late sixties and seventies when CO and O3 distributions were determined using
in-struments strapped onto passenger seats analyzing air from the cabin ventilation system of commercial airliners (Seiler and Junge, 1969; Seiler and Junge, 1970; Tiefenau et al., 1973; Fabian and Pruchniewicz 1977). Note that in those days ozone was not removed from the cabin air supply. In the seventies, a dedicated inlet and measurement system for CO, condensation nuclei, and O3were permanently installed
on five Boeing 737 aircraft within the GASP (Global Atmo-spheric Sampling Project) project of NASA (Falconer and Holdeman, 1976; Nastrom, 1979; Pratt and Falconer, 1979). After that, commercial airliners were not used, with the ex-ception of an instrumented airfreight container operated by two persons onboard a Boeing 707 of Lufthansa Cargo Ser-vices (Dickerson, 1984; Connors et al., 1991).
Several projects involving civil aircraft, but using differ-ent approaches, were initiated in the 1990s. The MOZAIC project (Measurement of Ozone and Water Vapor by Air-bus In-Service Aircraft) utilizes instruments permanently in-stalled in nominally five Airbus A340-300 aircraft to provide measurements of O3 and H2O (since 1991) and of CO and
NOy (since 2001) (e.g., Marenco et al., 1998). MOZAIC
continues, but eventually will be superseded by a new ap-proach using smaller instrument packages being developed and certified for Airbus A340 aircraft (IAGOS project, http: //www.fz-juelich.de/icg/icg-ii/iagos). In the NOXAR project (Measurements of Nitrogen Oxides and Ozone along Air Routes) a Boeing 747 of Swissair was quipped with an NO, NO2, and O3 analyzer (Brunner et al., 2001). The JAL
project (Japan Airlines) was initially based on the collection of air samples in flasks using the air compressed by one of the jet engines. The samples were analyzed for greenhouse gases and in several instances even for their isotopic compo-sition (Matsueda and Inoue, 1996). The JAL project is be-ing extended, incorporatbe-ing five aircraft for continuous CO2
monitoring, whereas two of these have air sample collection systems (deployed monthly). Finally, the CARIBIC project started regular flights in November 1997 (Brenninkmeijer et al., 1999, http://www.caribic-atmospheric.com). CARIBIC relies on an automatically operating airfreight container equipped with in-situ measuring instruments and sampling devices for more than 60 different trace gases and aerosol properties. The strategy of CARIBIC is to optimize the num-ber of trace compounds that are detected and collected on the basis of regular flights. Thus once a month the container is installed in the aircraft and de-installed after presently 4 sequential flights.
One may ask what advantages a container system offers
Fig. 1. Examples of flight routes to Santiago de Chile and Manila
involving 4 flight legs each (brief stopovers in Rio de Janeiro and Guangzhou). The variations in the exact route and altitude mean that generally other air traffic has little if any direct influence on the intercepted air. For the flight levels of long range aircraft and typical routes, about 40% of the intercepted air is stratospheric.
and how CARIBIC can fill gaps in the current observational capacity. Foremost is that the container concept allows a wide range of equipment to be deployed. The extensive ar-ray of in situ analyzers combined with air and aerosol sam-plers renders CARIBIC a “flying observatory”. The com-prehensiveness of the payload enables studies of chemical and dynamical interactions between trace species, and the combined information facilitates the analysis of source and sink processes. The time elapsed between flights is used to analyze the air and aerosol samples while the container equipment is maintained and calibrated. The turnaround time achieved has been one month, whereas the fastest turnaround time could be one week. Frequent, highly consistent, very detailed datasets become available for several regions of the globe, which are ideally suitable for process and climatolog-ical studies. An example is the reconstruction of the an-nual cycles of trace gases in the tropical troposphere, the mid-latitude upper troposphere and the mid-latitude lower-most stratosphere. Moreover, CARIBIC can help to ver-ify retrievals from satellite based remote sensing instruments (Peylin et al., 2007).
In this paper we present the new CARIBIC system com-prising the inlet system, the modifications of the aircraft, and in particular the container and instrumentation. In Sect. 2 we briefly summarize the previous CARIBIC system. General considerations pertaining to the combining of the container concept with the given aircraft type and its operation, as well as the inlet system, the container and modifications to the air-craft are discussed in the following section. In Sect. 4 the cur-rent instrumentation is described in detail giving examples of measurement results for equipment new to this system.
2 CARIBIC development
The first CARIBIC container was deployed on a Boeing 767-300 ER of LTU International Airways that had been retrofitted with an aerosol and trace gas inlet system
(Her-Fig. 2. Position of the CARIBIC container and the inlet system on
the Airbus 340–600.
mann et al., 2001). The aircraft modifications and the instru-mentation were described by Brenninkmeijer et al. (1999). Until the decommissioning of the aircraft in the course of the LTU fleet renewal in May 2002, 75 flights had been carried out mostly on the routes from Germany to the In-dian Ocean and to the Caribbean. Because of the limited range of the aircraft only a limited number of flights into the southern hemisphere (in this case South Africa) could be made. The data set has so far provided a basis for stud-ies of aerosol particle elemental composition, formation and climatology of aerosols in the tropopause region (Heintzen-berg et al., 2002, 2003; Hermann et al., 2003; Martinsson et al., 2001; Papaspiropoulos et al., 2002), the interpreta-tion of tropospheric O3and CO correlations, as well as their
correlation in respect to transport across the tropopause and chemical processing (Zahn et al., 2000, 2002a, 2004a and b; Zahn and Brenninkmeijer, 2003), and for process stud-ies (M¨uhle et al., 2002; Zahn et al., 2002b). The data have also contributed to studies of trace gas cycles in the atmo-sphere (Krol et al., 2003; Sturges et al., 2000) and enabled studies of the isotopic composition of CO including14CO (Joeckel, 2000) as a global tracer for OH, and of H2and its
D/H ratio for constraining budget calculations for the atmo-spheric H2budget (Rhee et al., 2006). Work on the
applica-tion of CO2concentrations and concomitant highly accurate 13C and18O isotope data is in progress. Furthermore, for
360 air samples extracts of condensable gases (CO2, N2O,
hydrocarbons, etc.) have been archived for D/H,13C/12C and
37Cl/35Cl measurements of hydrocarbons and CH
3Cl (Pupek
et al., 2005). All in all a considerable amount of systematic and hitherto unavailable data have been obtained. Data from the CARIBIC-Boeing 767 flights are accessible on request (consult www.caribic-atmospheric.com).
3 The new CARIBIC system
3.1 General considerations
The aircraft of choice was a new Airbus A340-600 (certified in 2004), which is a long range (14 000 km) stretched mem-ber (up to 380 passengers) of the A340 family (www.airbus. com). Lufthansa acquired 10 of these aircraft over the period May 2003–October 2004, and this fleet is expanding. The integration of the CARIBIC system in the aircraft required
several modifications. Most important were the structural changes to the hull around the mounting position of the in-let system, followed by the installation of the air tubing and cables. Also needed were a container connector interface, a control panel in the cockpit, and modifications to electrical hardware and electronics and software. At all stages tests were to be conducted and the modifications were concluded with a test flight. The estimated two weeks of work on the aircraft needed would have inflicted an undesirable down-time and it was decided to use the grounding period of the aircraft used for retrofitting it with a broadband internet sys-tem (Boeing Conexxion) by Lufthansa Technik (FLYNET). The joint modifications took place November 2004.
The A340-600 differs from the previously used Boeing 767 in a for CARIBIC important aspect, namely the cargo loading door of the forward cargo bay is located towards the front of the aircraft, and not near the wings (Fig. 2). This means that the measurement container’s position is towards the wing box, in the rear of the forward cargo bay above the leading edge of the belly fairing. The reason for this is that the CARIBIC container must be loaded first into the aircraft followed by the standard contingent of cargo containers and pallets. At the airport of destination the regular cargo can be unloaded, leaving the CARIBIC container in position. Upon return at the airport of origin, first the cargo is unloaded, followed by the careful de-installation and removal of the CARIBIC container. Thus, the aircraft structure implies that the container position is in the aft of the forward cargo bay.
Ideally, the air/aerosol inlet system should be positioned directly beneath the container. Short tubing minimizes con-tamination/loss for gases and aerosol particles. However, be-low the actual container position the belly fairing is present. Its shell is too thin to support an inlet system. Therefore, the actual position of the inlet system was shifted forward by about 2 m. As a result of these aircraft structural con-siderations, the container is about 25 m away from the nose of the aircraft and the inlet system about 23 m. From a me-chanical/structural point of view the height of the inlet sys-tem should be minimal. From an analytical point of view one should sample air totally outside the aircraft’s bound-ary layer. Data from Airbus Hamburg about the exact air-flow field and pressure distribution around the aircraft were used to find a good compromise. According to their data, the boundary layer thickness at the position of the inlet is ∼25 cm. The CARIBIC inlet system is, despite its more complex geometry, not an over-dimensioned probe, being comparable in size to drain masts and VHF antennas.
The scientific and analytical requirements have to be met within the constraints of the aircraft’s structure, safety and operation, and hence compromises concerning the analyti-cal capabilities have to be made. The safety requirements of civil aircraft are extensive and strict. Compounds clas-sified as dangerous (e.g. liquid nitrogen) cannot be used in a passenger aircraft. Concerning the container and the instruments there are mechanical requirements (loads on
equipment, racks and container as a whole during accel-eration/crash conditions), electrical requirements (bonding, fuses etc), and requirements concerning combustible materi-als. Furthermore, specifications with respect to the control of equipment (computer controlled switching on and off of the many analyzers) and concerning the absence of conducted or radiated electromagnetic energy have to be met. For the in-let system there are strict regulations concerning its impact on the aerodynamics, on the integrity of the aircraft hull, ab-sence of vibrations, its behavior at icing conditions, stability, etc. The responsibility for the design and construction of all modifications to the aircraft, the integration of the con-tainer, and for the certification process with the German and European Aviation Authorities were entirely with Lufthansa Technik (www.LHT.de).
The technical process of realizing CARIBIC took about two years and was completed by a test flight during which an extensive protocol of tests, including vibration measure-ments, was conducted.
The intention is that the new CARIBIC system will be op-erational over at least ten years. Airline companies operate in a most competitive commercial environment, and scien-tific projects (against a background of global change) can in principle be tolerated if these do not disturb routine operation and do not cause significant additional cost. Years of posi-tive experience with CARIBIC involving 2 airlines, 2 aircraft types, and 2 containers especially concerning their installa-tion, flying and de-installation give great confidence in the sustainability in this respect. The environment division of Lufthansa supports CARIBIC as one of several activities to better understand the atmosphere and to reduce pollution and noise. The scientific consortium of CARIBIC pays Lufthansa Cargo standard rates for the airfreight cost of the measure-ment container.
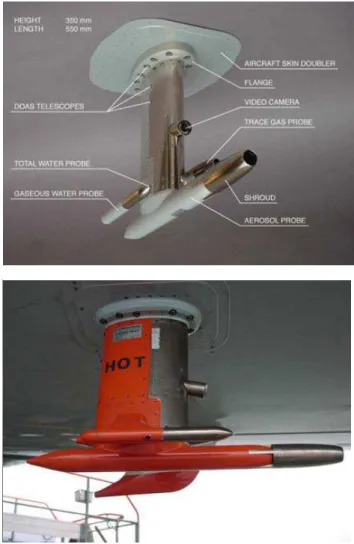
3.2 The CARIBIC inlet system
Details of the inlet system, in particular the aerosol sampling characteristics, will be published elsewhere. Here, we sum-marize the main aspects. The inlet has been designed around the analytical requirements a) to optimize aerosol particle sampling at cruising speeds of ∼250 m/s, b) to provide ded-icated air intakes for different trace gases with heating sys-tems for inlet tips and tubing, c) to provide ram pressure thus obviating the use of pumps for some instruments, and d) to host a set of three miniature DOAS telescopes for remote sensing and a video camera for observing clouds. The inlet structure is that of a hollow spar machined out of a block of aluminum, to which the three flanges of the three sep-arate probes are fixed. A fore- and aft-shell form the en-closure and contribute to the rigidity of the assembly, using almost 100 fasteners. Figure 3 shows the inlet system as de-signed for LHT by Garner CAD Technics GmbH (Oberp-faffenhofen, Germany) in close cooperation with the sci-entists and manufactured by Heggeman Aerospace (B¨uren,
Fig. 3. Photographs of the CARIBIC inlet system. On the right
hand a liquid drain mast is visible behind the inlet.
Germany). It consists of 25 structural aluminum elements and is 55 cm long, 34 cm high, 18 cm wide. Its mass is about 3.5 kg. All essential parts exposed into the flight direction are nickel plated to improve hardness. The total number of components is about 60, comprising the aluminum parts, tub-ing, heater elements, temperature sensors, insulation, plugs, DOAS telescope, brackets, and the video camera.
One of the main scientific design considerations was to obtain representative aerosol sampling characteristics at the cruising speed of nominally 250 m s−1. This means that the
aerosol tube (diffuser tube) should sufficiently slow down the air flow from which aerosol particles are to be sampled. It also means that a shroud is applied. This shroud is a 12 cm long, 4 cm OD aerodynamic cylinder upstream of the aerosol diffuser tube itself and supported by four prongs. Most air entering the shroud passes through the four circular slits be-tween the prongs. Because the shroud is heated, one of these 7×7 mm2square-cross-section prongs is hollow to supply a channel for feeding through temperature sensor and heater
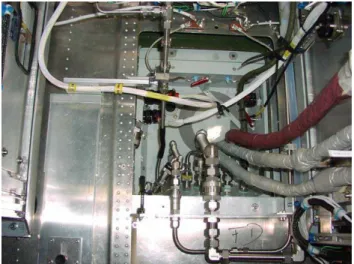
Fig. 4. Frontal photo of the container (top) and a schematic drawing
of the position of individual instruments viewed from above (bot-tom).
wires. The aerodynamic function of the shroud is to make the aerosol sampling characteristics as little dependent on flight conditions (angle of attack) as possible (cf. e.g. Mur-phy and Schein, 1998). A fraction of the air flowing through the shroud enters the inlet tip of the diffuser tube with its 6.4 mm inlet orifice which is located centrally 8 cm down-stream inside the shroud. Both shroud and this inlet tip are heated by heating foils to prevent icing. The diffuser itself is a four degree half-angle diffuser while the outlet orifice is 4 mm. The actual sample air for the particles is taken down-stream inside the diffuser via a centrally positioned, unheated forward pointing electro-polished 3/8” stainless steel pick-up tube bent with a radius of 100 mm. Because the sampled air is heated from ambient temperatures of −60 to −30◦C to container temperatures around 30◦C, all aerosol ments in the container can be considered as “dry” measure-ments. Moreover, not only water will evaporate from the par-ticles, but also semi-volatile species like ammonium nitrate or organics (An et al., 2007; Stanier et al., 2007), because the heating in the inlet system is strong (60 to 90 K), the sam-pling lines to the aerosol instruments are relatively long (be-tween 3.4 and 4.0 m), and respective residence times are long with approximately 0.5 s to 0.8 s. Unfortunately, the length of the sampling lines was determined by the aircraft structure
and not by analytical reasons. This evaporation must be con-sidered, when interpreting the results of the OPC measure-ments (Sect. 4.6) and the particle sample analysis (Sect. 4.7). The water probe is mounted on the right (looking in flight direction), 1 cm above the aerosol probe. A forward facing (heated) inlet tip of 4 mm inner diameter collects air for to-tal water measurement (gas phase plus droplets/crysto-tals) us-ing ram pressure to force the air through the H2O
analyz-ers. Fluid dynamical calculations by Airbus Hamburg indi-cate that the air displacement by the aircraft itself causes an enhancement of cloud particles at the position of the total wa-ter inlet of 12–19%, depending on the angle of attack. Based on the theory by Liu et al. (1989), the non-isokinetic inlet configuration causes a further cloud particle enrichment of the total water inlet of 220–500%, depending on the actual aircraft speed (provided by the ARINC flight data) and the measured inlet sample flow of 50 vol-l/min. Both cloud par-ticle enhancement factors are considered for calculating the amount of cloud water/ice. More detailed information and an estimation of the measurement uncertainty (currently esti-mated to <30%) will be given in a technical paper. A second, also heated but sideward facing inlet at near neutral pressure, like a static port, provides air for the measurement of gaseous water. The air from both intakes is transported to the instru-ments through electro-polished stainless steel tubing heated to 60◦C. Just before the H2O instrument, 0.6–3.1 vol-l/min
of the two sample flows of 30–50 vol-l/min are extracted for passing through the three H2O analyzers.
The trace gas probe is located on the left, 7 cm above the aerosol probe. It consists of a 3 cm inner diameter diffuser tube with an inlet orifice of 14 mm diameter and outlet orifice of 12 mm diameter providing an effective ram pressure of about 90–170 hPa depending on cruising altitude and speed. The inlet tip of the trace gas probe/intake is also heated to prevent icing. A small fraction of the air passing through the diffuser is withdrawn from the center flow by a 12 mm ID PFA lined tube perpendicular to the flow direction. This trace gas tube is heated to 40◦C. The design of the trace gas probe ensures separation of droplets as well as ice particles from the sampled air. The exhaust air from the container is vented at the rear end of the flange of the pylon close to the skin of the aircraft.
The DOAS telescopes (apertures of 1.5 degree) are mounted in a single aluminum block. Two 6 mm ports al-low light to enter the sideward (limb) looking telescopes (10 degrees below and above the horizon), whereas a simi-lar hole in the inlet flange feeds light into the nadir telescope. The light from the telescopes is conducted into the container to the spectrograph/detector units of the DOAS instrument by three optical cables each containing 4 individual quartz fibers. Details are given in Sect. 4.16.
A video camera (Model AVS470, Aerial View Systems, Newport Beach, CA, USA) with heated window is mounted at the leading edge of the main pylon, and allows inspection of the aerosol shroud to verify the absence of ice/rime and
the observation of clouds during daylight flights. Between measurement flights, the inlet openings, and the DOAS ports and the camera window are sealed.
The presence of an aperture in the aircraft’s skin, which is integral part of the pressurized hull system, is of special concern. To assure structural integrity and to distribute loads a doubling flange at the outer fuselage (Fig. 3) and additional frames have been used. The structural concept of the in-let itself and the concept of the inin-let to airframe interface was developed by KOLT Engineering GmbH (Oberpfaffen-hofen, Germany) in close cooperation with all partners fol-lowed by extensive calculations over a one year period for impacts of acceleration, vibration, fatigue and abuse loads (like bird strikes). The incorporation of supporting structural components and a proper choice of materials and treatment ensures safe long term operation.
3.3 The CARIBIC container
The measurement container (Fig. 4) is a modified LD-11 air-freight container (3.1×1.5×1.6=7.44 m3) with a maximum allowable gross weight of 3175 kg. As the actual gross weight is less than half of it, more equipment can possibly be integrated, although another limiting factor is given by the available electrical power and the amount of heat that can be dissipated in the cargo bay during the flight. The cost of air freight is determined by the volume of the container, not its actual gross weight. The container is based at MPI in Mainz and is placed on a hydraulic platform. This allows the con-tainer to be lifted upwards and rolled into the institute’s truck equipped with a roller system. At the airport a high-loader receives the container and lifts it into the aircraft.
The original LD-11 container, manufactured by Alcan Sin-gen GmbH, was modified to meet the requirements given by the accommodation of the instruments and the safety consid-erations. The modifications included: 1) Using 9 cm high stringers covered by an aluminum alloy plate, the single sheeted floor plate was turned into a stiff sandwich structure. 2) A rectangular opening was cut in the double floor to pro-vide space for connecting the instruments to the container connector bracket incorporated in the cargo floor of the air-craft. 3) To enable access to the instruments from both sides for maintenance and calibration work, the rear wall of the container housing was replaced by three removable panels and its front opening was equipped by two large doors. The front doors and rear panels increase the mechanical stability of the container and were designed with special emphasis to reduce emission of electromagnetic radiation. 4) Altogether six aluminum racks of four different types were manufac-tured to carry the instruments and the auxiliary equipment. All racks are 1.36 m high. The three double racks and a sin-gle one behind the floor opening on the right of the Fig. 4 are 19” wide. The two racks on the left are 650 mm wide. To facilitate mounting and dismounting, all racks are fastened to shock mounted frames using only 4 bolts. For all racks the
Fig. 5. Tubing connecting the inlet with the container connector
bracket. The 3 optical fiber cables are continuous from the tele-scopes in the inlet to the spectrographs in the container.
centers of gravity were calculated and this information was used in the calculations of the compatibility with accelera-tion requirements of up to 9 g (depending on the x, y, z direc-tion). 5) A ventilation system was incorporated. Four radial fans force air from the cargo bay into the sandwich flooring space from where it is distributed evenly around all equip-ment racks. Two additional radial fans withdraw air from the top right hand side (viewed in flight direction) and blow this waste air in the direction of the aircraft’s cargo bay air cir-culation/conditioning intakes. 6) Two smoke and over-heat detectors as used in Airbus aircraft (Model SD9472-00, Ap-paratebau Gauting GmbH, Gauting, Germany) are mounted and are linked to a CARIBIC control panel in the cockpit.
The calculations, design and reinforcement of the con-tainer, and the construction of the racks were carried out by Enviscope GmbH in Frankfurt, Germany. The total weight of the container with the instruments is currently 1470 kg.
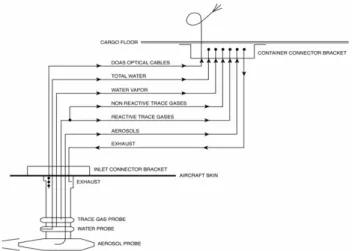
3.4 Sample air, electric and data systems
Figure 5 shows the layout of the tubing system inside the belly of the aircraft below the cargo floor, starting at the inlet system via the inlet connector bracket mounted inside on the skin of the aircraft to the container connector bracket which is countersunk into the cargo floor. This container connector bracket contains the detachable power, signal, and air con-nectors. The air tubing connectors are Swagelok company’s Quick-fit couplings, except for the aerosol tube which is a standard bulkhead union in order to prevent contamination of the aerosol samples by wear-off from the o-rings. There are three 3/8′′O.D. electropolished stainless steel tubes. One is for aerosol particles and two supply the air for measure-ment of total and gaseous water. The latter ones are heated to 60◦C. The air flow from the trace gas intake is split di-rectly above the inlet connector bracket. The air for the
Fig. 6. Photo of the container connector bracket viewed through
the cutout in the container floor. The aerosol tube is on the left (with short black flexible section). On the right the insulation of the 3 heated tubes is visible. The exhaust tube is in the centre. The non reactive trace gas tube is to its left. The 3 electrical power and data connectors are black. Also visible is the dark green sleeve of the optical fiber cables in the upper right corner. Altogether 12 connec-tions between container and aircraft are involved plus an electrical bonding lead.
whole air sampler is drawn through an unheated 1/2′′ O.D. electro-polished stainless steel tube, whereas the air for most of the other trace gas instruments is led through a 3/4′′O.D. aluminum tube kept at 40◦C which is lined using a sepa-rate thin walled PFA tube. Each tube is connected on ei-ther side (inlet side, and container side) using flexible tub-ing. This measure is entirely because of aircraft structural considerations (avoidance of mechanical stress) and in fact is a complication from the analytical point of view. Flexible, armored PTFE tubing sections were used. For the aerosol tube we used electrically conductive PTFE (SS-NGS6-AA-23X, Swagelok Companies) in order to eliminate the possi-bility of electrostatic charging leading to the risk of particle loss. The tube heaters are aviation quality Adel Wiggins’s (Los Angeles, CA, U.S.A.) silicone rubber based ribbon heaters and their temperatures are controlled using temper-ature controllers and 1000Pt tempertemper-ature sensors (Minco, Minneapolis, MN, U.S.A.). The gases (i.e. air) exhausted by the container equipment are expelled through a 3/4′′stainless steel exhaust tube. The three quartz fiber cables (3 mm O.D.) from the DOAS telescopes to the analyzer are basically un-interrupted (fragile) connections from inlet to spectrographs, bundled together and protected by a flexible sheath. The control unit (power and data conversion) of the camera is permanently mounted in the aircraft near the inlet connector bracket.
Figure 6 shows a photograph of the fairly crowded con-tainer connector bracket. Three electrical connectors provide
power and data from the aircraft and connect the heaters and temperature sensors in the inlet system (a 60 pin connector). One BNC connector feeds the video signal from the video camera control unit. When the container is not onboard, the quartz fiber cables are carefully coiled inside a drum (not shown in Fig. 6) placed inside the tub. Moreover, the tube openings are sealed with blind connector plugs and the con-tainer connector bracket opening is covered by a floor panel.
4 Instrumentation
The scientific and auxiliary equipment is powered by two power supplies that convert the aircraft 3 phase 115 VAC (400 Hz) into 24 and 28 VDC. The smaller of these sup-plies (Model EL 4kW MegaPAC, VICOR, Sunnyvale, Ca., U.S.A), called base power supply (BPS) (19′′, 4 height units tall (1 HU =44.45 mm) and a mass of 22.5 kg), provides 2 kW for the individual instrument and master (control) computers and other essential functions during the take-off and land-ing when the power consumption is limited. The essential functions include the heat-up and evacuation of certain in-strument parts which have a relatively long spin-up time. Af-ter take-off, the second, main power supply with a capacity of 8 kW (manufactured by Aircraft Electronics Engineering GmbH, Seefeld, Germany) (19′′, 4 HU, 68 kg) is switched on. The actual total power consumption of the fully instru-mented container is 5.5 kW and the peak load is 7.0 kW. For comparison, the total in-flight electrical power of an A340-600 is about 4 times 80 kW, yet electrical power usage by the container has to be kept low to minimize heat generation, to save energy, and to not affect any aircraft functions.
The power delivered by each of the power supplies is recorded by the master computer. In case of smoke and/or overheat detection, an optical and acoustical warning signal is given by the CARIBIC panel in the aircraft cockpit, and the supply of power to the container system can be switched-off by the pilot. The position and meteorological data recorded by the aircraft are provided via an ARINC bus system and stored by the master computer in the container.
The data distribution box (19′′, 4 HU, 20 kg) forms the third interface between the container and the aircraft. It trans-fers signals from the smoke detectors to the aircraft, creates a relay signal indicating the presence of the container in the aircraft, transfers the ARINC aircraft data to the master com-puter, controls the temperature of altogether 18 heaters in the aircraft and the container (tip heaters of the inlet, tub-ing heaters in the pylon, the aircraft and the container), and provides the power for the camera in the pylon. The control unit of the camera is permanently installed in the aircraft.
The master computer controls all equipment and stores dif-ferent types of data (ARINC, temperatures, pressures, com-munication with the instruments), but not measurement data. It communicates with the instruments via a custom made Ethernet network. After take-off (weight-on-wheels signal
disappears) the main power supply is switched on and from then on the master computer activates sequentially the indi-vidual instruments to avoid power surges. In flight, the com-puter checks the status of the individual instruments through simple algorithms and initiates their shut down if the commu-nication is lost. The computer also monitors the conditions inside the container, the inlet system and the sample tubing system using 4 internal pressure sensors, 2 external tempera-ture sensors, and 18 signals from the temperatempera-ture controllers in the data distribution box. The third major function of the master computer is the storing of the ARINC data. ARINC (in this case ARINC 429) is the most widespread commer-cial avionic data bus system. This extensive set of flight data is standard in civil aircraft and provides among others the pressure altitude, static temperature, longitude, latitude, time, and aircraft state parameters (e.g. flight angles).
Another central provision in the CARIBIC container is the gas supply unit. It was decided to have all calibration gases and supply gases stored in aluminum cylinders inside one rack that also contains the pressure regulators. The only ex-ception is a cylinder with calibration gas used for the PTRMS which for analytical reasons has to be close to the PTRMS in-strument. The supply of oxygen for the production of ozone used in the NO and NOyanalyses is in standard aviation steel
cylinders with breathing quality oxygen. These cylinders are additionally protected by concentric steel cylinders. The rea-son for this is to comply with the safety requirement that if in case of an engine burst, fan blades that are ejected at high speed and penetrate the fuselage and container, these cannot possibly damage the cylinders to that degree that a rapid re-lease of oxygen would result.
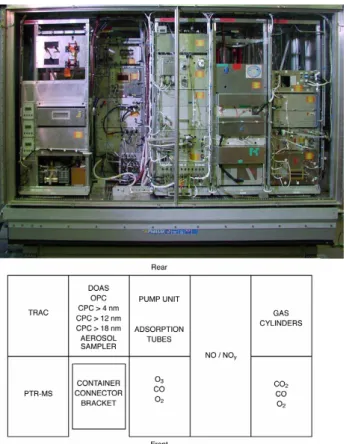
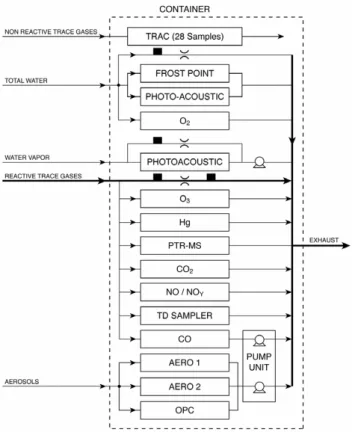
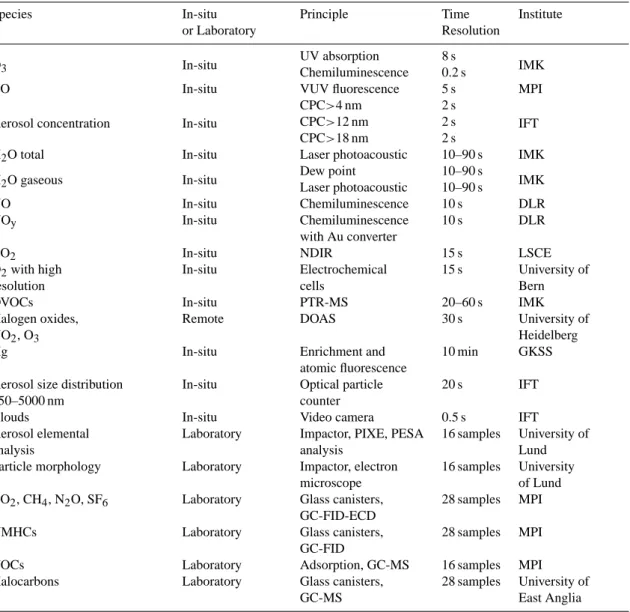
Table 1 gives the overview of the instruments in the new CARIBIC container with the main specifications and lists the institutions responsible for their development and operation. Figure 7 shows schematically the tubing in the container pro-viding air sample and collecting the exhaust gases of the instruments. Most instruments are equipped with internal pumps (not shown). The relevant aspects of the individual instruments are described below.
4.1 Total and gaseous water
The budget of atmospheric water vapor is of great relevance for climate and chemistry. It has recently been shown that a significant fraction of upper tropospheric air is supersatu-rated (up to 200%) over ice, a feature until very recently nei-ther captured by the ECMWF meteorological forecast model, nor by climate models. One objective of CARIBIC is to collect additional information about distributions of over-saturated regions and of the amount of water trapped in cirrus clouds
The water vapor instrument (19′′, 6 HU, 29 kg) comprises two different detectors. A commercial chilled-mirror frost point hygrometer (CR2, Buck Research, Boulder, USA) measures humidity using the well established (absolute)
Fig. 7. Air distribution system inside the CARIBIC container. The
black squares indicate pressure sensing locations. The water va-por measurements do require a suction system as there is no ram pressure on this port. The flow through the ozone sensors is not as-sisted by a pump. The mercury, CO2and O2analysers depend on
pumps for pressurizing the air. For the remaining analysers where no pumping is shown, the air sample flow is maintained by suction provided by pumps in the respective units.
method. Next to this, a two-channel photo-acoustic (PA) laser-spectrometer developed at the Department of Optics and Quantum Electronics at the University Szeged in Hun-gary (Boz´oki et al., 1999 and 2003; Szak´all et al., 2001) measures the water vapor content in a relative mode using the laser light to excite water molecules and measuring their thermal relaxation. This technique is much faster than the frost point hygrometer.
The Buck CR2 frost point hygrometer and one of the PA channels are supplied with air from the forward facing (to-tal water) inlet. This orifice collects air having the gaseous water component plus that represented by solid and liquid phase. These phases are enriched (Sect. 3.2). The air flow through the 3/8′′ OD (7.55 mm ID) SS electro-polished in-let tube (heated to 60◦C, overall length 2.6 m) is forced by the ram pressure of 60–100 hPa. An orifice upstream of the water vapor instrument restricts the air flow to ∼50 vol-l/min, by which ∼75% of the ram pressure is maintained. The air is discharged through the outlet tubing connected to the exhaust in the pylon. Only a small sampling flow of
Table 1. Instrumentation of the CARIBIC container onboard of the long-range Airbus A340-600 of Lufthansa.
Species In-situ Principle Time Institute
or Laboratory Resolution
O3 In-situ
UV absorption 8 s
IMK Chemiluminescence 0.2 s
CO In-situ VUV fluorescence 5 s MPI
Aerosol concentration In-situ
CPC>4 nm 2 s
IFT CPC>12 nm 2 s
CPC>18 nm 2 s
H2O total In-situ Laser photoacoustic 10–90 s IMK
H2O gaseous In-situ Dew point 10–90 s IMK Laser photoacoustic 10–90 s NO In-situ Chemiluminescence 10 s DLR NOy In-situ Chemiluminescence 10 s DLR with Au converter
CO2 In-situ NDIR 15 s LSCE
O2with high In-situ Electrochemical 15 s University of
resolution cells Bern
OVOCs In-situ PTR-MS 20–60 s IMK
Halogen oxides, Remote DOAS 30 s University of
NO2, O3 Heidelberg
Hg In-situ Enrichment and 10 min GKSS
atomic fluorescence
Aerosol size distribution In-situ Optical particle 20 s IFT
150–5000 nm counter
Clouds In-situ Video camera 0.5 s IFT
Aerosol elemental Laboratory Impactor, PIXE, PESA 16 samples University of
analysis analysis Lund
Particle morphology Laboratory Impactor, electron 16 samples University
microscope of Lund
CO2, CH4, N2O, SF6 Laboratory Glass canisters, 28 samples MPI GC-FID-ECD
NMHCs Laboratory Glass canisters, 28 samples MPI GC-FID
VOCs Laboratory Adsorption, GC-MS 16 samples MPI Halocarbons Laboratory Glass canisters, 28 samples University of
GC-MS East Anglia
3.1 Vol-l/min (driven by the remaining 45–75 hPa pressure difference across the flow restrictor) is branched-off from the main airflow. The split that feeds the air to be analyzed is a 1/4′′ OD (4.37 mm ID) SS electro-polished sampling line (heated to 60◦C), connected directly upstream of the flow re-strictor. The Buck CR2 frost point hygrometer receives a sample flow of 2.5 vol-l/min with the balance of 0.6 vol-l/min being passed through the respective total water PA channel.
The second PA channel is connected to the sideward facing inlet via an identical 3/8′′ OD SS inlet tube kept at 60◦C. As this inlet opening is slightly below ambient pressure, a membrane pump is used to assist the same air flow of 40– 60 vol-l/min by suction. Also in this case a sampling flow of 0.6 vol-l/min is branched-off and fed into the second PA channel.
Laboratory based comparisons with a high-precision chilled mirror frost point hygrometer (MBW 373-LX, MBW Calibration Ltd., Wettingen, Switzerland) give a precision and total uncertainty of the Buck CR2 hygrometer of ∼0.5 K. The precision of the two PA spectrometers currently is ∼0.5 µmol mol−1at ambient pressures. The time resolution is 30–300 s for the Buck frost point hygrometer and 5–10 s for the PA sensors, depending on absolute humidity and pres-sure. The performance in flight is determined by the instru-ment characteristics, airflows, and by the inlet system, in-cluding the heated tubing. An example of the possibilities offered by the H2O instruments is given in Fig. 8,
highlight-ing the detection of cirrus clouds. The actual sensitivity of the photo-acoustic channel (which may vary by a few per-cent within an hour) is inferred by correlating the data with
those of the chilled mirror hygrometer data during post flight data processing.
4.2 Ozone
Ozone is the most essential component in airborne atmo-spheric chemistry research. In the UT/LS it plays a role in the IR radiation budget and is an important transport tracer for instance to define a chemical tropopause (Zahn and Bren-ninkmeijer, 2003).
For ozone we also apply 2 detection techniques, namely an accurate, precise dual-beam UV-photometer and a very fast solid-state chemiluminescence detector. The ozone instru-ment (19′′, 6 HU, 29 kg) takes its sample air from the trace gas probe of the inlet system, using the “reactive trace gases” (PFA-coated) tubing to the container (Fig. 7).
The custom made dual-beam uv-photometer measures the light absorption of O3in the UV (Hartley band). Light from
a low-pressure mercury discharge lamp emitting mainly at 253.7 nm (>90%) is directed via a beam splitter through two 38 cm long optical cells. One cell contains the ambient air, the other one ambient air scrubbed of O3. Major parts of
the optics are adapted from the commercial instrument M49 of Thermo Fisher Scientific. The sample flow of ∼3 vol-l min−1 is maintained by the ram pressure of the trace gas inlet obviating the need of a pumping system. The electron-ics for amplifying and processing the signal as measured by a CsTe photocathode (Hamamatsu, R1228) was newly devel-oped. Using extremely low-noise amplifiers and an integrat-ing 24 bit A/D converter, it measures the light intensity with a frequency of 122 Hz, in contrast to the common sampling rate of typically 0.1 Hz. This high-frequency measurement allows for a partial elimination of photon flux fluctuations that are characteristic for mercury discharge lamps. Compar-isons with an extremely stable (but slow) laboratory standard (UMEG-NIST with 2.7 m absorption length which agrees with the NIST standard SRP #15 within <0.5%) shows dif-ferences below 0.5 nmol mol−1 over the studied measure-ment range of 2–400 nmol mol−1. The 1-σ precision is cur-rently 0.3 nmol mol−1 at 1 bar at a measurement response time of 4 s and an accuracy of ∼1%. This is a factor of 2– 3 faster and more accurate compared to similar instruments. Like other UV-photometers, it constitutes in principle an ab-solute measurement device, i.e., the O3mixing ratios is
cal-culated solely by using known physical properties (O3
cross-section, optical path length etc.) and a ratio of measured voltages. Therefore, a calibration is not required and the in-strument can be viewed as a (flying) O3standard for the fast
chemi-luminescence detector described below. Nevertheless, the instrument is cross-checked regularly with the UMEG-NIST standard. Interferences with water vapor are extremely small mainly due to the newly designed heated O3scrubber
that is still able to remove as much as 800 nmol mol−1ozone yet has a very small surface for water adsorption. Thus mea-surement artifacts due to fast changes of water vapor
concen-Fig. 8. The potential of both measuring gaseous water and total
wa-ter using fast detector illustrated by the detection of cirrus clouds over China at ∼11.4 km pressure altitude. The grey band is the range between 100% saturation relative to ice and water. The photo-acoustic signal (green) for water vapor reaches saturation versus ice at 05:02 UTC–05:20 UTC and 05:23 UTC–05:42 UTC. The pho-toacoustic signal for total water (blue, vapor plus ice crystals) ex-ceeds the vapor signal during these two periods, although otherwise agreement is close (the difference of total and gaseous water signals is shown as a grey signal at the bottom). This indicates that 2 fields of cirrus clouds were intercepted. The photoacoustic measurements are fast (<5 s response time), while the chilled mirror hygrometer (red) shows “overshooting” (e.g. at 05:22 UTC) which is typical for this instrument type.
trations (Wilson and Birks, 2006), e.g. during cloud cross-ings, are minimized. An example of the O3data from the
UV-photometer is shown in the flight-overview of Fig. 9. The fast O3sensor is based on the chemiluminescence of
O3on the surface of an organic dye adsorbed on silica gel
powder deposited on a 1 cm diameter aluminum disk (G¨usten et al., 1992). The measurement frequency is 10 Hz, which, at the cruising speed of ∼250 m/s, result in a high spatial res-olution of merely ∼25 m. However, turbulence within the inlet tube causes mixing of air which degrades the spatial resolution to effectively 30–40 m distance, still ample for our purposes. The fast O3sensor is linear but needs calibration
because of its variable sensitivity. The UV photometer mea-surements are used during the post-flight data processing for defining the fast sensor’s scale. The sensor disc is typically used for ∼5 flight sequences (20 flights) during which its sensitivity gradually decreases to ∼1/3 of its initial value.
4.3 Carbon monoxide
Carbon monoxide (CO), together with methane, constitutes the major global atmospheric burden of reduced gases, and as such affects the oxidative self-cleansing process of the tropo-sphere. It is a major pollutant (energy generation, transport,
Fig. 9. Overview of the data from flight # 166 (Frankfurt to Guangzhou). The route and the locations of whole air sampling are shown on the map. Flight altitude, latitude, and some mete-orological parameters are given in the uppermost field. The two fields below it show O3, CO, particle densities, NO, NOy, and
humidity data. The following field depicts the results of analyses of whole air samples for CH4, CO2, N2O and SF6. Data on ace-tone, acetonitrile, methanol, and total gaseous mercury (TGM) are shown in the lowermost field. We refer to the KNMI website (http: //www.knmi.nl/samenw/campaign support/CARIBIC/#LH) for de-tailed meteorological information.
and biomass burning) and is produced in situ in the oxidative chains of methane and other hydrocarbons. CO levels decline significantly crossing into the LS, whereas in the UT the fre-quent large scale pollution plumes carry large amounts. CO and O3are often studied together, with CO being an indicator
for pollution and a precursor molecule for O3formation. The
challenge of carbon monoxide measurements in CARIBIC is to have fast, precise data with an internationally accepted cal-ibration.
Gas chromatography with a mercury oxide based reducing gas detector, as used in CARIBIC #1 has been the standard measurement technique for decades. The serious
disadvan-tages are the limited spatial resolution (GC technique) and the non-linearity of the detector. Therefore, a vacuum ultra-violet (VUV) fluorescence instrument (Volz and Kley, 1985; Gerbig et al., 1996 and 1999) has been incorporated instead. Here, CO molecules are excited by VUV radiation in an op-tical cell at a pressure of ∼10 hPa. The VUV radiation is generated by a RF generated discharge in a cell flushed with a CO2-Ar mixture, while the fluorescence is measured using
a photomultiplier. Because oxygen strongly absorbs in the VUV range used, the region between the light source, detec-tor and photomultiplier is flushed with nitrogen.
The CO analyzer (19′′, 4 HU, 21 kg) is based on a com-mercial instrument (Model AL 5002, Aero-Laser, Garmisch-Partenkirchen, Germany) which was retro-fitted with valves for automatic calibration and communication board for re-mote control by the master computer. Flow controllers have been added to stabilize the flow of nitrogen used to purge the fluorimeter in order to achieve a more stable detector signal, and the CO2-Ar gas mixture for the RF discharge lamp. A
larger pump (MD4 Vario, Vacuubrand) has been used to keep sample air flow at 90 ml min−1at standard conditions (STP, i.e. 273.2 K, 1013.2 hPa). The housing has been modified to ensure that electromagnetic interference through conduc-tion and radiaconduc-tion (e.g., for the discharge lamp) is absent. To achieve a stable calibration, the tubing from the gas cylinder to the instrument is being flushed three times with a calibra-tion gas before each flight.
Zero and span of the instrument are determined in flight every 25 min. For this purpose zero air is generated by passing air through a cartridge filled with a CO oxidiz-ing catalyst (Sofnocat, Foulger and Simmonds, 1993) via a 3-way solenoid valve which subsequently feeds a calibra-tion gas mixture into the instrument. The mixing ratios are then calculated using the average of zero and span sig-nals bracketing the measurement interval. During a 10 h flight from Frankfurt to Guangzhou the zero and the calibra-tion signals for 250 nmol mol−1 are typically 2864±43 cps and 18 077±110 cps, respectively. The uncertainty esti-mated from the propagation of the uncertainties of calibration gas and the standard deviations of the measurement, zero, and calibration signals is typically 1.9% or 1 nmol mol−1, whichever is greater. Time resolution determined by the re-sponse to switching of the 3-way valve between zero and cal-ibration gas was 5 s for 90% of the signal change.
The advantages of the VUV technique are excellent lin-earity, reproducibility, and fast response. Over the period of 2 years its sensitivity declines by ∼50% which can be re-stored by cleaning the optical cell. Tests on air cylinders show agreement with other laboratories within fractions of a nmol mol−1 over a range of 50 to 300 nmol mol−1. Re-sults are calculated relative to the NOAA/ESRL standards based on as comparisons at the GAW quality assurance cen-ter at EMPA, D¨ubendorf, Switzerland. An example of the CO measurements is presented in the flight-overview of Fig. 9.
4.4 Nitrogen oxides
NO is one of the main catalysts in tropospheric photochem-istry. Produced by soils, lightning and combustion processes it reacts readily with ozone, resulting in NO2and O2. During
the daytime, NO2 is photolysed, releasing an oxygen atom
that reforms ozone. The important catalytic role is clear in reactions such as HO2 + NO, which yields OH and NO2.
NO recycles radicals and maintains the oxidative cycle. In CARIBIC we measure NO and NOy(the sum of all reactive
nitrogen species: NO, NO2, HNO3, PAN, 2 N2O5, HNO2,
HNO4, and nitrates), with the future option of also
detect-ing NO2. In the stratosphere total reactive nitrogen (NOy)
consists mainly of HNO3. In the troposphere the NO, NO2,
HNO3 and PAN are the main components of total reactive
nitrogen. Systematic data for nitrogen oxides in the UT/LS region are rare which underscores the importance of this pay-load in CARIBIC.
The technique applied for the measurement of NO and NOy is similar to the one used on the DLR Falcon 20
re-search aircraft for several years (Ziereis et al., 2000). It is based on detecting the light emission from the reaction of NO with O3 using a photomultiplier. The sum of reactive
nitrogen compounds (NOy)is measured by a catalytic con-version technique in which all NOy species are reduced to
NO in a gold tube maintained at 300◦C using a reducing gas added to the sample air flow. Two NO detectors allow the concomitant measurement of NO and NOy. The commonly
used CO reducing gas in the converter is not allowed on civil aircraft because of its toxicity. Therefore, hydrogen from a small metal hydride storage system (storage capacity 2 g H2)
is used here. The conversion efficiencies for typical NOy
and non-NOycompounds using H2instead of CO were
de-termined in the laboratory and found mostly to agree with those found by Volz et al. (2005). The conversion efficiency for NO2and HNO3with H2was the same as with CO.
Oppo-site to the quantitative conversion of HCN reported by Volz et al. (2005) we found only 6–9% conversion efficiency. The resulting HCN interference is then correspondingly smaller than the one stated by Volz et al. (2005) and amounts 6– 27 pmol mol−1at typical HCN background concentrations of 100–300 pmol mol−1.
The NO+NOysystem constitutes one complete rack (19′′,
24 HU, 171 kg) stretching from the front to the back of the container. The chemiluminescence detectors are operated at a sample flow of 1.5 l min−1(STP) extracted from the PFA
lined trace gas sampling line. To avoid the loss of nitric acid, a major compound of NOy, PFA sampling lines heated to
40◦C are used also inside the analyzer systems (Neuman et al., 1999). For obtaining an optimal signal to noise ratio, the photomultipliers are cooled by a closed cycle refrigerator to about – 30◦C. To suppress the influence of air sample hu-midity on the sensitivity of the instrument, the oxygen/ozone stream is humidified. With this precaution, no sensitivity change during a flight has been observed so far.
Sensitivity checks of the two NO detectors are carried out before and after each flight using a standard concentration of NO in N2. The NO standard is diluted into the NO free zero
air by means of a mass flow controller. The sensitivities of the two NO channels are about 15 counts s−1 mol pmol−1. The background signal is determined every 10 min for a pe-riod of about 1 min and is typically 1000-2000 cps. The con-version efficiency of the gold converter is checked before and after each flight by adding known amounts of NO2produced
by gas phase reaction of NO with O3. Zero air artifacts are
determined before and after each flight, and also in flight ev-ery 2 h by addition of synthetic air from a gas cylinder. The detection limit of the NO and NOy system for 10 s data is
about 1 to 2 pmol mol−1 (2σ ). The estimated accuracy for the NO and NOymeasurements is 8% for an ambient NO
level of 50 pmol mol−1 and 7% for an ambient NO y level
of 450 pmol mol−1. During the POLINAT-2 (Pollution from
Aircraft Emissions in the North Atlantic Flight Corridor) and EXPORT 2000 (European Export of Particulates and Ozone by Long-Range Transport) campaigns NO and NOy
mea-surements on board the Falcon 20 made by DLR were com-pared to similar measurements on board other aircraft during flight. The instruments on the different aircraft showed good agreement (Ziereis et al., 1999; Brough et al., 2003). An ex-ample of the NO and NOydata is given in the flight overview,
Fig. 9.
4.5 Aerosol particles – condensation particle counters
Aerosol particles are emitted directly by a wide range of nat-ural and man-made processes. As they are also formed in situ by gas-to-particle conversion, their physical and chemi-cal properties vary strongly. Also their number distribution is highly variable mainly due to their short atmospheric resi-dence time in the order of hours to weeks. Aerosol particles affect the Earth’s radiation budget directly through light scat-tering and absorption but also indirectly (cloud processes), clearly having a significant – yet ill quantified – impact on climate (www.ipcc.ch). In view of the relatively modest information we have about UT/LS particles, this aspect of CARIBIC has some priority.
The CARIBIC container houses three units with aerosol instruments, which are supplied with air via electro-polished stainless steel tubing from the aerosol inlet. These units are located as close to the container connector bracket as possi-ble to minimize loss of particles in tubing. The low pressure needed to maintain the flow through the systems using criti-cal orifices is provided by a diaphragm pump (MD4C, Vacu-ubrand) in the pump unit of the container (19′′, 8 HU, 55 kg). In the units named AERO 1 (19”, 6 HU, 30 kg) and AERO 2 (19′′, 5 HU, 42 kg) altogether three modified condensation particle counters (CPCs, TSI Model 7610, TSI Inc., St. Paul, MN, USA) are installed. AERO 2 also contains the particle sampler unit described in Sect. 4.7. CPCs measure the inte-gral particle number concentration of all particles larger than
Fig. 10. The occurrence of ultrafine particles (between 4 and 12 nm)
was recorded just after descending through clouds (but not inside the clouds) while approaching S˜ao Paulo Airport. The use of the video camera allows to investigate if cloud droplets or ice particles impinge on the leading edge of the shroud or the aerosol diffuser tube do enhance particle counts significantly or not, and hence, if there are measurements artifacts. In this case, there seem to be no artifacts. The origin of the ultrafine particles observed below the cloud is a question still to be answered.
a certain threshold diameter. Inside these CPCs, the sam-ple air is first saturated with butanol vapor and cooled subse-quently in order to grow the particles by condensation of this working fluid. The enlarged particles are finally detected by scattering of light from a laser diode. Extensive laboratory tests at operating pressures of 160–1000 hPa were made to ensure the proper function of the instruments at cruise alti-tudes, and to obtain pressure-dependent counting efficiency curves (Hermann and Wiedensohler, 2001). Experimental uncertainties for Aitken mode and ultrafine particle num-ber concentrations amount to ±10% and ±35%, respectively (Hermann et al., 2003).
To measure concentrations in different particle size ranges, the lower threshold diameters of two CPCs were shifted to a smaller and a larger diameter, respectively, by changing the temperature difference between the saturator and the con-denser block. The new temperature differences are 11◦C and 26◦C (compared to 17◦C in the original version) and addi-tional temperature sensors were used to monitor the temper-atures of the saturator and the condenser block in each CPC. Consequently, the three CPCs now have lower threshold di-ameters (50% maximum counting efficiency) of 4, 12, and 18 nm, respectively, at 200 hPa operating pressure (Hermann and Wiedensohler, 2001). The upper threshold diameter of
particles detected by the CPCs is estimated to about 2 µm and is rather determined by particle losses inside the CPCs than by the particle sampling efficiency of the CARIBIC in-let system. However, as in the UT the Aitken mode particles normally dominate the total particle number concentration (as it can be seen by comparing the CPC and OPC data), the exact upper threshold diameter is not important for the CARIBIC CPC measurements.
The time resolution of the CPCs was set by the control software to 2 s, corresponding to a spatial resolution of about 0.5 km. During data processing, measured number concen-trations are corrected for particle losses in the inlet (esti-mated using the known inlet sampling efficiency of the old CARIBIC inlet and the CFD modeling flow field results) and in the sampling line (calculated using equations from the lit-erature). Therefore, the size dependent correction factors were averaged over the respective CPC particle size win-dow, considering only particle diameters smaller than 150 nm for the same reason as given above. Correction factors for CPC counting efficiencies, for coincidence in the CPC op-tics, and for pressure-dependent CPC flow rates were taken from Hermann and Wiedensohler (2001). These volume flow rates, which are determined by critical orifices in the CPCs, range from 1.1 to 1.6 liter/min (volume) and have been cal-ibrated in the laboratory for operating pressures between 60 and 1000 hPa.
Results of the CARIBIC CPC measurements onboard the old CARIBIC system (Boeing 767, LTU) have already been presented in several publications (e.g. Hermann et al., 2003). Figure 10 shows a first example of the new mea-surements. Particle concentrations were combined with the video recordings (Sect. 4.14) to reveal the exact location of a high particle concentration event. The mechanism leading to the high number concentration of ultrafine particles ob-served just below the cloud (believed to be a real effect) is not known. Likewise, the question of droplet break-up and other artifacts, caused by the inlet while measuring in clouds (Murphy et al., 2004), which can be addressed by using the video camera, is still under investigation.
4.6 Aerosol particles – optical particle counter
The third aerosol rack unit (19′′, 7 HU, 26 kg) houses an Optical Particle Counter (OPC, PCASP-X, Passive Cavity Aerosol Spectrometer Probe, PMS, Boulder, CO, USA). OPCs operate on the principle that the light scattered by in-dividual particles within a laser cavity is a direct function of their size, assuming spherically shaped particles. Each particle produces a pulse of radiant energy during its tran-sit through the laser beam, which is detected by two photo diodes. As the OPC is intended to measure the aerosol par-ticle size distribution in the size range of 0.15–10.0 µm (ac-cumulation and coarse particle mode), about six orders of magnitude in signal intensity have to be covered. Hence, in the CARIBIC OPC, two diodes are used with different