HAL Id: hal-02957968
https://hal.archives-ouvertes.fr/hal-02957968
Submitted on 11 Jan 2021
HAL is a multi-disciplinary open access
archive for the deposit and dissemination of
sci-entific research documents, whether they are
pub-lished or not. The documents may come from
teaching and research institutions in France or
abroad, or from public or private research centers.
L’archive ouverte pluridisciplinaire HAL, est
destinée au dépôt et à la diffusion de documents
scientifiques de niveau recherche, publiés ou non,
émanant des établissements d’enseignement et de
recherche français ou étrangers, des laboratoires
publics ou privés.
Oxygen isotope/salinity relationship in the northern
Indian Ocean
Gilles Delaygue, Edouard Bard, Claire Rollion, Jean Jouzel, Michel
Stiévenard, Jean-Claude Duplessy, Gerald Ganssen
To cite this version:
Gilles Delaygue, Edouard Bard, Claire Rollion, Jean Jouzel, Michel Stiévenard, et al.. Oxygen
iso-tope/salinity relationship in the northern Indian Ocean. Journal of Geophysical Research. Oceans,
Wiley-Blackwell, 2001, 106 (C3), pp.4565-4574. �10.1029/1999JC000061�. �hal-02957968�
JOURNAL OF GEOPHYSICAL RESEARCH, VOL. 106, NO. C3, PAGES 4565-4574, MARCH 15, 2001
Oxygen isotope/salinity relationship in the northern Indian Ocean
Gilles
Delaygue,
•'2
Edouard
Bard,
and
Claire
Rollion
Centre Europ6en de Recherche et d'Enseignement des G•osciences de !'Environnement, Aix-en-Provence, France
Jean Jouzel, Michel Sti{Svenard,
and Jean-Claude
Duplessy
Laboratoire des Sciences du C!imat et de i'Environnement, CEA Saclay, Gif-sur-Yvette, France
Gerald Ganssen
Department of Earth Sciences, Free University Amsterdam, Amsterdam, Netherlands
Abstract.
We analyze
the surface
•5•80
- salinity
relationships
of the Bay
of Bengal
and
the Ara-
bian Sea, in the northern Indian Ocean, known for their contrasting hydrological conditions. New
measurements
of these
tracers
show
a very
low •5•80
- salinity
slope
associated
with
the strong
dilution in the Bay of Bengal, but a slope more typical of this latitude in the Arabian Sea. Al- though this region is marked by a complex monsoonal regime, numerical modeling using a box
model
and
a general
circulation
model
is able
to capture
the •5•SO
- salinity
slope
and
its geo-
graphical
variation.
Both
models
clearly
show
that
the low •5•SO
- salinity
slope
is due
to the
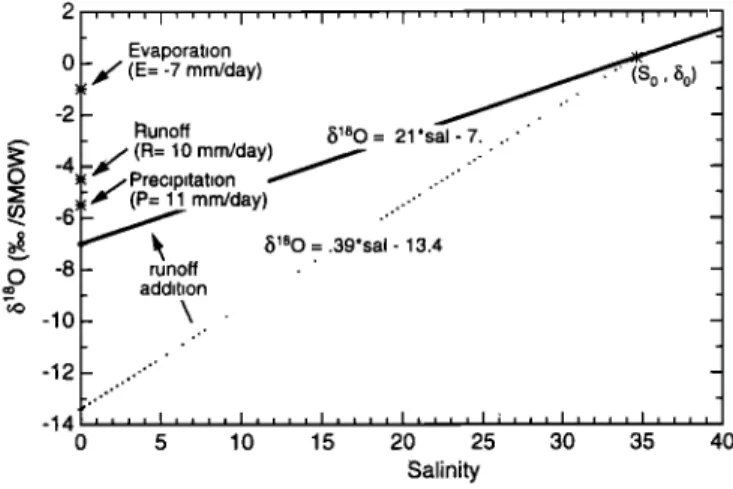
evaporation-minus-precipitation balance, with an important contribution of the continental runoff in the Bay of Bengal. Although the low value of these slopes (-0.25) makes past salinity recon- structions uncertain, insight into the Last Glacial Maximum conditions shows a probable stability of these slopes and limited error on paleosalinity.
1. Introduction
Hydrological studies of the northern Indian Ocean have fo- cused on the flux divergence of vapor in order to refine both the mechanism and the vapor source of the monsoon precipitation over India. Cadet and Reverdin [1981] estimated the Arabian Sea contribution to the monsoonal precipitation to be about 20%, the remainder originating from the Southern Hemisphere. They showed a large increase in the evaporation-minus-precipitation
Among the hydrological characteristics of the oceanic waters
the •SO
content
(the
H2•80/H2•60
ratio
R, hereafter
expressed
as
the deviation/5 with respect to the Vienna standard mean ocean
water
(VSMOW)
value,
in permil:
15•SO
= (R/RsMow-
1)1000)
is
rarely used because of the measurement difficulties. Together
with the salinity and other tracers, it can serve to characterize a
water mass [e.g., Craig and Gordon, 1965; Pierre et al., 1994]
(E-P) balance over the Arabian Sea at the onset of the monsoon, and to disentangle the different contributions to a water mixture
with
no counterpart
in the
Bay
of Bengal.
This
E-P budget
is very [e.g.,
Ostlund
and Hut, 1984].
The •5•80
and
salinity
variations
different
between
the
basins
even
on an annual
basis
[Trenberth
covary
in the
oceanic
surface
because
they
both
arise
from
a bal-
and
Guillemot,
1998].
Continental
runoff
is another
contributor
to ance
among
(1) an enrichment
due
to evaporation,
(2) a depletion
the
oceanic
surface
hydrology
not
accounted
for in these
atmos- due
to precipitation
and
runoff,
and
(3) a mixing
due
to oceanic
pheric
studies.
Because
of the
geography
of the
continental
drain- advection
and
diffusion.
Their
spatial
relationship
is linear,
and
it
age
area,
the monsoonal
precipitation
does
not runoff
into
the is characteristic
of different
basins
and latitudes
[Craig and
Arabian
Sea
but,
instead,
flows
to the Bay
of Bengal.
Hence
the Gordon,
1965].
Craig
and
Gordon
were
able
to reproduce
this
re-
river discharges
into both
basins
are different
by an order
of lationship
with
a simple
box
model
but
only
on the
global
scale,
magnitude.
As a consequence
of these
geographical
differences,
a mainly
because
of the lack
of observations.
With
the increasing
dilution
of the surface
waters
is obvious
in the Bay of Bengal atmospheric
and oceanic
data it is now possible
to test their
where
the typical
salinity
is about
2 less
than
south
of India
(Fig- model
on a more
local
scale
in order
to clarify
the/5•SO
- salinity
ure 1). Still, it is difficult
to separate
the respective
effects
of pre- relationship.
The case
of the tropical
Indian
Ocean
is made
com-
cipitation
and
runoff
to this
dilution.
plex by the strong
role of the evaporation
in the hydrological
budget, unlike in high latitudes, and by the monsoonal perturba- tion.
This
15•So
- salinity
relationship
is also
important
in the
field of
•A!so
at
Laboratoire
des
Sciences
du
C!imat
et
de
!'Environnement,
paleoclimatology.
The
15•80
measurements
from
carbonate
sedi-
Commissariat • l'Energie Atomique de Saclay, Gif-sur-Yvette, France.
2Now
at Department
of Geophysical
Sciences,
University
of Chicago,
Chicago, Illinois.
Copyright 2001 by the American Geophysical Union.
Paper number 1999JC000061. 0148-0227/01 / 1999JC000061 $09.00
ments have been used to estimate sea surface salinity variations,
which are basic for the understanding of past oceanic dynamics
[e.g., Broecker, 1990; Duplessy et al., 1991 ] and past monsoon intensity [Duplessy, 1982; Rostek et al., 1993]. Such a salinity re- construction is based on the slope of the 15•80 - salinity temporal relationship, i.e., the ratio of the past-to-present variations A
(A/5•80/•). Instead,
the observed
spatial
slope
is used,
i.e., the
4566 DELAYGUE ET AL ß OXYGEN ISOTOPE/SALINITY RELATIONSHIP IN INDIAN OCEAN
35 0
o
34.5
o
50'E 60'E 70'E 80'E 90'E 100'E
Longitude
Figure 1. Hydrological contrast between the Arabian Sea (western basin) and the Bay of Bengal (eastern basin) ex- pressed by the annual salinity [Levitus et al., 1994]. Circles correspond to the locations of the water samples used
for •5•80-
salinity
correlation.
fi•lSo/• ratio,
where
fi is the
spatial
variation.
Rohling
and
Bigg
[1998] pointed out the possibility of an important change of this spatial relationship in the past and thus of the inadequacy of this method. Schmidt [ 1999] estimated that half of the uncertainty in
reconstructing past salinity arose from the difference between
spatial and temporal slopes. Using an ocean general circulation model, he also showed [Schmidt, 1998] that temporal and spatial
gradients may not be equal over timescales of season to decades.
By comparing new observations and modeling results we aim
to improve
the understanding
of the •5•So
- salinity
relationship
in
a complex tropical region, the northern Indian Ocean, where it is of importance for paleoreconstruction. Besides the simple model of Craig and Gordon [ 1965], we test the ability of a general cir- culation model implemented with the isotope, which succeeds in
simulating
the •5180
- salinity
relationship
on the global
scale
[Delaygue et al., 2000]. First, we summarize the atmospheric budget of the Arabian Sea and the Bay of Bengal; then we pre-
sent
new
surface
•SlSo
and
salinity
measurements;
and
finally,
we
discuss them with the help of modeling.
2. Atmospheric Forcings of the Northern
Indian Ocean
The atmospheric budget on both oceanic sides of India is quite contrasted. Over the Arabian Sea the annual net divergence flux
(E-P) is strongly
positive
(about
I m yt 1 or 3 mm d'l), as op-
posed
to a negative
divergence
flux (about -0.4 m yr
'l or
-1 mm
d
-1) over the Bay of Bengal
[Trenberth
and Guillemot,
1998]. On the seasonal scale the difference is even more pro-
nounced,
with a divergence
peaking
locally
to 20 mm d 'l over
the
Arabian Sea during summer (June-August, JJA) [Peix6to and
Oort, 1983]. This contrast is mostly due to the monsoonal sum-
mer precipitation, which falls on the Bay of Bengal but not on the Arabian Sea, except along the southwest Indian coast. An indica-
tive limit of about
0.7 m yr 'l (2 mm d
'l) for the annual
precipita-
tion can be used to separate both basins [Trenberth and
Guillemot, 1998]. During the summer monsoonal period (JJA) an enormous quantity of moisture is transported over the Arabian Sea
to the Indian
continent
(0.4 Sv, I Sv -- 10
6 m
3 s
'l) [Hastenrath
and Greischar, 1993], part of which flows to the Bay of Bengal.
On the other hand, the evaporation is less different between the
basins: it increases similarly during the summer because of oce- anic heat release and during the winter because of continental winds due to the reversed continent-ocean temperature gradient
(the "dry"
monsoon).
An annual
evaporation
flux of 1.3 m yr '•
(3.5 mm
d
'l) has
been
estimated
for the
northern
Indian
Ocean
by
Hastenrath and Greischar [1993].
The continental runoff strongly contributes to the hydrology contrast in the northern Indian Ocean. The main rivers flowing into the Bay of Bengal, the Ganges, Brahmaputra, and Irrawaddy, originate in the area receiving the monsoonal precipitation and to-
tal 1500
km
3 yr
'l (0.05
Sv) [Perry
et al., 1996].
Spread
over
the
whole
Bay of Bengal
(about
2x 10⁶
km2),
this flux represents
about
2 mm
d
'l, the
same
magnitude
as
precipitation.
The
respec-
tive dilution effects of the runoff and precipitation fluxes thus de- pend on their mixing through the Bay of Bengal. In contrast, the main discharge into the Arabian Sea, the Indus, flows north of the
Himalayan
barrier
and
brings
only
about
190
km
3 yr 'l (0.006
Sv).
These geographical characteristics strongly contribute to dif- ferentiate the surface waters in both basins (Figure 1), with low salinities in the Bay of Bengal (typically lower than 34) and high salinities in the Arabian Sea (typically higher than 36). A meridi- onal gradient also exists throughout the year, opposite in both ba- sins: the southern part is less saline than the northern one in the Arabian Sea and, conversely, in the Bay of Bengal [Levitus et al., 1994]. These reversed meridional gradients are maintained by the opposite forcing over each basin (the evaporation surplus over the Arabian Sea and the dilution by runoff and precipitation ex- cess over the Bay of Bengal) and the oceanic exchanges between the basins.
The seasonal variability of salinity is also different in the ba- sins. In the Arabian Sea the strongest variation of about 2 takes
DELAYGUE ET AL,: OXYGEN ISOTOPE/SALINITY RELATIONSHIP IN INDIAN OCEAN 4567
place in the southern part (9øN) and along the Indian coast
(strongly diluted by the summer precipitation), but it is less than 0.5 north of 15øN. In the Bay of Bengal a variation of 10 happens in the northern part (18øN), reduced to 1 at 12øN. These contrasts
between
the basins
also
hold for the •ilSo and its relationship
with salinity.
3. The 6•s0
Measurements
and Relation
to Salinity
A new set of 78 water measurements from the Bay of Bengal, obtained from samples collected during the 1993-1994 campaign
of the German
R/V Sonne
("SO93"),
is presented.
here.
The col-
lection occured during January-February 1994, i.e., during the winter monsoon with low precipitation and runoff. Sample loca- tions are shown in Figure 1. These surface water samples were
taken underway, between the hydrological stations, and sealed in
glass
bottles.
The •180 was
measured
at the Laboratoire
des
Sci-
ences du Climat et de l'Environnement (LSCE) with a Finnigan MAT 252, by CO•_ equilibration. At least two measurements were performed for each sample. The overall (analytical and repro-
ments published by Ostlund et al. [1987] and Duplessy et al. [1981]. The Netherland Indian Ocean Program (NIOP) was de-
voted to the study of the monsoon effects on the marine ecosys- tem, especially in the Gulf of Aden and along the coast of Soma- lia. The different campaigns happened during the winter and
summer monsoons (Table 1). Surface water was sampled at the
hydrological
stations.
Salinity
and /5180
were measured
at the
Free University,
Amsterdam.
The fi•80 was measured
by CO2
equilibration with a Finningan MAT 251 mass spectrometer. The
precisions
on salinity
and
fi•80 measurements
are 0.1 and
0.1Yoo,
respectively.
In the Bay of Bengal,
salinity
and fi•80 display
a northward
decrease. From the equator to about 15øN, most points range be-
tween
35 and 33 for salinity
and 0 and 0.596o
for fi•80. North-
ward,
salinity
and fi•80 decrease
down
to 23 and -2%o,
respoc-
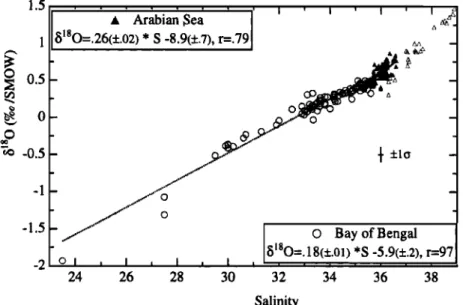
tively. Still, an approximate linear relationship is observed with a
correlation
coefficient
of r = 0.97, namely,
fi180
= 0.18S-5.9
(Figure 2). All linear regressions discussed in this paper are tabu- lated in Table 2 with the standard deviations associated to each regression parameter. Sampling was done during January and
ducibility)
standard
error
on •5180
is about
0.0596o.
Because
of a February,
i.e., during
the winter
monsoon
with low precipitation
technical problem with the embarked salinograph, salinity was
not measured onboard, but instead, it was determined at the labo-
ratory (Centre Oc6anologique de Marseille, France) by conduc-
timetry
using
the same
water
samples
as for the •5•80
measure-
ments (and after these measurements). Because of the limited wa- ter volume left, salinity measurements were performed in tripl i-
cate only for 8 samples, in duplicate for 35 samples, and once for
6 samples. No measurements were possible for the 29 other sam- ples. Their salinity was, instead, interpolated between the two
closest hydrological stations of the campaign for which precise
measurements exist [Quadfasel et al., 1994]. To estimate the ac- curacy of this interpolation procedure, we compare the measured and interpolated salinities for the other samples of the southern area. The standard deviation of these differences is 0.3, for the
whole Bay of Bengal. Actually, these 29 samples all originate from the southern part of the Bay of Bengal, where the spatial
gradient of salinity is weak compared to the northern part. This prevents the formation of a strong bias due to this interpolation. We thus use the interpolated salinities to one decimal point.
For the Arabian Sea, new measurements from the Netherland
Institute for Sea Research (NIOZ) program (Dutch R/V Tyro campaigns 1992-1993) are combined with a set of 16 measure-
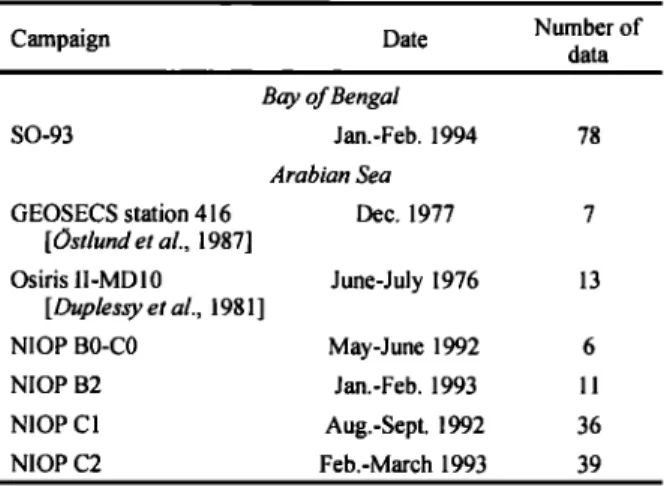
Table
1. The
Different
Sets
of Subsurface
•5180
and
Salinity
Measurements Used in This Study
Campaign
Date
Number
dataof
SO-93 GEOSECS station 416 [Ostlund et al., 1987] Osiris II-MD 10 [Duplessy et al., 1981 ] NIOP B0-C0 NIOP B2 NIOP C1 NIOP C2 Bay of Bengal Jan.-Feb. 1994 78 Arabian Sea Dec. 1977 7 June-July 1976 13 May-June 1992 6 Jan.-Feb. 1993 11 Aug.-Sept. 1992 36 Feb.-March 1993 39 and runoff.
In the Arabian Sea, typical enriched values are found with sa-
linity
up to 36.6 and
•80 up to 0.996o.
Both
salinity
and •80 dis-
play a very limited range of values, about 1.5 for salinity and 0.596o for •80. We do not use here all of the available data for
two reasons: (1) during the summer monsoon the strong upwell-
ing occuring along the Sorealia coast brings deep waters to the
surface, with specific characteristics, and for this reason the So-
malian part of the NIOP expeditions (Table 1) are not used; (2) some bias may occur between different sets of measurements.
With this perspective the NIOP set, measured in the same labora-
tory, is fully consistent. An earlier set of nine samples from the
Osiris IV-MD19 campaign (July-August 1979), measured at
LSCE, shows a similar slope but with a systematic shift and has not been used. Though a weaker correlation (r = 0.80), which
may
be partly
explained
by their
limited
range,
5180
and
salinity
display
a linear
relationship:
•5•aO
= 0.27S-
9.2. We note
that
spanning mainly the Gulf of Aden, these data represent a very limited, also very specific area, compared to the whole Arabian
Sea.
Still,
these
waters
interest
us in two ways.
Their/5•80
- salin-
ity relationship may not be so different from the rest of the Ara- bian basin, given their latitude. In this case the rest of the Arabian
Sea would have the same linear relationship. Alternatively, these waters may contribute to the Arabian Sea surface by mixing. In
this case they would constitute an end-member in the •80 - sa-
linity diagram, but the actual relationship for the whole Arabian
Sea may have a different slope.
The
seasonal
variability
of •80 and
its relationship
with
salin-
ity are difficult to address with the available data. For the Gulf of
Aden the different NIOP campaigns have been conducted in the same area under extreme seasons (Table 1). Thus the derived re-
lationship already accounts for the seasonal variability. The weak
•5180
- salinity
slope
(0.27) implies
a limited
variation
of •5•80
over the year since the salinity variation is <0.5 [Levitus et al.,
1994].
For the Somali
Basin,
•5•80
varies
roughly
between
0.4
and 0.696o and does not show any clear correlation with salinity. This could be related, during the summer monsoon, to the upwell- ing of deep waters. The composition of the deep waters is very homogeneous and thus displays a weak correlation between •80 and salinity. Alternatively, this correlation may be due to the at- mospheric forcing since such a weak correlation is characteristic
4568 DELAYGUE ET AL.' OXYGEN ISOTOPE/SALINITY RELATIONSHIP IN INDIAN OCEAN 1 -0.5 -1 -1.5 Arabian Sea
•5180=.26(ñ.02)
* S -8.9(+.7),
r=.79
-2 o I • I • i • I • 24 26 28 30....
0 Bay
of Bengal
õ•80=.
18(ñ.01)
*s -5.9(+.2),
r=97
, : ! ; ! i ' I ' I I I I 32 34 36 38 SalinityFigure
2. Surface
8•aO
- salinity
relationships
for
the
northern
Indian
Ocean
based
on
the
data
sets
of Table
1. The
Arabian
Sea
(solid
triangles)
is mainly
represented
by
the
Gulf
of Aden
and
displays
a strong
salinity
and/5•80
en-
richment
partly
due
to mixing
with
the
Red
Sea
(open
triangles)
[Ganssen
and
Kroon,
1991].
The
Bay
of Bengal
(open
circles)
is characterized
by
a strong
dilution.
The
linear
regressions
(Table
2) of these
relationships
are
also
shown,
with
obvious
differences
in the
slope
and
correlation.
Error
bars
represent
the
maximum
+o uncertainties
on
the
measurements.
Locations
of the
samples
are
shown
on Figure
1.
of the
tropical
surface
waters
[ Craig
and
Gordon,
1965].
For
the
Bay of Bengal, sample collection was restricted to 2 months.
Thus
it is not possible
to discuss
the seasonal
variability
of the
/5•80
- salinity
relationship,
especially
considering
•he
pro-
nounced
salinity
variation.
For
both
regions,
modeling
an annual
relationship
close
to the observed
one
(next
paragraph)
gives
some
confidence
in its seasonal
stability
despite
the/5•80
and
sa-
linity variations.
4. Modeling
the
•5•So-
Salinity
Relationship
These
measurements
of/5•So
and
salinity
show
that
besides
their
contrasting
distributions,
they
also
display
contrasting
rela-
tionships
between
the
northern
Indian
basins.
If the
stronger
pre-
cipitation(+runoff)-to-evaporation
ratio in the Bay of Bengal
readily
explains
its dilution
compared
to the Arabian
Sea,
two
components still remain unclear. First, the respective roles of the
precipitation and runoff to this dilution are not well known. Sec-
ond, from subtropics to high latitudes a similar increase of the
precipitation-to-evaporation
ratio
increases
this
slope,
contrary
to
what is observed
here
between
the two basins.
Modeling
this
slope can help to separate the different effects and determine their
variations
in the
past.
We use
both
a multibox
model
and
a gen-
eral
circulation
model
to test
the
effect
of the
atmospheric
forcing
on
the/5•So
and
salinity
distribution
and
relationship.
This
at-
mospheric
forcing
comprises
water
(E, P, and
R for the runoff)
and
isotopic
fluxes
(ES, PlJp
and
R•Sr,
where
•, /5p
and/Jr
are
the isotopic
contents
of the evaporation,
precipitation,
and
run-
off). Our
modeling
is original
in that
these
fluxes
are
consistently
derived from an atmospheric model and the simulation has
reached
a pseudo-equilibrium.
More
details
concerning
this
mod-
eling
are given
by Delaygue
et al. [2000].
These fluxes are derived from the NASA/Goddard Institute for
isotopes of the water and calculates isotopic fluxes between the
ocean
and
atmosphere
for each
grid point
[Jouzel
et al., 1987].
The simulated
isotopic
content
of precipitation
compares
rea-
sonably
well with observations
on the global
scale.
For the
evaporation
the
lack
of isotopic
measurements
prevents
any
com-
parison.
Over
the
Indian
Ocean
the
simulated
isotopic
content/5p
can
be
compared
with
the
Global
Network
for
lsot9pes
in Precipi-
tation
(GNIP)
measurements,
an International
Atomic
Energy
Agency
(IAEA)/World
Meteorological
Organization
program
(The GNIP Database,
IAEA/WMO,
Vienna,
Austria,
1998,
available
at http://www.iaea.
org/programs/ri/gnip/gnipmain.htm).
Though mainly restricted to the continents, these data have been
"objectively"
interpolated
on the
global
scale
by R. Mathieu
et al.
(Isotopes
in precipitation:
A global
view,
manuscript
in prepara-
tion,
2000).
Precipitation
over
the
Bay
of Bengal
shows
an annual
fi•SO
value
around
-4.596o,
with
a small
seasonal
range
(+ 196o)
and
is slightly
enriched
over
the
Arabian
Sea
(-3.596o
annually,
+
196o).
The
GISS
model
predicts
precipitation
as slightly
too
de-
pleted
over
the Bay of Bengal
(between
-4.5 and-5.596o),
and
slightly
too enriched
over
the Arabian
Sea (between
-2.5 and
-3.596o).
River
runoff
is estimated
by combining
the
GISS
GCM
pre-
cipitation
to the
drainage
scheme
of Miller
et al. [ 1994].
We
only
calculate
an annual
average,
equally
dispatched
over the 12
months,
that
totals
2300
km
3 yr
-I in the
Bay
of Bengal
and
290
km
3 yr
'l in the
Arabian
Sea.
This
is 50%
more
than
the
estima-
tions
of Perry
et al. [1996],
but
they
may
underestimate
the ac-
tual flux in the Bay of Bengal
(R. Murtugudde,
NASA Goddard
Space
Flight
Center,
Greenbelt,
Maryland,
personal
communica-
tion,
2000).
Few
measurements
of the
runoff
isotopic
composi-
tion
are
available.
In the
Bay
of Bengal
the
Ganges-Brahmaputra
complex shows a seasonal variation between -6960 in winter and
-109(n
after
the
monsoon
season,
with
an
annual
weighted
average
Space
Studies
(GISS)
atmospheric
general
circulation
model
around-9+196o
[Ramesh
and
Sarin,
1992;
C.
France-Lanord,
Cm-
(GCM)
[Hansen
et
al.,
1983].
This
model
features
representa-
ß
tre
de
Recherches
P6trologiques
et
G6ochimiques,
France,
per-
DELAYGUE ET AL.: OXYGEN ISOTOPE/SALINITY RELATIONSHIP IN INDIAN OCEAN 4569
Table
2. Linear
Regressions
of the
8•SO
- Salinity
Spatial
Relationships
From
Measurements
and
Simulations Detailed in This Study a
Number Slope
of Data(ño)
Intercept
(ño)
Coefficient rCorrelation
Bay of Bengal
Measurements (SO93 campaign) 78 0.18 (+0.01) -5.9 (+0.2) 0.97
OPA model 96 0.22 (ñ0.01) -7.3 (ñ0.2) 0.97
OPA model (north of 8øN) 96 0.19 (+0.01) -6.4 (ñ0.3) 0.97
OPA model without runoff 96 0.40 (ñ0.004) -13.6 (ñ0.2) 0.99
Box model (open ocean points) 87 0.36 (ñ0.01) -12.4 (+0.4) 0.96
(points with runoff) 9 0.14 (ñ0.01) -4.7 (ñ0.2) 0.99
Box model without runoff 96 0.35 (ñ0.01) -12.0 (+0.4) 0.95 Box model without runoff for LGM 96 0.33 (+0.01) -10.4 (+0.5) 0.94
Arabian Sea
Measurements l l2 0.26 (ñ0.02) -8.9 (ñ0.6) 0.79
OPA model 163 0.27 (ñ0.01) -8.9 (ñ0.4) 0.88
OPA model without runoff 163 0.29 (ñ0.01) -9.8 (ñ0.3) 0.93
Box model 163 0.19 (ñ0.01) -6.2 (ñ0.2) 0.94
Box model without runoff 163 0.21 (ñ0.0 l) -6.8 (ñ0.2) 0.93 Box model without runoff for LGM 163 0.27 (ñ0.01) -8.2 (ñ0.3) 0.95
a The
model
grid
points
cover
the
northern
part
of the
Indian
OCean
fro
TM
the
equator,
except
where'specified.
monsoon is due to the contribution of the Himalayan part of the drainage area, which receives depleted water moisture, as well as
to the so-called "amount effect", i.e., a correlation between the
precipitation amount and the isotopic depletion [Dansgaard, 1964]. In the Arabian Sea the only reported runoff composition is cited by Rohling and Bigg [1998], showing depleted values be- tween -11.596o and -996o. The isotopic runoff composition derived from the GISS fluxes is largely too enriched, about -4.596o in both basins.
Although these isotopic contents are different from the ob- served ones, they are consistent with the water fluxes simulated by the GISS GCM. Thus we can expect the net water and isotopic fluxes (equations (l) and (2)) to be closer than each individual
value to the real ones. These net fluxes that represent the atmos-
pheric forcing are applied to two different oceanic models.
4.1. Multibox Model
Craig
and Gordon
[1965]
interpreted
the •aO - salinity
rela-
tionship at the ocean surface with a one-box model. The atmos-
pheric budget in this surface box is balanced by a vertical advec- tive/diffusive flux from a deep, homogeneous reservoir. The oce- anic parameters of this model consist in the vertical advec-
tive/diffusive
flux and the •80 and salinity
compositions
of the
deep reservoir. duillet-Leclerc et al. [1997] inferred these oceanic
parameters
by correlating
the •5•aO
and
salinity
surface
composi-
tions from the Geochemical Ocean Sections Study (GEOSECS)
[Ostlund eta!., 1987] with the GISS GCM atmospheric fluxes. Following Juillet-Leclerc et al., we use a two-dimensional array of surface boxes spanning the northern Indian Ocean and force them with the GISS GCM fluxes. Water and salt budgets for each surface box allow estimation of the stationary salinity as
3,=3,0, L9
(1)
?+ A'-œ+ L9 '
where So is the salinity of the oceanic deep reservoir (34.6960) and
Leclerc
et al. [1997]
(Q = 4.85x10
-4 mm s'•). This flux can be
considered as a fit parameter, allowing realistic values of salinity to be modeled. Accounting for a mixed layer depth of 100 m, this value leads to a vertical diffusion coefficient of 5x 10 '5 m 2 s '•, which is consistent with the usual oceanographic value. The/5•80
is estimated consistently as
bib
0 = P•p+ Rbr-Ebe+
L9bo
?+ R-E+
L9 '
(2)
where bo is the isotopic composition of the deep oceanic reservoir as derived by duillet-Leclerc et at [1997] (50 = 0.296o). Equation (2) is more accurate than the simplified one used by duillet-
Leclerc et al. [1997], because in some cases the term P+R-E can be comparable to Q because of strong runoff.
For each surface box of the Indian Ocean array we apply
monthly
atmospheric
fluxes
to estimate
the •5'•O and salinity
(equations (1) and (2)) of an ideal ocean surface in equilibrium with these fluxes. For some coastal boxes we prescribe a conti-
nental runoff R. For these boxes we also compute the surface composition without this runoff (R = 0). For these boxes, and
only for them,
we thus
estimate
two different
•*•O and salinity
compositions, with and without runoff. The other boxes are not
affected by this runoff in any way since the box model has no lat-
eral
mixing.
These
estimated
•5'•O
and
salinity
compositions,
an-
nually averaged, are plotted in Figures 3a and 3b.
For the Arabian
Sea
the •5'•O
- salinity
relatibnship
without
runoff (Figure 3a) is close to the observed one to within 20%
(slope and intercept). Adding a runoff flux in some points (Figure 3b) has very little effect. On the contrary, for the Bay of Bengal the predicted slope (0.35) is significantly higher than the ob-
served one (0.18) without runoff, and the salinity minimum is not low enough (Figure 3a). However, the compositions of boxes
with runoff do show a marked dilution, even stronger than in the observations, and a lower slope close to the observed one (Figure
3b and Table 2). The box model thus allows characterization of
specifically the effect of the runoff since there is no exchange be-
4570 DELAYGUE ET AL.' OXYGEN ISOTOPE/SALINITY RELATIONSHIP IN INDIAN OCEAN 1.0 1
ß
O
.
. . •ii•
• ...
.•
-.5 -5 2 -• .5 -1 .o -1.5 32 33 34 35 36 37c. OPA
SIMULATION
WITHOUT RUN 27 28 29 30 31 32 33 34 35 36 37 Salinity 1.0 0.5 0.0 - -0•5 - -1.0 -1.5 12 15 18 21 24 27 30 33 36 d. OPA SIMULATION ,,,•:•:.•.•:• ...WITH
RUNOFF
:.-'
• ...
...
••
! O Bay
of
Bengal(
.... )!
. .•-• o ! A Arabian Sea (---) I / o • , .! ... obse•ations I 27 28 29 30 31 32 33 • 35 36 37 Salini•Figure
3. The •5•s0
and
salinity
values
simulated
for the northern
Indian
Ocean
surface
by two different
models
forced with the same atmospheric fluxes (i.e., precipitation, continental runoff, and evaporation). (a)-(b) Craig and Gordon's [ 1965] box model does not include any horizontal advection, which is treated by the (c)-(d) oceanic GCM
OPA.
Modeling
allows
isolation
of the effect
of the runoff
by including
it (Figures
3b and
3d) or not (Figures
3a and
3c). Linear regressions (Table 2) are also shown and compared with the observed ones. Despite the different scales used for Figure 3b, because of the strong dilution, the y/x ratio is the same as for the other graphs.
This model allows us to address the seasonal variability of the region. A fine vertical resolution (10 levels in the first 100 m)
•5]•O
- salinity
relationship
without
considering
the
effect
of the and
a parameterization
of the
vertical
diffusivity
by turbulent
ki-
runoff.
This
relationship
is found
to be poorly
defined
(weak
cor- netic
energy
scheme
allow
for a precise
description
of the
atmos-
relation)
during
the summer
months.
We average
the slopes
and phere-sea
exchange.
intercepts
of the •5]•O
- salinity
relationship
of the months
with a
Since
the OPA model
salinity
is calculated
with an atmos-
correlation coefficient r higher than 0.8. For the Bay of Bengal pheric forcing different from the GISS fluxes, this salinity is not
the
mean
slope
is then
0.33
(over
these
months
the
standard
de- fully
consistent
with
the
•5•O,
and
this
could
bias
their
relation-
viation is +.06) and the mean intercept is -11.3(+2.0), and for the ship. Thus we simulate an additional passive tracer whose surface Arabian Sea, they are 0.26(+.05) and -8.7(+1.9), respectively.
Therefore,
except
for few months
when
the correlation
is barely
significant,
the
same
annual
•5•O
- salinity
relationship
seems
to
hold throughout the year.
Thus
this
box
model
reproduces
the low •5•O
- salinity
slope
characteristic of the tropical zone. In the Bay of Bengal it also predicts a strong impact of the runoff on this slope, in contrast to the Arabian Sea. However, since there is no exchange between
boxes, the dilution effect of the runoff is restricted to some
coastal boxes. In order to extend this dilution effect to the whole basin we now apply the same atmospheric fluxes to a GCM, which provides a more realistic oceanic circulation.
4.2. General Circulation Model
We account for the oceanic circulation by implementing the
]SO/•60 ratio in an oceanic GCM. Briefly, we prescribe the GISS
variations are forced by the E-P budget of the GISS fluxes. This tracer is thus comparable to salinity from its hydrological origin,
but it has no feedback on the oceanic circulation. The important
point
here
is that
it is consistent
with
the •aO
tracer
because
(1)
their variations are forced by the same GISS atmospheric fluxes and (2) they are mixed by the same model circulation. Thus, even
if the absolute values of •i]aO and salinity are not perfectly repro-
duced, we expect from this consistency a better simulation of their relationship. We thus use this hydrological tracer, called "sa-
linity" in the following for the sake of simplicity, for correlating with the •i•aO. The simulation starts with an ocean homogeneous
for both tracers and lasts 2200 years. As with the box model, we
test the dilution effect of the runoff on the •i•aO - salinity relation- ship. With this aim we selectively prevent any continental dis- charge in the northern Indian Ocean and proceed with the simula- tion during 60 years.
GCM
isotopic
fluxes
to a tracer
version
of the
Laboratoire
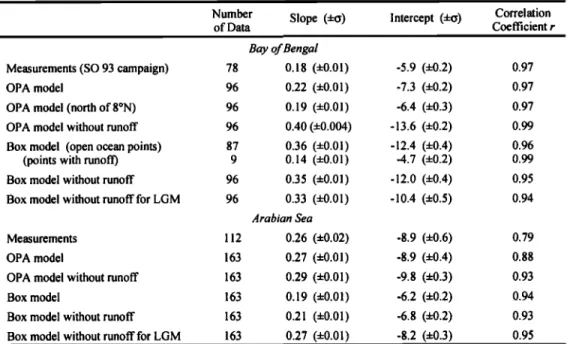
d'Oc6- Figure
4 presents
the
spatial
distribution
of the
simulated
an-
anographie
Dynamique
et de
Climatologie,
Paris,
Oc6an
Parall6-
nual
•5•O,
as
well
as
the
anomaly
due
to the
runoff.
The
simu-
lis6
(OPA)
oceanic
GCM
[Madec
et al., 1998].
The
water
•O/•60 lated
salinity
distribution
displays
the same
pattern.
Since
the
ratio
is then
advected
by the model
as a passive
tracer.
The spa- sparse
measurements
do not allow
a similar
reconstruction,
we
tial resolution
is about
4øx
lø (longitude
x latitude)
in this
Indian can
compare
this
simulated
distribution
with
the
reconstruction
of
DELAYGUE ET AL.' OXYGEN ISOTOPE/SALINITY RELATIONSHIP IN INDIAN OCEAN 4571 20 ø , 10 ø, 0 o . .10 o 50øE 30 ø 60'OE' ' , 70OE ,.' ? 8(•øE 9(•øE 20 ø • 10 ø ._ 0 o
50OE .... 60'OE .... 70'OE .... 80'OE .... 90'OE 100øE Longitude
Figure
4, Distribution
of annual
surface
(5]so
simulated
in the
northern Indian Ocean with the OPA oceanic GCM aœtcr 2200 years: (top) simulation with runoff and (bottom) difference be-
tween simulations without and with runoff. The spatial resolution
of this model in this region is about 4øxl ø (longitude x latitude).
The 8]sO values arc expressed
in perrail with respect
to
VSMOW.
and salinity are higher than in the real ocean, that is, the dilution
is less
marked,
by 0.8%o
and 5 respectively.
The 15180
- salinity
slope (0.40) is significantly higher than the observed one (0.18).
In the Arabian
Sea
the observed
range
of 15180
and
salinity
is well
simulated as is the slope of their relationship (0.29 compared to 0.27 in the observations).
Adding runoff in the basins does not significantly change the Arabian Sea characteristics, neither for the spatial distribution nor for the relationship with a slope of 0.27 (Figure 3d). However, it
greatly
dilutes
the Bay of Bengal,
with 15•80
and
salinity
values
as
low as -296o
and
22, and
lowers
the 15•80
- salinity
slope
to 0.22, a
value closer to that observed (0.18). These slopes are not distinct within 2o (Table 2). The simulated intercept is significantly dif-
ferent from the observed one (-7.396o and-5.9%o, respectively,
with a standard deviation of 0.2). In fact, since both slopes are
not equal,
the 15180
shift
between
the relationships
depends
on the
100øE
salinity
at which
it is calculated,
and its uncertainty
is lowest
close to the mean value of salinity (33.27 for observations and
31.70
for OPA simulation).
For S = 32.5 this 15180
shift
is 0.269o0.
It is large compared to climatic variations, for instance, but lim-
ited when compared to the error on the isotopic forcing (by 0.596o on the precipitation composition and 596o on the runoff composi-
tion; see section 4). When only the area of the Bay of Bengal
northward of 8øN (tip of India) is considered, the simulated rela-
tionship
(15180
= 0.19S- 6.4) is even
closer
to the observed
one.
The difference lies in the boxes that connect the basins and pre-
sent
an 8180
- salinity
relationship
intermediate
to both
basins.
These model results show, quite consistently, that in the Bay of Bengal the runoff, and not only the E-P budget, partly deteF
mines
the 15•80
- salinity
relationship.
In the Arabian
Sea
the E-P
budget is sufficient to reproduce the observations. The oceanic circulation seems important in mixing the runoff, thereby diluting the waters and slightly lowering the slope, but the atmospheric fluxes play the primary role since even a crude representation
with the box model gives some reasonable result. We now try to
separate
the contributions
of these
atmospheric
fluxes
to the 15•80
- salinity relationship, especially the strong impact of the runoff.
We then address the problem of using this relationship for past salinity reconstruction.
$. Discussion
Duplessy
[1982] based
on Holocene
core top carbonate
15180
composition. The simulated gradients correspond well in the Bay
of Bengal (about 196o through the bay) but are too low in the Ara- bian Sea (0.696o observed but 0.496o in our simulation from south to north). Both distributions agree on the location of the highest
15180
values,
found
in the Gulf of Oman
(>0.696o
in the simula-
tion), and of the lowest, along the northeast side of the Bay of Bengal, due to both the runoff (Ganges, Brahmaputra, and Ir-
rawadi)
and
the precipitation.
Without
runoff
the 15•80
increases
everywhere but mainly in the Bay of Bengal, by up to 0.396o. This distribution proves the atmospheric forcing, although derived from a GCM, to be reasonable at first order.
Figures
3c and 3d present
the simulated
relationships
of 15180
and salinity without and with runoff, respectively. Compared to the box model results (Figures 3a and 3b), the scattering of the
points and the range of each variable are reduced. This can be readily explained by the mixing between boxes.
Without runoff the relationships are similar to the ones found
in the box model.
In the Bay of Bengal
the minima
of both
15180
5.1. The •tSo - Salinity
Relationship
As a Mixing
Line
Studies
focusing
on the 15•80
- salinity
relationship
have
been
based on two assumptions: first, that this relationship is generated by mixing oceanic and freshwater end-members and, second, that the freshwater component consists of the balance between evapo- ration, precipitation, and continental runoff. This latter balance has been often simplified to the sole runoff in studies of coastal
and high-latitude regions, where it is actually an important term [e.g., Fairbanks, 1982], and because of the difficulty in address-
ing the evaporation flux. With this simplification, estimation of runoff isotopic content for glacial climate has been proposed in
order
to predict
a past
15180
- salinity
relationship
[Rohling
and
Bigg, 1998; Schiifer-Neth, 1998]. However, as stressed by Craig and Gordon [1965], the assumption considering the runoff as the main term is generally not valid for the open ocean since the run- off is negligible in the global hydrological budget.
The box model is a useful way to convert the atmospheric
![Figure 1. Hydrological contrast between the Arabian Sea (western basin) and the Bay of Bengal (eastern basin) ex- pressed by the annual salinity [Levitus et al., 1994]](https://thumb-eu.123doks.com/thumbv2/123doknet/13033992.382040/3.909.218.668.102.420/figure-hydrological-contrast-arabian-western-bengal-salinity-levitus.webp)

![Figure 4, Distribution of annual surface (5]so simulated in the](https://thumb-eu.123doks.com/thumbv2/123doknet/13033992.382040/8.909.80.447.109.673/figure-distribution-annual-surface-simulated.webp)