HAL Id: hal-01517548
https://hal.archives-ouvertes.fr/hal-01517548
Submitted on 3 May 2017
HAL is a multi-disciplinary open access
archive for the deposit and dissemination of
sci-entific research documents, whether they are
pub-lished or not. The documents may come from
teaching and research institutions in France or
abroad, or from public or private research centers.
L’archive ouverte pluridisciplinaire HAL, est
destinée au dépôt et à la diffusion de documents
scientifiques de niveau recherche, publiés ou non,
émanant des établissements d’enseignement et de
recherche français ou étrangers, des laboratoires
publics ou privés.
Doped with Cu and Y
N Korsunska, M Baran, V Vorona, V Nosenko, L Lavoryk, Xavier Portier,
Larysa Khomenkova
To cite this version:
N Korsunska, M Baran, V Vorona, V Nosenko, L Lavoryk, et al.. Impurity-Governed Modification
of Optical and Structural Properties of ZrO 2 -Based Composites Doped with Cu and Y. Nanoscale
Research Letters, SpringerOpen, 2017, pp.157. �10.1186/s11671-017-1920-4�. �hal-01517548�
N A N O E X P R E S S
Open Access
Impurity-Governed Modification of Optical
and Structural Properties of ZrO
2
-Based
Composites Doped with Cu and Y
N. Korsunska
1, M. Baran
1, I. Vorona
1, V. Nosenko
1, S. Lavoryk
1,2, X. Portier
3and L. Khomenkova
1*Abstract
The influence of calcination temperature on copper spatial localization in Y-stabilized ZrO2powders was studied by
attenuated total reflection, diffuse reflectance, electron paramagnetic resonance, transmission electron microscopy, electron energy loss, and energy-dispersive X-ray spectroscopies. It was found that calcination temperature rise in the range of 500–700 °C caused the increase of copper concentration in the volume of ZrO2nanocrystals. This increase was
due to Cu in-diffusion from surface complexes that contained copper ions linked with either water molecules or OH groups. This copper in-diffusion led also to an enhancement of absorption band peaked at ~270 nm that was ascribed to the formation of additional oxygen vacancies in nanocrystal volume. Further increasing of calcination temperature from 800 up to 1000 °C resulted in outward Cu diffusion accompanied by a decrease of the intensity of the 270-nm absorption band (i.e., oxygen vacancies’ number), the transformation of ZrO2tetragonal (cubic) phase to monoclinic one as well as
the enhancement of absorption band of dispersed and crystalline CuO in the 600–900 nm range.
Keywords: Cu-doped Y-stabilized ZrO2, Electron paramagnetic resonance, Attenuated total reflection, Diffuse reflectance,
Transmission electron microscopy Background
Zirconia nanopowders have attracted considerable atten-tion due to their mechanical, electric, thermal, and optical properties offering diverse applications such as catalysts [1], high temperature and corrosion resistant coatings [2], chemical sensors [3–5], radiation detectors [6], biological labeling [7], switchable mirrors or filters [8], etc. Pure and/ or Y-stabilized ZrO2(YSZ) demonstrate different emission
bands in visible spectral range that make such materials suitable for white light-emitting devices [9–11]. The YSZ ceramics exhibit specific characteristics such as superplasti-city at low temperatures. Besides, the YSZ shows high ionic conductivity at elevated temperatures [12, 13], high chem-ical inertness, thermal stability, and hardness [14] that allowed these materials to be used as electrolytes in solid oxide fuel cells [13, 15] and thermal barriers [16].
In recent years, ZrO2nanocomposites containing other
components, in particular CuO, are intensively developed.
The properties of such composites depend on Cu spatial localization [17–26]. Copper can be present inside the YSZ grains and/or on their surface (in the form of aggre-gates of Cu atoms [17], CuO molecules, or crystalline CuO [19, 23]). Copper on the grains’ surface or in its near-surface region was accepted to be responsible for catalytic activity of the composite, its fungicidal properties [17–21], and tribological behavior [16]. Besides, surface Cu location shows also ability to compact the ceramics [24, 25].
Copper, located inside the grains, affects structural characteristics of the composites. Specifically, depending on the calcination temperature and Cu concentration, the monoclinic ZrO2structure can be transformed into
tetragonal or cubic [27]. In addition, Cu-doping results in appearance of specific photoluminescence (PL) band in the green spectral range [22] that can be interesting for applications in light-emitting devices.
It should be noted that the influence of copper impurity on the structural characteristics of the com-posites, as well as their catalytic properties, was ex-tensively studied for monoclinic ZrO2 powders (see
for example [18, 19, 28]). At the same time, among
* Correspondence:khomen@ukr.net
1V. Lashkaryov Institute of Semiconductor Physics of National Academy of
Sciences of Ukraine, 45 Pr. Nauky, Kyiv 03028, Ukraine
Full list of author information is available at the end of the article
© The Author(s). 2017 Open Access This article is distributed under the terms of the Creative Commons Attribution 4.0 International License (http://creativecommons.org/licenses/by/4.0/), which permits unrestricted use, distribution, and reproduction in any medium, provided you give appropriate credit to the original author(s) and the source, provide a link to the Creative Commons license, and indicate if changes were made.
different ZrO2 phases, tetragonal phase is known to
exhibit better catalytic properties [29, 30].
To form tetragonal ZrO2phase, the doping with yttrium
is often used. However, in comparison with Cu-doped ZrO2, the structural properties of (Cu,Y)-codoped ZrO2
and the spatial distribution of the impurities in it can dif-fer. For example, Cu addition to Y-doped ZrO2lowers the
temperature of tetragonal to monoclinic phase transform-ation [25]. Besides, it was proposed that in such compos-ite, the formation of Y cuprate on the crystallite surface occurred at elevated temperatures [25].
It should be noted also that most studies were per-formed on Cu–ZrO2 powders doped by impregnation
technique that led to predominant localization of cop-per on the surface of nanocrystals or in their near-surface region. At the same time, coprecipitation technique can allow the Cu presence both in the crystallite volume and at their surface simultaneously. Therefore, the investigation of the effect of technological conditions on Cu spatial localization in ZrO2-based composites fabricated by coprecipitation
technique keeps interest in terms of the development of the materials with required properties.
In the present paper, (Cu,Y) codoped ZrO2
nanopow-ders prepared by coprecipitation method and calcinated at different temperatures were studied by infrared atten-uated total reflection, diffuse reflectance, electron para-magnetic resonance, transmission electron microscopy, electron energy loss, and energy-dispersive X-ray spec-troscopy (imaging modes) techniques to obtain informa-tion about the dependence of copper spatial localizainforma-tion on the calcination temperature.
Methods
Sample Preparation
The Y-stabilized ZrO2 nanopowders codoped with Cu
were synthesized by a coprecipitation technique using Zr, Y, and Cu nitrates in molar ratio ZrO(NO3)2:Y(NO3)3
:-Cu(NO3)2= 96:3:1 and 89:3:8 in distilled water. With such
a composition, the CuO concentration of 1 mol% (Cu-1 samples) or 8 mol% (Cu-8 samples) was obtained, whereas the Y2O3content was about 3 mol% for both sets.
The 6 wt% ammonia solution was used for a chemical precipitation. The latter was carried out at pH = 10–11 followed by precipitate washing to pH = 7. After washing with distilled water and filtering, the microwave irradiation (700W, 2.45GHz) was used to dry the precipitates. It is worth to note that this method allowed obtaining the powders with uni-form distributions of dopants.
Xerogel nanopowders were calcinated at Tc= 500–1000 o
C for 2 h and slowly cooled with the furnace to room temperature.
Material Characterization
Infrared attenuated total reflection (ATR) spectra were acquired at room temperature using IRAffinity-1 Fourier transform spectrometer equipped with a DTGS (deuter-ated triglycine sulfate) detector. The Golden Gate single reflection diamond ATR top-plate MKII accessory equipped with ZnSe lenses was used for ATR measure-ments. The spectra were collected with a mirror speed value of 2.8 mm/s by averaging 32 scans at a resolution of 2 cm−1over the 550–4000 cm−1range. In our experi-ment, the small amount of powder was pressed on dia-mond surface by a sapphire anvil. These effects were corrected by using advanced ATR correction.
Diffuse reflectance spectra were recorded with respect to the BaSO4 standard at room temperature by means of
double-beam spectrophotometer UV-3600 UV-VIS NIR (Shimadzu Company) equipped with an integrated sphere ISR-3100. Obtained spectra were transformed in absorption ones using standard program based on the Kubelka-Munk ratio f rð Þ ¼∞ ð1−r∞Þ
2
2r∞ ¼
K
S, where f(r∞) is the Kubelka-Munk
function, r∞¼ Rsample=RBaSO4 is the relative diffuse
reflec-tion from the sample, K and S are absorpreflec-tion and scattering coefficients of the sample, respectively.
Electron paramagnetic resonance (EPR) measurements were carried out using X-band EPR spectrometer Varian E12 (~9.5 GHz) with a sensitivity limit of about 1012EPR centers. A 100-kHz modulation of the magnetic field with peak-to-peak amplitude modulation of 0.1 mT and micro-wave power of about 2 mW, being much less than the sat-uration power, were used. The signal of a MgO:Mn sample containing 3 × 10¹⁵spins was used as a reference. EPR spectra were normalized with respect to the intensity of the signal of MgO:Mn reference as well as on the mass of each powder studied. All measurements were carried out at room temperature.
For transmission electron microscopy (TEM) observa-tions, powders were mixed to butanol before being spread on a holey carbon copper grid. Conventional TEM obser-vations were performed using a 2010 FEG JEOL micro-scope operated at 200 kV. High-resolution TEM, STEM High Angle Annular Dark Field (HAADF), energy-filtered TEM images as well as EDX chemical maps were recorded with a double-corrected cold FEG ARM200 JEOL micro-scope operated at 200 kV and equipped with a Centurio EDX JEOL setup. This latter microscope is also equipped with a Gatan Imaging Filter (QUANTUM 965 ER) from which energy-filtered (EFTEM) images (chemical maps) were produced.
Results and Discussion
ATR Spectra
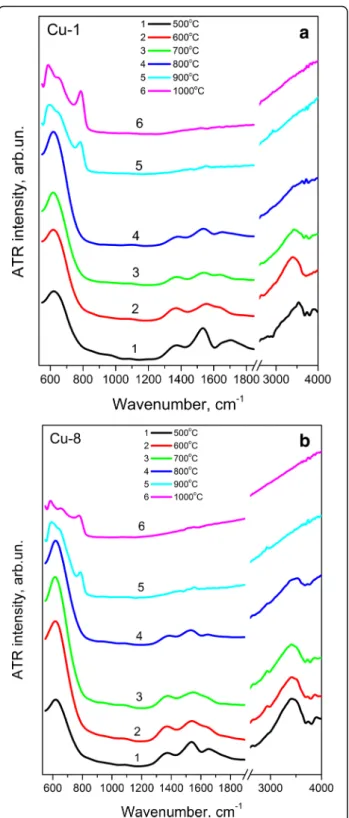
ATR spectra of Cu-1 and Cu-8 samples calcinated at 500– 1000 °C are shown in Fig. 1. These spectra demonstrate
Zr–O vibrations in the range of 500–850 cm−1. The broad
band at ~615–625 cm−1is the major feature in the spectra
of the samples for both groups annealed at Tc≤ 800 °C
(Fig. 1a, b). This band can be attributed to the absorption band of ZrO2lattice with tetragonal and/or cubic phases
[31]. The Tcincrease up to 900 °C leads to the appearance
of other bands centered at ~575 and ~770 cm−1 that are the features of ZrO2monoclinic phase [32]. Its
contribu-tion increases with Tc rise up to 1000 °C. This finding
agrees with XRD results [22, 31]. However, XRD patterns show appearance of monoclinic phase with a contribution being approximately 3% already at Tc= 800 °C [22].
Obvi-ously, such amount of monoclinic phase is insufficient for its detection by ATR technique.
Besides, ATR spectra show also the bands in the 1300– 1400 cm−1, 1500–1580 cm−1, 1580–1680 cm−1, and 3000– 3700 cm−1spectral regions. The band at 3000–3700 cm−1 can be caused by vibrations of OH groups or water mole-cules [33]. Absorption at 1580–1680 cm−1is attributed to
deformation vibrations of adsorbed water. The band at 1500–1580 cm−1is assigned to the deformation vibrations
of OH groups bonded with the metal (δ(MOH)), and the band at 1300–1400 cm−1 is determined by hydroxyl
groups strongly bonded between themselves by hydrogen bonds and structured by hydroxyls of water (γ(OH)) [34].
The intensity of all these bands decreases noticeably with Tc increase and at Tc≥ 900 °C the bands at 3000–
3700 cm−1and 1580–1680 cm−1disappear. Since the in-tensities of these two absorption bands decrease with Tc
synchronously and somewhat faster than the intensities of other two bands (at 1500–1580 cm−1 and 1300–
1400 cm−1), one can assume that not only the band at 1580–1680 cm−1, but also the band at 3000–3700 cm−1
can be attributed to the vibrations of adsorbed water. Note that according to Ref.[35], water contained in the xerogel evaporates at ~200 °C (during drying), while the main amount of OH groups is lost at Tc= 400–500 °C.
However, Fig. 1 shows the presence of OH groups in our samples calcinated at higher temperatures. This fact can be explained by water adsorption on the nanocrystal sur-face upon calcination process.
Diffuse Reflectance Spectra
Figure 2 shows diffuse reflectance (DR) spectra of Cu-1 (Fig. 2a) and Cu-8 (Fig. 2b) samples calcinated at differ-ent temperatures. These DR spectra contain the absorp-tion band (peaked at ~270 nm) near the band edge of ZrO2. Increase of Tcin the 500–700 °C range leads to a
slight increase of its intensity in Cu-8 samples, while it is almost unchanged for Cu-1 samples. For Tc= 800–
1000 °C, the intensity of this band decreases essentially in both groups of samples. Note, that the band at ~270 nm is more intense for Cu-8 samples.
In addition to absorption near ZrO2 band edge, the
band in the range of 600–900 nm is observed in DR spec-tra. Its intensity increases with Tcrise up to 800 °C, being
accompanied by the shift of its peak position to shorter wavelengths. For higher calcination temperatures, the Fig. 1 ATR spectra of Cu-1 (a) and Cu-8 (b) samples calcinated
edge of the fundamental absorption of crystalline CuO ap-pears for Cu-8 samples (Fig. 2b).
The band in the 600–900 nm range is usually attributed to d-d transitions of the Cu2+ions in an octahedral or tet-ragonal distorted octahedral surrounding [36, 37] and as-sociated with dispersed CuO on the surface of the nanocrystals [36] or with CuZr substitutional atoms
lo-cated in the near-surface region [19, 35]. The increase of Cu loading caused the increase of intensity and the short-wavelength shift of this Cu-related band. The latter was at-tributed to an increase of octahedral distortion [35, 36].
Based on the obtained experimental data, we can con-sider the nature of absorption band at ~270 nm. Similar band was observed in the works devoted to study of monoclinic and tetragonal ZrO2 doped with Cu by
im-pregnation. The intensity of this band increased with Cu loading, and it was ascribed to electron transitions from copper to oxygen [23, 35].
However, as can be seen from Fig. 2a (inset), the same absorption band is present in the ZrO2 samples doped
with yttrium only, and its intensity increases with Y con-centration. The common feature of both Y- and Cu-doped ZrO2 is the formation of oxygen vacancies [36],
which are required for charge compensation due to dif-ference in the valences of these impurities and Zr. It al-lows assigning the band at ~270 nm observed in our samples to oxygen vacancies. Indeed, the intensity of this band decreases at Tc≥ 800 °C (Fig. 2) that correlates with
the appearance and increase of the contribution of monoclinic phase (Fig. 1) containing less oxygen vacan-cies than Y- or Cu-stabilized tetragonal phase [36]. It should be noted that in Cu–ZrO2samples doped by
im-pregnation, the Cu atoms can penetrate in the near-surface region of ZrO2nanocrystals [23] and even form
solid solution [19] that also should create oxygen vacan-cies [35]. Therefore, in that case, the oxygen vacanvacan-cies can also contribute to absorption band at ~270 nm.
The contribution of Cu-surface substances is more pronounced for the samples calcinated at higher Tc. One
of the possible candidates can be CuO, whose formation was revealed by diffuse reflectance spectra and detected by XRD method for the similar powders [32].
TEM Observations
TEM study was performed for both types of samples. How-ever hereafter, only the results for Cu-8 samples are pre-sented because they demonstrate more pronounced variations of their optical properties with TC. Figure 3
shows the evolution of the structure of the Cu-8 samples with TC. It is seen that xerogel sample has an amorphous
structure. The TCincrease results in the formation of
nano-crystals, whose mean size increases from ~14 nm (TC=
600 °C) to ~46 nm (TC= 900 °C). For TC= 600 °C, the
nanocrystals were found to be with tetragonal and cubic structures (Fig. 3b), while for TC= 900 °C, the main part of
nanocrystals was of monoclinic phase (Fig. 3c). Besides, large particles consisting of smaller nanocrystals with grain boundaries were found. The presence of tetragonal and cubic grains in Cu-8 samples calcinated at 900 °C were also detected, but their amount was much lower.
Figure 3c demonstrates the appearance of some circle-like regions within many grains. Chemical analyses have been carried out on these regions. STEM HAADF image, presented in Fig. 4a, shows clearly these darker circular re-gions in the ZrO2grains. The darker contrast in this
ob-servation mode corresponds to a lower mean Z value. The EDX profile across one of these regions (Fig. 4b) indicates a depletion of the count rates for all elements. It is worth to note that the Cu signal is higher than that of Zr despite the low content of Cu compared to that of Zr. This is due to the use of a holey carbon copper grid for powder observation which enhances artificially the copper content in the copper quantification. Anyway, these results are in Fig. 2 Diffuse reflectance spectra of Cu-1 (a) and Cu-8 samples (b),
calcinated at Tc= 500–1000 °C, as well as the spectra of Cu-free ZrO2
samples doped with 13% of yttrium (curve 1) and 4% of yttrium (curve 2), Tc= 700 °C (inset in Fig. 2a)
agreement with the presence of empty cavities. One of the reasons of their formation can be the segrega-tion of vacancies upon annealing; however, this issue needs further investigations.
Chemical composition analyses have also been per-formed by EFTEM method to investigate the copper distribution in the samples calcinated at TC= 600 °C
(Fig. 5a, b) and 900 °C (Fig. 5c, d). Figure 5a, c is un-filtered images and Fig. 5b, d is Cu chemical maps obtained from the M energy threshold of copper. Note the different scales for both sets of images due to the significant difference in grain size. Overall, we notice a rather homogeneous distribution of copper in both cases despite the presence of bright spots suggesting some diffusion and segregation of copper in the powder.
More interestingly, for higher TC, the segregations of
Y and Cu at grain boundaries were observed. As one can see from Fig. 6, the STEM EDX analysis of a grain boundary (linescan along the red line in Fig. 6a) for the Cu-8 sample calcinated at 900 °C shows that these grain boundaries are enriched in Y and Cu (Fig. 6b, c).
Thus, TEM study shows that the TCincrease favors the
formation of nanocrystals and their sintering at high TCas
well as the segregations of Y and Cu at grain boundaries. EPR Spectra
EPR spectra of studied samples are shown in Fig. 7. Spec-tra of Cu-1 and Cu-8 samples annealed at the same temperature are similar. Depending on Tc, there are two
types of EPR spectra in our samples. The first type (de-noted below as spectrum I) is observed in the samples cal-cinated at Tc= 500–800 °C. Another EPR spectrum
(denoted below as spectrum II), contained a set of irregu-lar shape lines in wide range of magnetic fields, is detected in the samples calcinated at 800–1000 °C (Fig. 7).
EPR Spectrum I
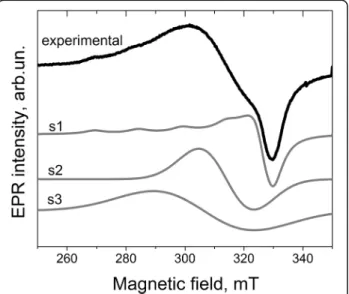
The integral intensity of spectrum I for 1 and Cu-8 samples is nearly the same. Analysis of EPR spectra of different samples shows that spectrum I consists of, at least, three signals, whose intensities depend on Tc. As an example, Fig. 8 presents the decomposition
Fig. 3 High-resolution TEM images for Cu-8 samples. a Xerogel with amorphous grains. b TC= 600 °C with nanoscale grains. c TC= 900°C with
larger grains
Fig. 4 a STEM HAADF image of Cu-8 powder calcinated at 900 °C. The darker regions with circular shapes in the grains correspond to cavities. b EDX profiles across one of these cavities (red line in a) for O, Cu, Y, and Zr elements. A depletion of the number of counts is observed for all the elements
Fig. 5 Unfiltered images (a, c) and copper maps (EFTEM images) (b, d) using the Cu M threshold energy for Cu-8 samples calcinated at Tc= 600 °C (a, b)
and at Tc= 900 °C (c, d)
Fig. 6 a STEM HAADF image of Cu-8 powder calcinated at 900 °C. The dark regions with circular shapes in the grains correspond to the cavities. b, c EDX profiles accross the grain boundary (red line in a) for O, Cu, and Zr (b) and Y (c) elements. A depletion of the number of counts for O, Cu, and Zr and an increase for Y is clearly seen
of EPR spectrum of Cu-8 sample calcinated at 500 °C on the components.
The first component (s1) exhibits the characteristic copper hyperfine splitting and can be described by spin-Hamiltonian parameters g⊥= 2.072, g||= 2.32, A⊥
~ 0 G, and A||~ 150 G. Two others (s2 and s3) are
single structureless lines with g ~ 2.20 and g ~ 2.15, respectively. Because these signals are absent in Cu-free samples, it can be assumed that they are also caused by Cu-related centers. In this case, the ab-sence of Cu-related hyperfine structure can be ex-plained by the exchange interaction between copper ions. With Tc increase, the intensities of all signals of
the spectrum I decrease monotonically (Fig. 9).
The EPR spectra, similar to the spectrum I, were ob-served earlier in ZrO2doped with copper by impregnation
[23, 38, 39]. Observed spectra were considered as a super-position of at least two overlapping components. One of them, with the spin-Hamiltonian parameters g||= 2.38, g⊥
= 2.04, A||= 110 G, and A⊥= 30–35 G, had resolved
hy-perfine structure and was attributed to isolated Cu2+ions in an axially symmetrical surrounding [23, 38]. In Ref. [38], this signal was associated with the copper ions incor-porated into zirconium surface vacancies and capped by oxygen atoms (i.e., with CuO molecules tightly bonded to the nanocrystals). Another signal was a single line with g = 2.23, gradually broadened with increasing of Cu content. This signal was attributed to interacting Cu2+ ions of neighboring CuO molecules [23, 38].
Fig. 7 EPR spectra of Cu-1 (a, b) and Cu-8 (c–e) samples calcinated at 500–1000 °C. The spectra of the samples calcinated at Tc= 500–800 °C are
denoted as“EPR spectrum I” type and others as “EPR spectrum II” type
Fig. 8 Decomposition of experimental spectrum I of Cu-8 sample calcinated at 500 °C on the components
Fig. 9 Variation of the intensities of the components of signal I (right y-axis) and ATR intensities of infrared absorption bands of water molecules and OH groups (left y-axis) on the calcination temperature for the Cu-8 samples
Similar EPR spectra were also observed in other copper-doped oxides (TiO2, ZnO, etc.). They were
at-tributed to copper ions in the Cu-related surface complexes, in which copper ions are in the tetragonal-distorted octahedral fields of ligands [40]. In this case, the parameters of EPR signal (g-factor, hyperfine interaction, and anisotropy) were shown to be dependent on the structure of complex and type of ligands. H2O, O−, SO42−, and (OH)− were
consid-ered as possible components of complexes [39]. Spe-cifically, the signal with spin-Hamiltonian parameters g||= 2.40–2.44 and A||~ 110 G observed in Cu-doped
TiO2 has been attributed to the copper linked with
H2O or O2- while the signal with g||= 2.32 and A||~
154 G has been assigned to Cu2+ ion associated with (OH)−. The latter parameters are close to the parame-ters of the s1 component. Therefore, this signal is more likely related to the surface complex containing OH groups. This statement is supported by the de-crease of its intensity with the dede-crease in the amount of water molecules and OH groups at the surface of the nanocrystals with Tc (Fig. 9). Such
de-pendence is also observed for other components of spectrum I.
Correlation between this EPR spectrum and the pres-ence of surface complexes involving water molecules and/or OH groups is also evidenced by an annealing of the xerogel at 1100 °C followed by quenching. This treatment results in the simultaneous appearance of EPR spectrum I and infrared absorption bands related to OH groups and H2O molecules (Fig. 10). The same
anneal-ing followed by slow coolanneal-ing does not cause either infra-red absorption bands or EPR spectrum I.
Thus, the EPR spectrum I can be attributed to the sur-face complexes containing copper ions linked with water molecules and/or OH groups. It should be noted that Cu-related complexes with different ligands (NH3, OH,
H2O) were observed in Cu–Y–Zr–O hydrogel [41].
Note that the decrease of EPR intensity of spectrum I is accompanied by the increase of the absorption band at 600–900 nm related to surface copper ions (either Cu from CuO molecules or CuZrsubstitutions). Since Tc
in-crease above 800 °C results in the transformation of this absorption band towards that of crystalline CuO, one can ascribed absorption band observed for samples calci-nated at Tc= 500–800 °C to dispersed CuO. In this case,
the anti-correlation between the intensities of EPR spectrum I and the absorption band at 600–900 nm does not allow explaining this EPR signal by CuO molecules or clusters as proposed in [23, 38, 39]. Besides, in spite of the same intensities of EPR signal I in Cu-1 and Cu-8 samples (Fig. 7), the intensity of CuO absorption band is higher for the Cu-8 samples (Fig. 2). This means that dispersed and crystalline CuO are non-paramagnetic.
EPR Spectrum II
As it was mentioned above, this spectrum is observed in the samples calcinated at higher (800–1000 °C) tempera-tures. It is a set of irregular shape lines in wide range of magnetic fields. The narrow EPR lines (and therefore the absence of spHamiltonian parameters distribution) in-dicate that the paramagnetic centers responsible for this spectrum are in regular positions with stable surrounding. Besides, the presence of characteristic hyperfine lines al-lows reasonable assuming that this spectrum or at least its main part is caused by substitutional Cu2+ions (CuZr).
For both types of samples (Cu-1 and Cu-8 samples), sig-nal II shows different behaviors with temperature increase (Fig. 7), but it has similar trend with the contribution of monoclinic phase: its intensity initially increases with monoclinic-to-tetragonal (-cubic) ratio and then decreases (Fig. 11). Since the signal II is observed only when mono-clinic phase appears, it can be assumed to be caused by CuZr2+ions in monoclinic structure. The absence of signal
of CuZr2+ ions in tetragonal structure can be related, for
example, with rapid spin relaxation processes.
Copper Redistribution and Phase Transformation
The above results provide information about the redistri-bution of copper between the volume and the surface of the nanocrystals according to the calcination temperature. As it was noted above, in diffuse reflectance spectra of the samples calcinated at Tc= 500 °C, the absorption band at
~270 nm caused by oxygen vacancies is observed. Its in-tensity is higher in Cu-8 samples than that in Cu-1 ones Fig. 10 EPR spectra of Cu-8 sample calcinated at 1100 °C followed
by slow cooling (curve 1) or by quenching (curve 2). The correspond-ing infrared absorption spectra are shown in the inset
and substantially exceeds the intensity in the Cu-free Y-doped ZrO2powders (Fig. 2).
It is obvious that the presence of yttrium already creates oxygen vacancies in ZrO2. However, the Cu doping
in-creases their number due to the higher difference in the valencies of Cu and Zr ions. Higher intensity of the ab-sorption peak at ~270 nm in Cu-8 samples in comparison with that in Cu-1 ones is caused by higher Cu content in nanocrystal volume of corresponding samples.
The presence of copper in the bulk of nanocrystals was also confirmed by XRD data [22, 31]. The latter showed the shift of XRD peak positions to higher dif-fraction angles in comparison with those of Cu-free Y-doped ZrO2samples. This shift is more pronounced for
Cu-8 samples.
With Tc rise (in the range of 500–700 °C) for Cu-8
samples, the absorption band at ~270 nm intensifies indicating an increase in the number of oxygen va-cancies in the nanocrystals. It testifies to the enrich-ment of nanocrystal volume with copper that is also confirmed by additional shift of XRD peak positions to higher angles [22, 31].
This can be assigned to Cu in-diffusion from the Cu-related surface complexes observed in EPR spectra. Indeed, the Tc increase leads to the decrease of
corre-sponding EPR signal intensity due to destruction of these complexes as a result of water or OH group loss (Fig. 9). Simultaneously, the intensity of CuO-related absorption band (in the range of 600–900 nm) increases. This finding can be explained by the following: part of Cu2+ ions ap-peared due to destruction of surface complexes incorpo-rates additionally into nanocrystals volume, while another one is oxidized forming CuO molecules.
As Tcincreases in the range of 800–1000 °C, the
inten-sity of the band at ~270 nm reduces. This is consistent with the appearance of monoclinic phase and its
increasing contribution (Fig. 1) that is confirmed by ATR spectra (Fig. 1) and XRD data [22, 31]. The appear-ance of the monoclinic ZrO2 phase (Fig. 1) can be
ex-plained by outward diffusion of Cu which stimulates outward diffusion of Y from such grains [32]. The Cu out-diffusion is confirmed by the enhancement and high-energy shift of the absorption band related with CuO molecules as well as by the appearance of the ab-sorption feature of crystalline CuO (Fig. 2). This de-crease of Cu and Y contents in nanocrystals has been observed by EDX method proving consequently their segregation at grain boundaries (Fig. 6). Additional argu-ment for Cu out-diffusion is the shift of XRD peak posi-tions of tetragonal nanocrystals to lower angles [31]. Such phase transformation results in the non-uniform distribution of dopants at a nanometer scale in the pow-ders. Since all the grains were found to contain Cu, one can suppose that the surface of, at least, monoclinic grains are covered by CuO.
The Cu relocation can also explain the non-monotonic dependence of the EPR spectrum II intensity vs. ratio of monoclinic to tetragonal (cubic) phases. In fact, the in-crease of the signal intensity with this ratio can be caused by the increasing number of nanocrystals with monoclinic structure, while the decreasing of EPR signal II intensity can be assigned to copper out-diffusion from nanocrystals volume.
Thus, coprecipitation method allows obtaining composite with copper on the surface and inside of nano-crystals. Variation of calcination temperature can change the copper concentration on the surface and in the vol-ume of nanocrystals, as well as transformation of Cu-related surface entities. Indeed, besides CuO molecules, complexes containing copper ions, water molecules, or OH group are present in the samples calcinated at Tc=
500–800 °C. These complexes are destructed with the Tc
increasing. At higher calcination temperatures, the dis-persed or crystalline CuO dominates.
Conclusions
The influence of calcination temperature on copper localization in ZrO2composites doped with Y and Cu is
studied by ATR, diffuse reflectance, and EPR techniques. The rise of calcination temperature in the range of 500– 700 °C results in the increase of the intensity of the ab-sorption band peaked at ~270 nm. This band is assumed to be caused by oxygen vacancies in the nanocrystals, and its enhancement is explained by an increase of copper concentration in nanocrystal volume. The latter occurs due to Cu incorporation from the surface, in particular, from the surface complexes observed in the EPR spectra. It is shown that these complexes include copper ions and water molecules or OH groups and are destroyed with the temperature growth in the range of 500–700 °C.
Fig. 11 Variation of the intensity of EPR signal II vs. monoclinic-to-tetragonal (-cubic) ratio for Cu-1 (circles) and Cu-8 (triangles) samples
The Tcincrease in the 800–1000 °C range reduces the
copper concentration in the nanocrystals’ volume due to its outward diffusion. This results in the quenching of ~270-nm absorption band, the appearance of the mono-clinic phase, and the increase of light absorption by dis-persed and crystalline CuO appeared in the 600–900 nm spectral range.
Abbreviations
ATR:Attenuated total reflection; DR: Diffused reflectance; EDX: Energy dispersed X-ray spectroscopy; EPR: Electron paramagnetic resonance; TEM: Transmission electron microscopy; XRD: X-ray diffraction
Acknowledgements
This work was partially supported by National Academy of Sciences of Ukraine (project III-41-17). The authors thank also Dr. O. Gorban from O.O. Galkin Donetsk Institute for Physics and Engineering of National Academy of Sciences of Ukraine for the powders’ preparation. XP is grateful for the financial support from the GENESIS EQUIPEX Program (PIA, ANR and Normandie Region).
Authors’ Contributions
NK designed and coordinated the study. NK and LK prepared the draft of the manuscript. MB, VN, and IV carried out EPR study and simulated EPR spectra. SL performed diffuse reflectance and ATR measurements. XP performed TEM and EDX investigation. NK, LK, IV, XP and VN discussed the results and corrected the manuscript till its final version. All authors approved the final manuscript.
Competing Interests
The authors declare that they have no competing interests.
Author details
1V. Lashkaryov Institute of Semiconductor Physics of National Academy of
Sciences of Ukraine, 45 Pr. Nauky, Kyiv 03028, Ukraine.2NanoMedTech LLC,
68 Antonovycha Str, Kyiv 03680, Ukraine.3CIMAP Normandie Univ, ENSICAEN,
UNICAEN, CEA, CNRS, 6 Boulevard Marechal Juin, Caen 14050, France.
Received: 7 November 2016 Accepted: 14 February 2017
References
1. Bansal P, Chaudhary GR, Mehta SK (2015) Comparative study of catalytic activity of ZrO2nanoparticles for sonocatalytic and photocatalytic
degradation of cationic and anionic dyes. Chem Eng J 280:475–85 2. Wright PK, Evans AG (1999) Mechanisms governing the performance of
thermal barrier coatings. Curr Opinion Solid State Mater Sci 4(3):255–65 3. Miura N, Sato T, Anggraini SA, Ikeda H, Zhuiykov S (2014) A review of
mixed-potential type zirconia-based gas sensors. Ionics 20:901–925 4. Fidelus JD, Lojkowski W, Millers D, Smits K, Grigorjeva L (2009) Advanced
nanocrystalline ZrO2for optical oxygen sensors. 2009 IEEE Sensors,
Christchurch, p 1268-1272. doi:10.1109/ICSENS.2009.5398385
5. Fidelus JD,Łojkowski W, Millers D, Grigorjeva L, Smits K, Piticescu RR (2007) Zirconia based nanomaterials for oxygen sensors—generation,
characterization and optical properties. Solid State Phenom 128:141–50 6. Kirm M, Aarik J, Jürgens M, Sildos I (2005) Thin films of HfO2and ZrO2as
potential scintillators. Nucl Inst Meth Phys Res A 537:251–5
7. Wang F, Banerjee D, Liu Y, Chen X, Liu X (2010) Upconversion nanoparticles in biological labeling, imaging, and therapy. Analyst 135:1839–54 8. Amezaga-Madrid P, Hurtado-Macias A, Antunez-Flores W, Estrada-Ortiz F,
Piza-Ruiz P, Miki-Yoshida M (2012) Synthesis, microstructural, optical and mechanical properties of yttria stabilized zirconia thin films. J Alloys Compd 536:S412–S417
9. Korsunska N, Zhuk A, Papusha V, Kolomys O, Polishchuk Y, Bacherikov Y, Strelchuk V, Kladko V, Konstantinova T, Kryshtab T, Khomenkova L (2015) Structural and optical characterization of ZrO2and Y2O3-ZrO2nanopowders.
In: Pérez Campos R, Contreras Cuevas A, Esparza Muñoz R, editors. Materials Characterization. Springer International Publishing Switzerland, p 59–67. doi: 10.1007/978-3-319-15204-2_7
10. Korsunska N, Papusha V, Kolomys O, Strelchuk V, Kuchuk A, Kladko V, Bacherikov Y, Konstantinova T, Khomenkova L (2014) Nanostructured Y-doped ZrO2powder: peculiarities of light emission under electron beam
excitation. Phys Stat Sol C 11:1411–22
11. Petrik NY, Tailor DP, Orlando TM (1999) Laser-stimulated luminescence of yttria-stabilized cubic zirconia crystals. J Appl Phys 85:6770–6
12. Etsell TH, Flengas SN (1970) The electrical properties of solid oxide electrolytes. Chem Rev 70:339–76
13. Mahato N, Banerjee A, Gupta A, Omar S, Balani K (2015) Progress in material selection for solid oxide fuel cell technology: a review. Prog Mater Sci 72: 141–337
14. Yashar P, Rechner J, Wong MS, Sproul WD, Barnett SA (1997) High-rate reactive sputtering of yttria-stabilized zirconia using pulsed d.c. power. Surf Coat Technol. 94–95:333–8.
15. Steele BCH, Heinzel A (2001) Materials for fuel-cell technologies. Nature 414: 345–352
16. Vaßen R (2013) Thermal Barrier Coatings. In: Riedel R, Chen IW, editors. Ceramics Science and Technology, Set. Wiley-VCH Verlag GmbH & Co. KGaA, Weinheim, Germany, p 95-115. doi:10.1002/9783527631940.ch52
17. Ran S, Winnubst L, Blank DHA, Pasaribu HR, Sloetjes JW, Schipper DJ (2007) Effect of microstructure on the tribological and mechanical properties of CuO-doped 3Y-TZP ceramics. J Am Ceram Soc 90:2747–52
18. Sun J, Sermon PA (1994) Evidence of a metal-support in sol-gel derived Cu-ZrO2catalysts for CO hydrogenation. Catal Lett 29:361–9
19. Samson K,Śliwa M, Socha RP, Góra-Marek K, Mucha D, Rutkowska-Zbik D, Paul JF, Ruggiero-Mikołajczyk M, Grabowski R, Słoczyński J (2014) Influence of ZrO2structure and copper electronic state on activity of Cu/ZrO2
catalysts in methanol synthesis from CO2. ACS Catal 4:3730–41
20. Pakharukova VP, Moroz EM, Zyuzin DA, Ishchenko AV, Dolgikh LY, Strizhak PE (2015) Structure of copper oxide species supported on monoclinic zirconia. J Phys Chem C 119:28828–35
21. Zhang Y, Chen C, Lin X, Li D, Chen X, Zhan Y, Zheng Q (2014) CuO/ZrO2
catalysts for water–gas shift reaction: nature of catalytically active copper species. Int J Hydrogen Energy 39:3746–54
22. Sherif AS, Hachtmann JE. Stable copper zirconium complex salt solutions for enhancing the resistance to rot of cotton fabrics. Patent US 4200672. 29.04.1980. 23. Korsunska N, Baran M, Polishchuk Y, Kolomys O, Stara T, Kharchenko M,
Gorban O, Strelchuk V, Venger Y, Kladko V, Khomenkova L (2015) Structural and luminescent properties of (Y,Cu)-codoped zirconia nanopowders. ECS J Solid St Sci Technol 4:N103–N110
24. Liu Z, Amiridis MD, Chen Y (2005) Characterization of CuO supported on tetragonal ZrO2catalysts for N2O decomposition to N2. J Phys
Chem B 109:1251–5
25. Zhang Y, Hu L, Li HK, Chen J (2008) Densification and phase transformation during pressureless sintering of nanocrystalline ZrO2–Y2O3–CuO ternary
system. J Am Ceram Soc 91:1332–4
26. Winnubst L, Ran S, Speets EA, Blank DHA (2009) Analysis of reactions during sintering of CuO-doped 3Y-TZP nano-powder composites. J Europ Ceram Soc 29:2549–57
27. Mahesh B, Ramaswamy AV, Tyagi AK, Ramaswamy V (2003) Rietveld refinement study of nanocrystalline copper doped zirconia. Mater Res Bull 38:1713–24
28. Chary KV, Sagar GV, Srikanth CS, Rao VV (2007) Characterization and catalytic functionalities of copper oxide catalysts supported on zirconia. J Phys Chem B 111:543–50
29. Ma ZY, Yang C, Wei W, Li WH, Sun YH (2005) Catalytic performance of copper supported on zirconia polymorphs for CO hydrogenation. J Mol Catal A: Chem 231:75–81
30. Wang LC, Liu Q, Chen M, Liu YM, Cao Y, He Y, Fan KN (2007) Structural evolution and catalytic properties of nanostructured Cu/ZrO2catalysts prepared by oxalate
gel-coprecipitation technique. J Phys Chem C 111:16549–57
31. Liu DW, Perry CH, Ingel RP (1988) Infrared spectra in nonstoichiometric yttria‐stabilized zirconia mixed crystals at elevated temperatures. J Appl Phys 64:1413–7
32. Korsunska N, Polishchuk Yu, Kladko V, Portier X, Khomenkova L (2017) Thermo-stimulated evolution of crystalline structure and dopant distribution in Cu-doped Y-stabilized ZrO2nanopowders. Mater Res
Express, accepted manuscript, doi:10.1088/2053-1591/aa6093 33. López T, Alvarez M, Gómez R, Aguilar DH, Quintana P (2005) ZrO2and Cu/
ZrO2sol–gel materials spectroscopic characterization. J Sol-Gel Sci Technol
34. Cho BO, Lao SX, Chang JP (2003) Origin and effect of impurity
incorporation in plasma-enhanced ZrO2deposition. J Appl Phys 93:9345–51
35. Bykov IP, Brik AB, Bevz VV, Konstantinova TE, Yashchishin IA (2009) Radiospectroscopy investigations of zirconia nanosized powders. Nanosistemi, Nanomateriali, Nanotehnologii 7:543–72
36. Pakharukova VP, Moroz EM, Kriventsov VV, Larina TV, Boronin AI, Dolgikh LY, Strizhak PE (2009) Structure and state of copper oxide species supported on yttria-stabilized Zirconia. J Phys Chem C 113:21368–75
37. Goff JP, Hayes W, Hull S, Hutchings MT, Clausen KN (1999) Defect structure of yttria-stabilized zirconia and its influence on the ionic conductivity at elevated temperatures. Phys Rev B 59:14202–19
38. Liu Z, Ji W, Dong L, Chen Y (1997) Electron spin resonance studied of CuO supported on tetragonal ZrO2. J Catal 172:243–6
39. Chen C, Ruan C, Zhan Y, Lin X, Zheng Q, Wei K (2014) The significant role of oxygen vacancy in Cu/ZrO2catalyst for enhancing water—gas-shift
performance. Int J Hydrogen Energy 39:317–24
40. Altynnikov AA, Tsikoza LT, Anufrienko VF (2006) Ordering of Cu(II) ions in supported copper-titanium oxide catalysts. J Struct Chem 47:1161–9 41. Gorban O, Gorban S, Zarechnaya O, Kharchenko M, Konstantinova T (2016)
Low-temperature stage formation of interface composition systems Cu-Y-Zr-O. In: Fesenko O, Yatsenko L, editors. Nanophysics, Nanophotonics, Surface Studies, and Applications. Springer Proceedings in Physics 183. Springer International Publishing, Switzerland, p 543–549. doi:10.1007/978-3-319-30737-4_44
Submit your manuscript to a
journal and benefi t from:
7 Convenient online submission 7 Rigorous peer review7 Immediate publication on acceptance 7 Open access: articles freely available online 7 High visibility within the fi eld
7 Retaining the copyright to your article