HAL Id: hal-03219606
https://hal.sorbonne-universite.fr/hal-03219606
Submitted on 6 May 2021HAL is a multi-disciplinary open access
archive for the deposit and dissemination of sci-entific research documents, whether they are pub-lished or not. The documents may come from teaching and research institutions in France or abroad, or from public or private research centers.
L’archive ouverte pluridisciplinaire HAL, est destinée au dépôt et à la diffusion de documents scientifiques de niveau recherche, publiés ou non, émanant des établissements d’enseignement et de recherche français ou étrangers, des laboratoires publics ou privés.
Surface Chemistry of Gold Nanoparticles Produced by
Laser Ablation in Pure and Saline Water
Anna Lévy, Manuel de Anda Villa, Gaétan Laurens, Valérie Blanchet, John
Bozek, Jérôme Gaudin, Emily Lamour, Stéphane Macé, Pierre Mignon,
Aleksandar Milosavljević, et al.
To cite this version:
Anna Lévy, Manuel de Anda Villa, Gaétan Laurens, Valérie Blanchet, John Bozek, et al.. Surface Chemistry of Gold Nanoparticles Produced by Laser Ablation in Pure and Saline Water. Langmuir, American Chemical Society, 2021, �10.1021/acs.langmuir.1c00092�. �hal-03219606�
Surface chemistry of gold nanoparticles produced
by laser ablation in pure and saline water
Anna L´
evy,
˚,:Manuel De Anda Villa,
:Ga´
etan Laurens,
;Val´
erie Blanchet,
¶John
Bozek,
§J´
erˆ
ome Gaudin,
¶Emily Lamour,
:St´
ephane Mac´
e,
:Pierre Mignon,
;Aleksandar R. Milosavljevi´
c,
§Christophe Nicolas,
§Minna Patanen,
}Christophe
Prigent,
:Emmanuel Robert,
§S´
ebastien Steydli,
:Martino Trassinelli,
:Dominique Vernhet,
:Onni Vetel¨
ainen,
}and David Amans
;:Institut des Nanosciences de Paris, Sorbonne Universit´e, Campus Pierre et Marie Curie, CNRS UMR7588, 75005 Paris, France
;Universit´e Claude Bernard Lyon 1, UMR5306 CNRS, Institut Lumi`ere Mati`ere, University of Lyon, F-69622 Villeurbanne, France
¶CNRS, CEA, CELIA (Centre Lasers Intenses et Applications), University of Bordeaux, UMR5107, F-33405 Talence, France
§L’Orme des Merisiers, Synchrotron SOLEIL, Saint-Aubin, BP 48, F-91192 Gif-sur-Yvette Cedex, France
}Nano and Molecular Systems Research Unit, Faculty of Science, University of Oulu, P.O. Box 3000, FI-90014 Oulu, Finland
E-mail: levy@insp.jussieu.fr
Abstract
nanoparti-The colloid stability involves different reactivities, chemical equilibria with complex ionic-specific effects at the nanoparticle/solvent interface which must be strongly influ-enced by their chemical composition. In this work, the surface composition of PLAL-produced gold nanoparticles in alkaline and saline (NaBr) water is investigated by x-ray photoemission spectroscopy on free-flying nanoparticles, exempt from any sub-strate or radiation damage artefact. The Au 4f photoelectron spectra with a depth profiling investigation are used to evaluate the degree of nanoparticle surface oxida-tion. In alkaline water, the results preclude any surface oxidation contrary to the case of nanoparticles produced in NaBr solution. In addition, the analysis of Br 3d core level photoelectron spectra agrees with a clear signature of Br on the nanoparticle sur-face which is confirmed by a specific valence band feature. This experimental study is supported by DFT calculations evaluating the energy balance of halide adsorption on different configurations of gold surfaces including oxidation or adsorbed salts.
Introduction
The increasing interest for nanoparticles (NPs) is evidenced by the ever growing number of publications in all fields of research, which has been multiplied by a factor of 40 in the past twenty years. It covers numerous scientific fields including chemistry, material science, biology and environmental science. These nanometric objects are attractive for catalysis, electronics and medicine to cite only a few (see Ref. 1,2 and references therein). This diversity of applications goes along with an increasing request of particle variety in terms of size, composition, geometrical shape and arrangement. In all cases, a precise control and characterization of their surface composition as well as their crystalline structure are required given their high surface reactivity and their multifunctional capacities. This motivates the development of different synthesis methods3which have their own advantages and drawbacks.
The pulsed laser ablation (synthesis) in liquid (solution) (PLAL/LASIS) method4,5 ap-peared in the 1990s.6 One of its main advantages relies on its relative simplicity since it is
based on millijoule laser irradiation of a solid target in a liquid environment. This simplicity comes with a few limitations including the resulting bimodal size distribution7–9 and the
inability to control on demand the particle shape. However, as long as the ablation thresh-old of the irradiated material can be reached, nanoparticles can be formed in a generated confined plasma via nucleation and coalescence processes.9–11 This makes PLAL technique
highly versatile since metallic, oxide, semi-conductor, alloy and even core-shell12 particles can be produced. Relatively high production rates can be reached nowadays (in the range of 1 g/h) by improving the laser parameters and setup designs.13,14 The production of bare nanoparticles is thus possible making the PLAL method one of the most attractive for ap-plications which either require a specific functionalization or cannot withstand toxic capping agents. Free of organic ligands, these bare NPs, and particularly gold-NPs are particularly relevant for catalysis.15–19 In this work, we aim to investigate the two following related open
questions: (i) What is the origin of the colloid stability of these bare NPs? (ii) Is their surface actually naked, free of any oxidation and/or adsorbed ions that is supposed to participate to the colloidal stability?
These questions are the subject of a vast literature which investigates the reason why surfactant-free PLAL colloids are stable. The most common synthesis method based on wet chemical reduction of a molecular precursor prevents the agglomeration through electrostatic and/or steric repulsion by using capping agents. When produced by PLAL, the NPs can be stable for months despite the absence of these stabilizing molecules. The stability is attributed to a pure electrostatic effect, demonstrated by the clear correlation between the ζ-potential of the particles and their size distribution. For low values, coagulation of the NPs occurs.20 However, the ζ-potential evaluates only the charge dragged with the nanoparticle
within the hydrodynamic volume. The net charge can only be indirectly deduced if the size distribution and ionic strength are known.21Hence, two different hypotheses are investigated
due to a partial surface oxidation22–24 or to an excess of electrons captured during the
plasma phase of the ablation process.20,25,26 PLAL synthesis is often optimized by using
saline solutions in order to improve the control on the NP size distribution27–29 and enhance
the colloid stability.23,24,30,31 In this case, the stability picture of the colloid might involve
also the possible presence of halogen anions. This third hypothesis, also investigated by the community, considers that the halogen ion might itself carry a negative charge or could favour the NP surface oxidation. These questions are still a matter of debate with conflicting results and there is no direct evidence supporting one or the other of these hypotheses. The present work addresses this issue by performing a chemical analysis of gold NPs produced by PLAL and by comparing the cases of pure alkaline and saline (NaBr) water solvents.
Surface characterization is achieved by probing a free-standing nanoparticle beam with synchrotron radiation excited x-ray photoelectron spectroscopy (XPS). This particular gas-phase environment is used here based on our previous works32,33 which demonstrate the importance of probing NPs free of any substrate effects, but also using x-ray energies ad-justed to improve the surface sensitivity. The latter is of particular importance since the disagreement on the presence of oxides on PLAL gold NP surfaces is correlated with the probing photon energy. No oxide is observed in refs. 32,34 using photon energies below 1 keV. On the contrary, the presence of oxide is confirmed in refs. 22–24,35 probing the samples with either Mg or Al Kα radiation above 1 keV. Using these optimized
experimen-tal conditions, we conclude on the presence of halide ions on and in the nanoparticle. The results are supported by DFT calculations.
Experimental section and methods
This section presents the experimental protocol which includes the different successive steps, summarized in Figure 1. First, the samples have been prepared at the ILM laboratory (Institut Lumi`ere Mati`ere, Lyon, France). The synthesis and preparation procedure are
de-scribed in the section ”Material”. Then, XPS measurements have been performed at the PLEIADES beamline of the SOLEIL synchrotron facility (Saint-Aubin, France) on a free-standing nanoparticle beam. The experimental details are reported in section ”Nanoparticle Beam Generation and XPS Measurements” and the analysis procedure in section ”XPS core level Bayesian analysis procedure”. At different steps of this experiment, sample character-izations have been performed to track colloids evolution in terms of size distribution and concentration using transmission electron microscopy (TEM), analytical disc centrifugation (ADC) and UV-Visible absorption spectroscopy (UV-Vis). The results are reported and discussed in the corresponding sub-sections. The last subsection, ”Theoretical Methods”, describes the DFT calculations performed to support experimental analysis.
Material
Two colloidal gold solutions were prepared using the PLAL synthesis method. The laser beam, from a passively Q-switched kilohertz Nd:YAG laser (1 kHz, 1064 nm) is amplified using a laser gain module (Taranis module), which consists in a diode pumped Nd:YAG single crystal fiber.37 Each pulse is 500 ps long. The energy on the solid target is 1.5 mJ.
The Gaussian TEM00 beam (beam quality M2 ă 1.3) is expended to reach a diameter 2 ω of 6.5 mm (maximum intensity divided by e2), and is then focused at the surface of the target using a F-Theta scan lens (160 mm focal length). The expected beam waist 2 ω0 on the
target is then 44 µm. It leads to a surface power density of 2 ˆ 1011 W.cm´2. Ablation is
performed on a gold target provided by Neyco s.a. (99.99% purity, 10 mmˆ20 mmˆ2 mm). A fast steering mirror system was used to scan the target surface. The ablated surface was 9 mm ˆ 18 mm. The target is placed in a fluidic system (see Figure 1. A). The liquid layer above the target is 8 mm thick. The continuous flow of liquid above the target ensures an in-line production of colloidal gold and limits the detrimental irradiation of the produced particles which could lead to fragmentation27,38,39 and/or melting40,41 of the as-produced particles.
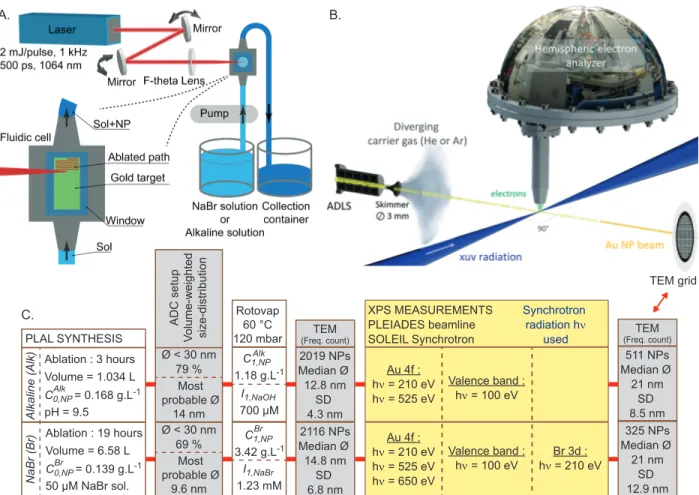
A. B. C. TEM grid NaBr (Br) Alkaline (Alk) PLAL SYNTHESIS C0,NP Alk = 0.168 g.L-1 pH = 9.5 Volume = 1.034 L Ablation : 3 hours C0,NP Br = 0.139 g.L-1 50 µM NaBr sol. Volume = 6.58 L Ablation : 19 hours ADC setup Volume-weighted size-distribution Rotovap 60 °C 120 mbar C1,NP 1.18 g.L-1 Alk C1,NP 3.42 g.L-1 Br I1,NaBr 1.23 mM I1,NaOH 700 µM Ø < 30 nm 79 % Most probable Ø 14 nm Ø < 30 nm 69 % Most probable Ø 9.6 nm TEM (Freq. count) 2019 NPs Median Ø 12.8 nm SD 4.3 nm 2116 NPs Median Ø 14.8 nm SD 6.8 nm TEM (Freq. count) 511 NPs Median Ø 21 nm SD 8.5 nm 325 NPs Median Ø 21 nm SD 12.9 nm Au 4f : hν = 210 eV hν = 525 eV Valence band : hν = 100 eV Valence band : hν = 100 eV Au 4f : hν = 210 eV hν = 525 eV hν = 650 eV Br 3d : hν = 210 eV XPS MEASUREMENTS PLEIADES beamline SOLEIL Synchrotron Synchrotron radiation hν used
Figure 1: A. Schematic representation of the PLAL setup, including the fluidic system. B. Experimental setup of the XPS measurements of the Au NP beam generated by the aerodynamic lens (ADLS). ADLS can lead to a size selection.36 TEM grids are installed
in the setup to collect particles after the ADLS. C. Experimental protocol summarizing the different steps including: PLAL synthesis; increase of the colloidal gold concentration (Rotovap : partial evaporation using a rotary evaporator); sample characterization (TEM, ADC) at different stages of the preparation; and XPS measurements. CAlk
0,N P and C0,N PBr stand
for the NP concentrations of the as-produced colloidal gold solutions produced in pure NaOH alkaline solution (named Alkaline) and in NaBr saline solution (named N aBr), respectively. CAlk
1,N P, C1,N PBr correspond to gold concentrations after the concentration step. I1,N aOH and
I1,N aBrare related to the ionic strength of the solutions after the concentration step. For each
sample, the mean diameter and the standard deviation (SD) are related to the frequency count deduced from the TEM pictures.
Two syntheses were carried out, one in a 100 µM NaOH alkaline solution (pH “ 9.5), and one in a 50 µM sodium bromide solution (NaBr salt from Roth, Art.-Nr. HN15.1, pu-rity ą 99%, dissolved in 18.2 MΩ.cm resistivity ultra-pure water). The gold concentration in the as-produced colloid is deduced from the ablated mass on the target (target weigh-ing). Starting from the alkaline solution, 3 hours of continuous ablation leads to 1.034 L (˘ 1 mL) of colloidal solution containing 174 mg (˘ 1 mg) of gold NPs. The concentration of the as-produced solution is thus C0,N PAlk “ 0.168 g.L´1 (˘ 1 mg.L´1). The productivity is
58 mg.h´1 (16.1 ng per laser pulse). Starting from the sodium bromide solution, 19 hours
of continuous ablation leads to 6.58 L (˘ 1 mL) of colloids containing 916 mg (˘ 1 mg) of gold NPs. The concentration of the as-produced solution is thus CBr
0,N P “ 0.139 g.L´1
(˘ 1 mg.L´1). The productivity is 48.2 mg.h´1 (13.4 ng per laser pulse). For the needs of
the XPS measurements, solutions with a concentration higher than 1 g/L were demanded. A rotary evaporator is used to partly remove the solvent and gently increase the concentration of the as-produced solution. The bath temperature is set to 60˝C and the partial vacuum
to 120 mbar. The 1.034 L of colloidal gold in the alkaline solution are evaporated to reach 148 mL. The concentration of the concentrated solution used for the XPS experiment is thus CAlk
1,N P “ 1.18 g.L´1. The ionic strength of the alkaline solution shifts from I0,N aOH “ 100 µM
to I1,N aOH “ 700 µM. The sample is called Alkaline sample. The 6.58 L of colloidal gold in
the NaBr solution are evaporated to reach 837 mL. Then 425 mL are collected and reduced to 136 mL in a second step. The concentration of the concentrated solution used for the XPS experiment is thus C1,N PBr “ 3.42 g.L´1. The ionic strength of the sodium bromide solution shifts from I0,N aBr “ 50 µM to I1,N aBr “ 1.23 mM. The sample is called N aBr sample.
The ionic strength of both samples remains low enough to preserve the colloidal stability8
as confirmed by the absorption spectra (see Figure 4) and the red color of the concentrated solution, which is characteristic of the surface plasmon resonance of non-aggregated spherical gold NPs in water with a diameter below a few tens of nanometers (see Figures 2.C-H).
from pure NaBr salt (sample N aBrW) in a concentration close to the N aBr sample injected
into the aerodynamic lens.
Particle-size distribution (TEM and ADC)
Transmission Electron Microscopy (TEM) experiments are carried out on a JEOL 2100HT microscope operating at 200 kV. High resolution images are acquired using a Gatan Orius 200 camera. A droplet of the colloidal solution is poured onto a carbon film on 300 mesh grids (reference XAGS160-3 from Agar scientific). The number-weighted size distributions are deduced from the analysis of TEM pictures using the ParticleSizer script in Fiji software42 (see insets in Figure 2.D).
Analytical disc centrifugation (ADC), reported in Figures 2. A-B, is performed using a device from CPS Instruments, Inc (model DC24000 UHR). ADC is known as an efficient analytical method for broad particle-size distribution43 and is based on the differential
sedi-mentation of the particles in a sucrose density gradient filling a rotating disc. Prior to each measurement, a reference standard colloid (colloidal PVC particles of 263 nm) is injected. The speed of the disc is set to 24000 rpm for all samples. 100 mL of the as-produced colloidal solution is injected at the center of the disc. Measurements for particles below 5 nm are not relevant. The measured diameters correspond to hydrodynamic diameters.
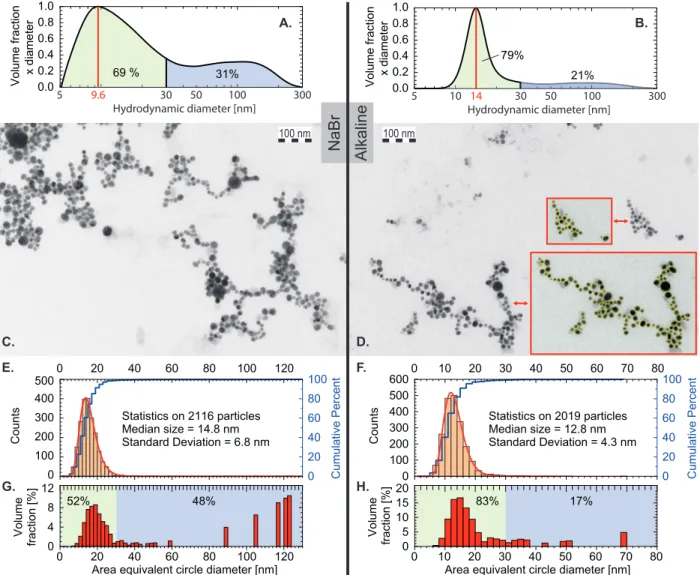
The as-produced solutions show a bimodal size distribution (see Figure 2. A-B), com-monly observed for PLAL-generated gold NPs. The gentle concentration step using rotary evaporator does not seem to induce a drastic increase of the nanoparticle sizes (see Figure 2. C to H), even if a small shift of the median size is observed looking at the volume fraction (Figure 2. A-B compared to G-H). After the aerodynamic lens system, distributions appear to be shifted toward larger sizes (see Figure 3).
0 20 40 60 80 100 0 20 40 60 80 100 120 0 100 200 300 400 500 C ou nt s
Area equivalent circle diameter [nm] Statistics on 2116 particles Median size = 14.8 nm Standard Deviation = 6.8 nm C um ul at iv e Pe rc en t 0 20 40 60 80 100 120 0 4 8 12 Vo lu m e fra ct io n [% ] 52% 48% 0 20 40 60 80 100 0 10 20 30 40 50 60 70 80 0 100 200 300 400 500 600 C ou nt s
Area equivalent circle diameter [nm] Statistics on 2019 particles Median size = 12.8 nm Standard Deviation = 4.3 nm C um ul at iv e Pe rc en t 0 10 20 30 40 50 60 70 80 0 5 10 15 20 Vo lu m e fra ct io n [% ] 83% 17% Hydrodynamic diameter [nm] Vo lu m e fraction x diameter 10 100 5 50 300 0.0 0.2 0.4 0.6 0.8 1.0 14 21% 79% 30 Alkaline NaBr 31% 69 % Hydrodynamic diameter [nm] Vo lu m e fraction x diameter 100 5 50 300 0.0 0.2 0.4 0.6 0.8 1.0 30 9.6 A. B. D. 100 nm G. H. E. F. 100 nm C.
Figure 2: A., C., E. and G. correspond to the synthesis in a NaBr solution while B., D. F. and H. in the alkaline solution. A. and B. show volume-weighted size distribution of the as-produced colloids measured using Analytical disc centrifugation (ADC). The volume fraction of a size range corresponds to the area under the curve. Displayed percentage in the green and blue filled areas correspond to particles with sizes smaller and larger than 30 nm respectively. C. and D. are representative TEM pictures of the concentrated colloids used for XPS measurements. E. and F. show number-weighted size distributions (counts) deduced from the analysis of TEM pictures using the ParticleSizer script from Fiji software.42 Insets
in D. show representative results of the automatic detection. Median size and standard deviation are deduced from the statistical analysis on more than 2000 particles. Size distri-butions follow log-normal distridistri-butions as expected. Red curves correspond to log-normal fit (R2 “ 0.997 and 0.999 for synthesis in NaBr and alkaline solutions respectively). G. and H. correspond to the volume-weighted size distribution deduced from E. and F.
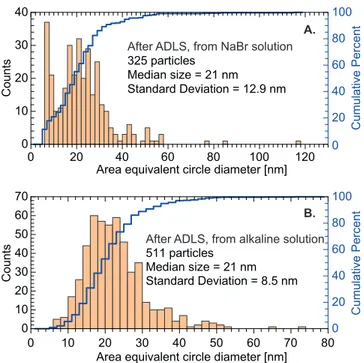
0 20 40 60 80 100 0 20 40 60 80 100 120 0 10 20 30 40 C ou nt s
Area equivalent circle diameter [nm]
C um ul at iv e Pe rc en t 325 particles Median size = 21 nm Standard Deviation = 12.9 nm A. 0 20 40 60 80 100 0 10 20 30 40 50 60 70 80 0 10 20 30 40 50 60 70 C ou nt s
Area equivalent circle diameter [nm] 511 particles Median size = 21 nm Standard Deviation = 8.5 nm C um ul at iv e Pe rc en t B.
After ADLS, from NaBr solution
After ADLS, from alkaline solution
Figure 3: Number-weighted size distributions after the aerodynamic lens system (collected on the TEM grids installed in the vacuum XPS chamber) for the N aBr (A.) as well as the Alkaline (B.) samples. Distributions are deduced from the analysis of TEM pictures using the ParticleSizer script from Fiji software,42 and correspond to the area equivalent
circle diameter of the aggregates. Median size and standard deviation are deduced from the statistical analysis on 325 and 511 particles for N aBr and Alkaline samples respectively.
UV–Visible Spectroscopy
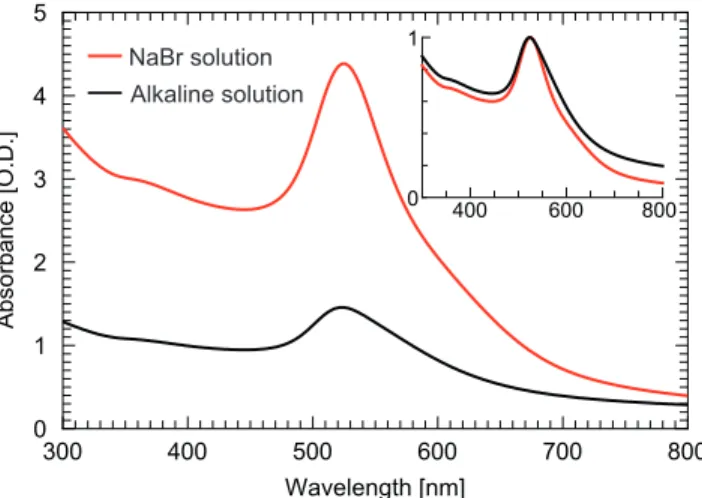
The vis spectra reported in Figure 4 have been collected with an Agilent Cary 4000 UV-vis spectrophotometer using an optical glass cuvette of 1 cm path length. The concentrated samples are diluted 10 times in deionized water prior the measurements in order to avoid absorption saturation. Absorption spectra show a plasmon peak profile centered at 524 nm, characteristic of non-aggregated spherical gold NPs in water with a diameter below a few tens of nanometers. For larger particles, the surface plasmon resonance peak is shifted toward larger wavelengths. Large particles reported in the volume-weighted size distributions displayed in Figures 2. G-H lead to an increased absorption in the red and near infrared wavelength range. 300 400 500 600 700 800 0 1 2 3 4 5 Ab so rb an ce [O .D .] Wavelength [nm] NaBr solution Alkaline solution 400 600 800 0 1
Figure 4: Absorption spectra of the concentrated solutions diluted 10 times for the UV-vis measurement. The red curve corresponds to N aBr sample and the black curve to the Alkaline sample. The inset shows the normalized spectra with respect to the absorption at the plasmon resonance.
Nanoparticle Beam Generation and XPS Measurements
The XPS measurements are performed on free-standing NPs thanks to the dedicated system of the PLEIADES beamline of the SOLEIL synchrotron facility. A detailed description of this system and of the specific configuration of this experiment are reported in Refs. 32,44.
The experimental arrangement consists in three steps: the sample aerosolization, the free-standing NPs beam generation and the NPs/synchrotron radiation interaction.
First, the colloid is converted into droplets using a commercial atomizer source (TSI Inc. 3076). The solvent is thereafter evaporated using two consecutive silica gel dryers before being introduced into the aerodynamic lens system45,46 (ADLS) through an entrance
pinhole of 270 µm diameter. This system generates a focused free-flying NPs beam in the main interaction chamber thanks to a succession of apertures through which the particles are guided by an inert carrier gas (Ar or He in our case). Finally, a 2 mm diameter tube ends the ADLS apparatus to partially get rid of the diverging carrier gas and reduce the pressure in the main chamber to a reasonable value for the XPS detection system (ă 10´5 mbar). Using
this configuration the following XPS spectra have been recorded, typically in 2 to 5 hours. TEM grids, located in a separate vacuum chamber in the line of sight of the NPs beam, are inserted to collect the NPs after the ADLS system. This has been set to evaluate the ADLS effect/filtering on the NP size distribution (Figure 3).
As schematized in Figure 1. B, the synchrotron beam intersects the NPs beam at 90˝. Au
4f, Br 3d core levels and valence band spectra have been measured with a VG-Scienta R4000 electron energy analyzer standing in the vertical direction. The x-ray beam, set in circular left polarization, and the detector parameters (monochromator exit slits, Scienta entrance slit, pass energy) were adjusted to achieve the required overall experimental resolutions (∆E) reported in Table S1 of the supplementary information file.
Au 4f core level spectra have been recorded at different photon energies (210, 525 eV for Alkaline sample and 210, 525 and 650 eV for N aBr sample) in order to increase the probing depth of the diagnostic and evaluate the chemical composition of the NPs below the first atomic layer. The corresponding probing depths are evaluated based on the effective electron attenuation length (EAL) in gold according to equation CS2 of Cumpson and Seah.47 The
values reported in Table S1 in the range of 0.2 to 0.5 nm are already corrected by the topofactor (“ 0.67) in order to take into account the NP topology.48
Br 3d core level spectra have been recorded on the N aBr sample at 210 eV. As such, the nanoparticle surface chemical composition have been investigated with high surface sen-sitivity. However, the ADLS tends to also form salt nanocrystals flying concomitantly with the Au nanoparticles while using saline solvents.49 Therefore, the Br 3d spectrum includes
also a non-negligible contribution from these NaBr nanocrystals. To discriminate both con-tributions (Br 3d from gold or from NaBr nanocrystals), Br 3d core-level spectra have been acquired with an improved spectral resolution (∆E “ 320 meV) and compared with a pure saline water sample (N aBrW).
Finally, valence band spectra have been acquired at 100 eV on Alkaline, N aBr and N aBrW samples.
Background subtraction, prior to the following data analysis procedure, has been per-formed in some required cases. Au 4f spectra recorded at 210 eV included an important non linear background, due to the Ar carrier gas, which has been subtracted using an iden-tical measurement performed on either pure water or saline NaBr water (N aBrW). At 525 and 650 eV, this data post-processing was not required since at these photon energies the photoelectron background was constant. Background subtractions have also been applied on valence spectra due to intense gas-phase components from the residual carrier gas and solvent. For such correction, the position-sensitive XPS detector feature is used: solid-phase samples, focused by the ADLS, lead to an XPS signal centered on the detector image while diverging gas-phase contributions are uniformly distributed. This procedure is applied on the Alkaline sample. For the N aBr sample, the contribution mentioned above from the solid-phase salt nanocrystals formed during the aerosolisation49 was subtracted using the valence spectrum recorded on saline water (N aBrW). As such, the residual carrier gas and
solvent contributions were also suppressed.
Finally, spectral calibration is achieved, with respect to the vacuum level, based on Ar 3s satellites,50 Ar 2p core level (located at E
B = 248.4 and 250.6 eV binding energies and
XPS core level Bayesian analysis procedure
The Au 4f and Br 3d core level spectra are analyzed considering different modeling functions in order to: (i) extract the core-level shape parameters (central binding energy position, natural width, amplitude) and (ii) discriminate and evaluate the presence of different com-ponents in a given core-level. The latter is a delicate procedure, especially in the case of low counting rates and/or overlapping peaks. As detailed in Refs. 32,51, standard fitting procedures based on the maximization of the likelihood function or the minimization of the chi-square could lead to erroneous conclusions as it only assesses the fitting quality. Hence, the present data are analyzed using the Bayesian method which, among different advantages, provides the evaluation of the Bayesian evidence, ev, proportional to the probability of a fitting model. A quantitative evaluation of the probability p1 of a fitting model (1) compared
to a second one (2) can thus be evaluated using: p1 “ ev1{pev1` ev2q. This analysis is
per-formed using the code Nested Fit, described in Refs. 51–53. In the following, it is assumed that the counts in each channel follow a Poisson distribution function which gives access to the associated uncertainty. In the case of background-subtracted Au 4f spectra recorded at 210 eV, the uncertainty is incremented by the contribution of the background subtraction, i.e. the uncertainty of the subtracted signal ∆Nsubis equal to a quadratic sum of the uncertainty
before subtraction and the uncertainty of the background: ∆Nsub “
b
∆N2` ∆N2 bkg.
The analysis of Au 4f spectra is performed in order to evaluate the oxidation state through the chemical shift towards a higher binding energy compared to the main metallic photoline. Note that the term oxide refers here to the general case of a gold atom sharing part of its electrons with another atom, i.e. not necessarily with an oxygen. However, a binding energy shift due to halide adsorption is expected to be negligible according to Ref. 54. Therefore, two fitting models are used, including one or two doublets (Au 4f5{2 and Au 4f7{2). Each
doublet is a pair of Voigt functions for which the Gaussian component represents the overall instrumental resolution and, the Lorentzian one, the natural lifetime broadening. The latter is fixed here to the known value55 of 0.33 eV as well as the doublet branching ratio to 4:3.
An active Shirley background for the inelastic photoelectron signal subtraction is used with a constant baseline.
The main objective of probing Br 3d core level on the N aBr sample was to evaluate the presence of Br on the NP surface. As mentioned above, if present, this signal was expected to be mixed with Br 3d photoelectrons emitted by the NaBr nanocrystals formed during the aerosolisation. The high-resolution Br 3d spectrum was thus fitted using two different fitting models including one or two doublets. The first model is associated to a unique contribution from NaBr nanocrystals (i.e. no Br on the Au-NP surface) while the second one includes both contributions (i.e. Br is present on the Au-NP surface). For that purpose, one or two pairs of Voigt functions have been used fixing the Gaussian width to the experimental overall resolution and the branching ratio to 3:2 expected for Br 3d core-levels. The first model used free spin-orbit splitting and natural broadening while the second one used values deduced from the saline water N aBrW sample fitted spectrum recorded in the same conditions. A linear background was used.
For this XPS data analysis, when two models are compared, their relative probability is deduced from their respective Bayesian evidences and, the associated uncertainty has been obtained after multiple computational fitting runs (5 to 10 runs).
Theoretical Methods
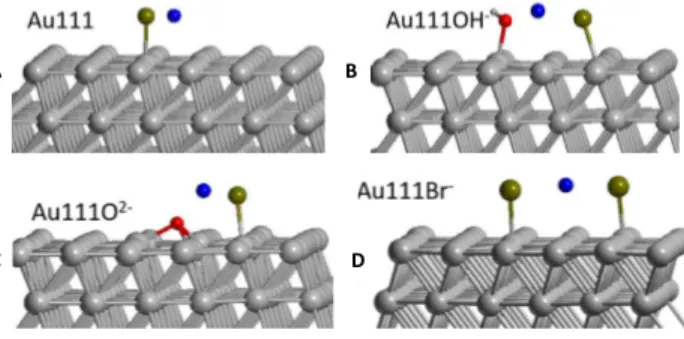
In order to support experimental results, DFT calculations are undertaken to evaluate the gold surface properties that could favour Br´ adsorption. For this purpose, four different
configurations have been investigated where (Figure 9. A-D) the surface is either free (A), oxidized (B, C, D). The Br´ adsorption is performed in the presence of the counterion Na`
for these surfaces as justified in the supplementary material.
Periodic DFT calculations were performed with the VASP Package56,57by using the pro-jector augmented wave (PAW) method to describe ionic cores and valence electrons through a plane wave basis.58,59 The Perdew-Burke-Ernzerhof (PBE) form of the generalized gradient
approximation (GGA) was used for the exchange and correlation functional.60,61 The cutoff
energy was fixed to 400 eV. The bulk gold unit cell has been initially optimized by using a 11ˆ11ˆ11 Monkhorst-Pack Gamma centered mesh to sample the Brillouin zone; a = 4.155 ˚A. The (111) surface slab is considered in the following since experimentally it is the most ob-served surface in gold NPs.62,63 The slab has been constructed from a 4ˆ4 supercell with 6
atomic layers thickness and a vacuum space of more than 15 ˚A; a = b = 11.754 ˚A; c = 28 ˚A. For the slab, the Brillouin zone was sampled through a 5ˆ5ˆ1 Monkhorst-Pack Gamma centered mesh. During geometries’ relaxations, only the first two upmost atomic layers were allowed to move in order to minimize forces, while the four below layers were maintained to the bulk geometries. Ionic relaxation was performed until a 0.01 eV/˚A threshold is reached. Spin polarized calculations were performed for all systems. Since charged slab systems were considered, monopole/dipole/quadrupole corrections were added for the calculation of the energy and forces, through the addition of linear and quadratic potentials to the local po-tential in order to correct errors due to the periodic boundaries conditions. The correction is internal to the VASP package in line with the previously developed potentials.64The charges of the system components (slab/adsorbed species) were included by modifying the number of electrons of the system: the free gold surface is neutral; upon adsorption with Br´ it
becomes negatively charged; for oxidized systems the gold surfaces were considered in their oxidized form (Au`-OH´; Au3`-O2´). The bromide salt, Na`Br´ is neutral and its
adsorp-tion does not add charges to the system. Energies were obtained through more accurate single point calculations (cutoff energy = 500 eV; increase of grid points and precision for the Fast Fourier Transform). Adsorption energies were computed as the difference between the energy of the complex and the energies of its components: surface slab (free/oxidized) and bromide salt. A negative adsorption energy thus corresponds to a favorable process.
Results and discussion
The chemical composition of the PLAL NPs is investigated using XPS measurements. Our results are presented as follows. First, Au 4f core-levels spectra are analyzed for the Alkaline and N aBr samples exploring the NP surface oxidation (see subsection ”Nanoparticle oxi-dation: Au 4f”). Then, Br 3d spectra of the N aBr and N aBrW samples recorded in high-resolved mode are compared to evaluate the presence of Br on the NP surface (subsection Br surface adsorption : Br 3d). The valence band results are reported and discussed in the light of the conclusions drawn from the core-levels analysis (subsection ”Valence bands”).
Nanoparticle oxidation: Au 4f
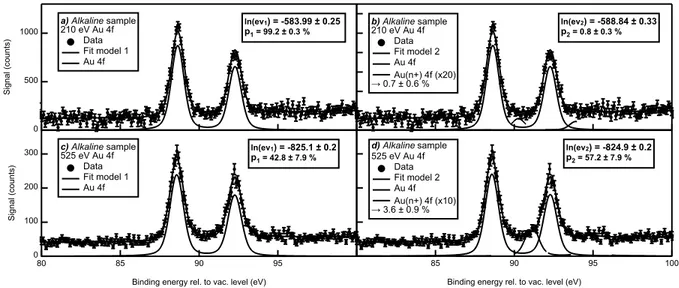
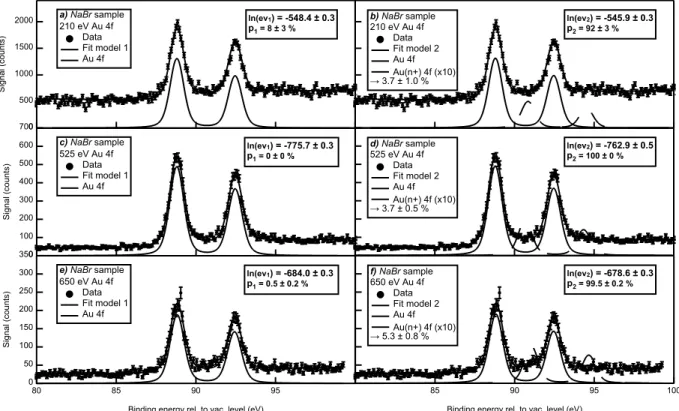
The Au 4f XPS spectra analysis is reported and discussed here along with the fits resulting from the Bayesian statistical method described above. In Figures 5 (Alkaline sample) and 6 (N aBr sample), spectra recorded at 210 eV (5a, 5b, 6a and 6b), 525 eV (5c, 5d, 6c and 6d) and 650 eV (6e and 6f) photon spectral components are analyzed using two different model functions including either one doublet (model 1 - figures a, c and e) or two (model 2 - figures b, d and f). For the sake of clarity, the second doublet, associated to an oxidized state of gold (Au(n+)), is magnified given its weak contribution of the total Au 4f signal.
In both sample cases, there is an obvious main component located around EB = 88.6 and
92.3 eV for Alkaline sample and EB = 88.8 and 92.5 eV for N aBr sample, both referenced
to the vacuum level. These doublets correspond to the atomic Au 4f electrons signal. If present (model 2), the oxide component would be shifted to higher binding energies by 1.6 to 2.5 eV depending on the photon energy and sample.65 This variation of the position of the oxide component can be attributed to a change in the chemical environment for the two different samples and/or to a surface effect as the probed depth increases with the photon energy. In all cases, the oxide contribution to the Au 4f signal is tiny (less than 5 %). To validate this Au-oxide presence or not, the evidence logarithms relative to each model for
100 95
90 85
80
Binding energy rel. to vac. level (eV)
d) Alkaline sample 525 eV Au 4f Data Fit model 2 Au 4f Au(n+) 4f (x10) → 3.6 ± 0.9 % ln(ev2) = -824.9 ± 0.2 p2 = 57.2 ± 7.9 % 300 200 100 0 Signal (counts) 100 95 90 85 80
Binding energy rel. to vac. level (eV)
c) Alkaline sample 525 eV Au 4f Data Fit model 1 Au 4f ln(ev1) = -825.1 ± 0.2 p1 = 42.8 ± 7.9 % 1000 500 0 Signal (counts) a) Alkaline sample 210 eV Au 4f Data Fit model 1 Au 4f ln(ev1) = -583.99 ± 0.25 p1 = 99.2 ± 0.3 % b) Alkaline sample 210 eV Au 4f Data Fit model 2 Au 4f Au(n+) 4f (x20) → 0.7 ± 0.6 % ln(ev2) = -588.84 ± 0.33 p2 = 0.8 ± 0.3 %
Figure 5: Au 4f XPS spectra recorded on the Alkaline sample at (a and b) 210 and (c and d) 525 eV photon energies compared to the results of the Bayesian analysis using model 1 (a and c) or model 2 (b and d) fit functions. The legend includes the value of the Bayesian evidence logarithms and the associated relative probabilities. For the sake of clarity, the (Au(n+) 4f) component is magnified by a multiplicative factor. The oxide percentage, deduced from the fit is indicated in the legend.
the different spectra are used to calculate the relative probability of the two fitting model functions. The corresponding values are report in the associated figures.
For the Alkaline sample, this analysis reveals that no oxide is present using the most surface sensitive photon energy, 210 eV, while no conclusion can be drawn when probing deeper at 525 eV. This observation would suggest that the origin of the nanoparticle charge could be explained, in this case, by trapped electrons as proposed in refs.20,25,26 On the N aBr sample, the situation is rather different since the oxide presence is confirmed at 210, 525 and 650 eV. According to these observations, one can conclude that: (i) the Alkaline sample colloid stability cannot be attributed to a surface oxidation and (ii) the N aBr sample is partially oxidized even below the first atomic layer. The latter statement does not imply that this oxidation is involved in the colloid stability. However, it indicates that the presence of salts in the solvent during the sample synthesis modifies the particle chemical composition and, probably the surface oxidation. Here, it is important to remind that the term oxidized
2000 1500 1000 500 0 Signal (counts) a) NaBr sample 210 eV Au 4f Data Fit model 1 Au 4f ln(ev1) = -548.4 ± 0.3 p1 = 8 ± 3 % b) NaBr sample 210 eV Au 4f Data Fit model 2 Au 4f Au(n+) 4f (x10) → 3.7 ± 1.0 % ln(ev2) = -545.9 ± 0.3 p2 = 92 ± 3 % 700 600 500 400 300 200 100 0 Signal (counts) c) NaBr sample 525 eV Au 4f Data Fit model 1 Au 4f ln(ev1) = -775.7 ± 0.3 p1 = 0 ± 0 % d) NaBr sample 525 eV Au 4f Data Fit model 2 Au 4f Au(n+) 4f (x10) → 3.7 ± 0.5 % ln(ev2) = -762.9 ± 0.5 p2 = 100 ± 0 % 100 95 90 85 80
Binding energy rel. to vac. level (eV)
f) NaBr sample 650 eV Au 4f Data Fit model 2 Au 4f Au(n+) 4f (x10) → 5.3 ± 0.8 % ln(ev2) = -678.6 ± 0.3 p2 = 99.5 ± 0.2 % 350 300 250 200 150 100 50 0 Signal (counts) 100 95 90 85 80
Binding energy rel. to vac. level (eV)
e) NaBr sample 650 eV Au 4f Data Fit model 1 Au 4f ln(ev1) = -684.0 ± 0.3 p1 = 0.5 ± 0.2 %
Figure 6: Au 4f XPS spectra recorded on the N aBr sample at (a and b) 210, (c and d) 525 and (e and f) 650 eV photon energies compared to the results of the Bayesian analysis using model 1 (a, c and e) or model 2 (b, d and f) fit functions. The legend includes the value of the Bayesian evidence logarithms and the associated relative probabilities. For sake of clarity, the (Au(n+) 4f) component is magnified by a multiplicative factor. The oxide percentage, deduced from the fit is indicated in the legend.
oxidation by either an oxygen or a halide ions. The former would imply that the presence of NaBr during the synthesis favors the creation gold-oxygen bonds while the latter would indicate the inclusion of bromide ions in the nanoparticle even below the first atomic layer. However, this oxide component is more likely due to gold-oxygen bonds according to the negligible shift expected on the Au-4f binding energy for halide adsorption.54 Finally, the
increasing probability of presence and the corresponding percentage of oxide gold at higher photon energies could explain the discrepancy of our results compared to what has been published at higher photon energies 22–24,35. Indeed, when a deeper probing is achieved, the amount of oxide detected below the NP surface increases. This observation stresses the importance of using a highly surface sensitive photon energy when investigating PLAL NP surface chemistry.
Br surface adsorption : Br 3d
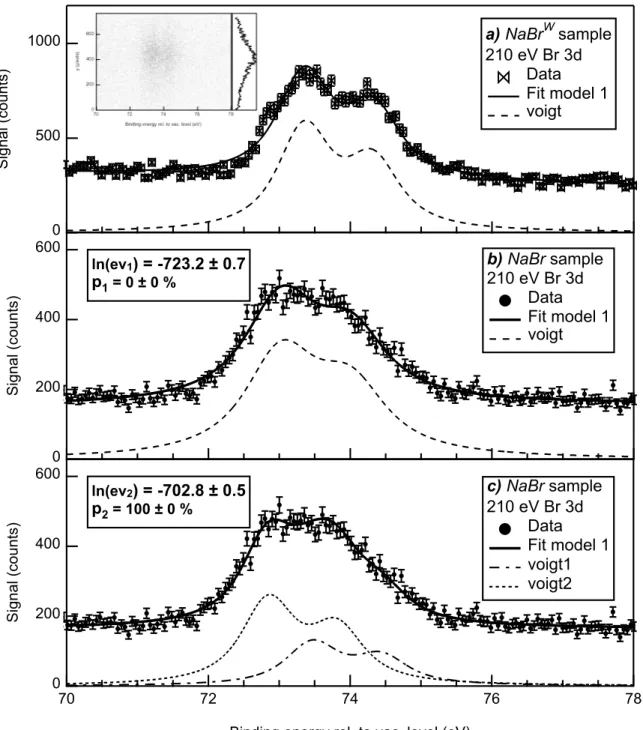
The presence of Br at the NP surface is now evaluated by comparing Br 3d spectra recorded on the N aBrW and N aBr samples in high resolved mode (∆E “ 320 meV). The N aBrW
spectrum exhibits a clear doublet located around EB “ 73.3 and 74.3 eV (see Figure 7.a)
that is assigned to NaBr nanocrystals formed during the aerosolisation. This is confirmed on the image reported in inset of Figure 7.a that shows the 2D image of the XPS detector where the signal is focused in the central region (see the y profile), as expected for solid phase samples. A qualitative difference of this spectrum with the one recorded on the N aBr sample, i.e. including gold NPs, is observed in Figures 7. An overall shift of the Br 3d level towards lower EB is evidenced as well as a visual disappearance of the spin-orbit splitting
for the N aBr sample. These features could be assigned as a N aBr sample including two distinct doublets: one associated to NaBr nanocrystals and another one to Br-3d emission from gold NPs.
In order to confirm this hypothesis, the N aBr spectrum is analyzed using two model functions including one or two doublets. This is achieved using the N aBrW fit to infer the
600 400 200 0 Signal (counts) 78 76 74 72 70
Binding energy rel. to vac. level (eV)
c) NaBr sample 210 eV Br 3d Data Fit model 1 voigt1 voigt2 ln(ev2) = -702.8 ± 0.5 p2 = 100 ± 0 % 600 400 200 0 Signal (counts) b) NaBr sample 210 eV Br 3d Data Fit model 1 voigt ln(ev1) = -723.2 ± 0.7 p1 = 0 ± 0 % 1000 500 0 Signal (counts) a) NaBrWsample 210 eV Br 3d Data Fit model 1 voigt
Figure 7: Br 3d XPS spectra recorded on the N aBrW (a) and N aBr (b and c) samples
at 210 eV photon energy in high resolved mode compared to the results of the Bayesian analysis using model 1 (a, b) or model 2 (c) fit functions. The legend includes the value of the Bayesian evidence logarithms and the associated relative probabilities. The inset presents the Br 3d XPS image recorded on the N aBrW sample along with the corresponding y-profile.
natural broadening Γ of the Br 3d level. The fits reported in Figure 7. b and c are therefore performed with a fixed value of Γ = 0.78 eV deduced from Figure 7. a. This Bayesian analysis leads to the following conclusion: the model 1 is excluded due to the significantly lower value of Bayesian evidence (see the legend of Figure 7. b and c), the N aBr spectrum must include therefore two distinct components. This constitutes a direct demonstration of the unequivocal presence of Br on the gold NP surface.
Valence bands
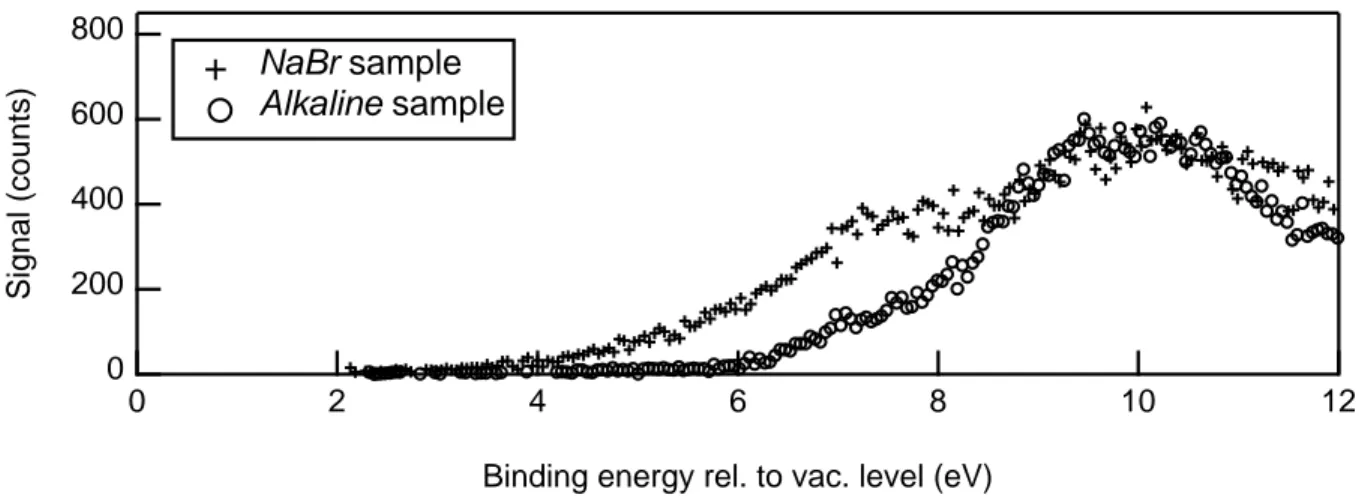
The presence of Br on the NP surface is here investigated by means of valence spectra, com-paring the results recorded on Alkaline and N aBr samples after subtraction of the residual carrier gas, solvent and NaBr nanocrystals contributions. The comparison is presented in Figure 8. 800 600 400 200 0 Signal (counts) 12 10 8 6 4 2 0
Binding energy rel. to vac. level (eV) NaBr sample
Alkaline sample
Figure 8: Valence XPS spectra recorded on the Alkaline and N aBr samples at 100 eV photon energy.
This qualitative comparison clearly evidences an important difference between the two valence bands in the EB range of 4 to 8 eV. This additional observed contribution on the
N aBr sample is a further confirmation that Br is indeed present on the NP surface. This conclusion is based on the results presented in Ref. 66. In this paper, valence band ultraviolet photoemission measurements have been performed on Au(100) single crystal surfaces where
Br had been adsorbed by solid state electrolysis of AgBr. Similar structures above Au d-bands are detected upon Br adsorption and are assigned to adsorbate induced resonances by the filled antibonding states of Br 4p .66
DFT calculations
In order to assess experimental observations, DFT periodic calculations were performed to evaluate the affinity of NPs, subject to various structural and composition changes, toward surface charge concentration, i.e. bromide salt adsorption (Na`Br´). Salt adsorption has
been explored by considering a model Au(111) free surface and other Au(111) models con-taining OH´, O2´ and Br´ oxidation species at the surface as illustrated in Figure 9.
A B
C D
Figure 9: Geometries of the NaBr salt adsorbed on the various surfaces. Au atoms are shown in grey, H in white grey, O in red, Na in blue and Br in brown.
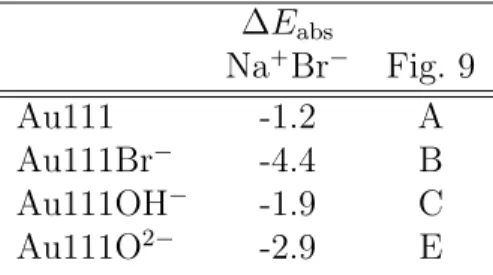
From Table 1, one observes that the salt adsorption at the free gold surface is energetically favorable, by -1.2 eV. The presence of oxidation species at the surface leads to more favorable adsorption, it reaches -2.9 eV for O2´, but surprisingly the adsorption energy becomes even more important when Br´ is at the surface (-4.4 eV). This value may be explained by the
fact that oxygen atoms are more tightly stuck to the surface as compared to Br´ which
makes the latter more receptive for the salt adsorption through binding with Na`. Indeed,
O-Au distance is 2.14 ˚A for the Au111OH´ surface and the oxygen is involved in threefold
coordination (2.19 ˚A) with Au atoms of the Au111O2´ surface; however, the Br atoms are
Table 1: Salt adsorption energies (eV) from DFT periodic calculations, computed for a free gold surface (Au111), with Br´ (Au111Br´), OH´(Au111OH´) or O2´ (Au111O2´) present
at the surface. ∆Eabs Na`Br´ Fig. 9 Au111 -1.2 A Au111Br´ -4.4 B Au111OH´ -1.9 C Au111O2´ -2.9 E
Finally, in order to confirm the presence of Na` at the surface, calculations of the
ad-sorption of one Br´ on a free gold surface Au(111) and oxidized surfaces containing OH´,
O2´ have been performed without the counterions Na`. Such processes are energetically
unfavorable; computed adsorption energies were found to be more than `4.3 eV for Br´
(see table S2 and in the same energy range for other halogen anions). This confirms the presence of the counterions Na` at the surface that should be confirmed by experimental
investigations.
Conclusion
This contribution presents a detailed chemical analysis of the first atomic layers of gold nanoparticles produced by PLAL either in pure or saline (NaBr) water. The conclusions drawn here are based on XPS measurements performed using synchrotron radiation on free-standing nanoparticles in order to avoid any substrate and radiation damage effect. These experimental results are strengthened by a prior careful sample preparation and character-ization and discussed in light of DFT calculations. According to our analysis, the sample colloid stability is highly unlikely due to a surface sample partial oxidation when produced in pure water since no oxidized gold is detected at the nanoparticle surface. In contrast, gold nanoparticles synthesized in saline water evidence a Br contribution as demonstrated by a careful analysis of Br 3d core-level and valence bands spectra. This constitutes the
to identify the origin of the colloid stability of PLAL-produced nanoparticles. However, the role of halogens must be now quantified by investigating a correlation between the Br pro-portion on the nanoparticle surface and, for instance, the NP ζ-potential. In addition, the present results opens interesting perspectives in the nanotechnology field of research since halide adsorption on metallic surfaces is known to modify the sample work function. This paves the way to metallic nanoparticles with on demand tuned work function and reinforces the attractiveness of the versatile PLAL synthesis method.
Acknowledgement
We acknowledge SOLEIL for provision of synchrotron radiation facilities and thank the PLEIADES beamline and chemistry laboratory staffs for assistance. The acknowledgements also include financial support from the Mexican Council for Science and Technology (Grant 611509) and PLAS@PAR LabEx (Cluster of Excellence in Plasmas Physics in Paris, which received financial state aid of the programme “Investissements d’avenir” under the refer-ence ANR-11-IDEX- 0004-02). MP and OV acknowledge Academy of Finland grant No. 296338 and InStreams profiling grant No. 326291. The authors thank Sandra Casale from Laboratoire de r´eactivit´e de surface for TEM measurements.
Supporting Information Available
Experimental parameters are reported in the supporting information file, as well as details on possible sources of nanoparticle surface contamination. In addition DFT calculation results investigating the role of the Na` counterion are also presented.
References
(1) Amendola, V.; Pilot, R.; Frasconi, M.; Marago, O. M.; Iati, M. A. Surface plasmon resonance in gold nanoparticles: a review. J. Phys. Condens. Matter 2017, 29, 203002. (2) Louis, C.; Pluchery, O. Gold Nanoparticles for Physics, Chemistry and Biology; World
Scientific Publishing Co Pte Ltd, 2012; pp 1–395.
(3) Sportelli, M. C.; Izzi, M.; Volpe, A.; Clemente, M.; Picca, R. A.; Ancona, A.; Lu-gara, P. M.; Palazzo, G.; Cioffi, N. The Pros and Cons of the Use of Laser Ablation Synthesis for the Production of Silver Nano-Antimicrobials. Antibiotics-Basel 2018, 7, 6794.
(4) Zhang, D.; Goekce, B.; Barcikowski, S. Laser Synthesis and Processing of Colloids: Fundamentals and Applications. Chem. Rev. 2017, 117, 3990–4103.
(5) Amendola, V.; Amans, D.; Ishikawa, Y.; Koshizaki, N.; Scir`e, S.; Compagnini, G.; Reichenberger, S.; Barcikowski, S. Room-Temperature Laser Synthesis in Liquid of Oxide, Metal-Oxide Core-Shells, and Doped Oxide Nanoparticles. Chem. Eur. J. 2020, 26, 9206–9242.
(6) Amans, D.; Cai, W.; Barcikowski, S. Status and demand of research to bring laser generation of nanoparticles in liquids to maturity. Appl. Surf. Sci. 2019, 488, 445–454. (7) Sylvestre, J.; Kabashin, A.; Sacher, E.; Meunier, M. Femtosecond laser ablation of gold in water: influence of the laser-produced plasma on the nanoparticle size distribution. Appl. Phys.A 2005, 80, 753–758.
(8) Marzun, G.; Nakamura, J.; Zhang, X.; Barcikowski, S.; Wagener, P. Size control and supporting of palladium nanoparticles made by laser ablation in saline solution as a facile route to heterogeneous catalysts. Appl. Surf. Sci. 2015, 348, 75–84.
(9) Shih, C.-Y.; Streubel, R.; Heberle, J.; Letzel, A.; Shugaev, M. V.; Wu, C.; Schmidt, M.; G¨okce, B.; Barcikowski, S.; Zhigilei, L. V. Two mechanisms of nanoparticle generation in picosecond laser ablation in liquids: the origin of the bimodal size distribution. Nanoscale 2018, 10, 6900–6910.
(10) Kanitz, A.; Kalus, M.-R.; Gurevich, E. L.; Ostendorf, A.; Barcikowski, S.; Amans, D. Review on experimental and theoretical investigations of the early stage, femtoseconds to microseconds processes during laser ablation in liquid-phase for the synthesis of colloidal nanoparticles. Plasma Sources Sci. Technol. 2019, 28, 103001–103034.
(11) Reich, S.; Letzel, A.; Menzel, A.; Kretzschmar, N.; G¨okce, B.; Barcikowski, S.; Plech, A. Early appearance of crystalline nanoparticles in pulsed laser ablation in liquids dynam-ics. Nanoscale 2019, 11, 6962–6969.
(12) Tymoczko, A.; Kamp, M.; Rehbock, C.; Kienle, L.; Cattaruzza, E.; Barcikowski, S.; Amendola, V. One-step synthesis of Fe-Au core-shell magnetic-plasmonic nanoparticles driven by interface energy minimization. Nanoscale Horizons 2019, 4, 1326–1332. (13) Streubel, R.; Bendt, G.; Goekce, B. Pilot-scale synthesis of metal nanoparticles by
high-speed pulsed laser ablation in liquids. Nanotechnology 2016, 27, 205602–205610. (14) Streubel, R.; Barcikowski, S.; Goekce, B. Continuous multigram nanoparticle synthesis
by high-power, high-repetition-rate ultrafast laser ablation in liquids. Opt. Lett. 2016, 41, 1486–1489.
(15) Zhang, D.; Liu, J.; Li, P.; Tian, Z.; Liang, C. Recent Advances in Surfactant-Free, Surface-Charged, and Defect-Rich Catalysts Developed by Laser Ablation and Pro-cessing in Liquids. ChemNanoMat 2017, 3, 512–533.
(16) Trenque, I.; Magnano, G. C.; B´arta, J.; Chaput, F.; Bolzinger, M. A.; Pitault, I.; Brian¸con, S.; Masenelli-Varlot, K.; Bugnet, M.; Dujardin, C.; ˇCuba, V.; Amans, D.
Synthesis routes of CeO2 nanoparticles dedicated to organophosphorus degradation: a benchmark. CrystEngComm 2020, 22, 1725–1737.
(17) Dittrich, S.; Kohsakowski, S.; Wittek, B.; Hengst, C.; G¨okce, B.; Barcikowski, S.; Re-ichenberger, S. Increasing the Size-Selectivity in Laser-Based g/h Liquid Flow Synthesis of Pt and PtPd Nanoparticles for CO and NO Oxidation in Industrial Automotive Ex-haust Gas Treatment Benchmarking. Nanomaterials 2020, 10, 1582–1597.
(18) Kohsakowski, S.; Streubel, R.; Radev, I.; Peinecke, V.; Barcikowski, S.; Marzun, G.; Reichenberger, S. First PEM fuel cell based on ligand-free, laser-generated platinum nanoparticles. Appl. Surf. Sci. 2019, 467-468, 486–492.
(19) Johny, J.; Guzman, S. S.; Krishnan, B.; Martinez, J. A. A.; Avellaneda Avellaneda, D.; Shaji, S. SnS2 nanoparticles by liquid phase laser ablation: Effects of laser fluence, temperature and post irradiation on morphology and hydrogen evolution reaction. Appl. Surf. Sci. 2019, 470, 276 – 288.
(20) Mateos, H.; Picca, R. A.; Mallardi, A.; Dell’Aglio, M.; De Giacomo, A.; Cio, N.; Palazzo, G. Effect of the Surface Chemical Composition and of Added Metal Cation Concentration on the Stability of Metal Nanoparticles Synthesized by Pulsed Laser Ablation in Water. Appl. Sci. 2020, 10, 4169–4180.
(21) Makino, K.; Ohshima, H. Electrophoretic Mobility of a Colloidal Particle with Constant Surface Charge Density. Langmuir 2010, 26, 18016–18019.
(22) Muto, H.; Yamada, K.; Miyajima, K.; Mafune, F. Estimation of surface oxide on surfactant-free gold nanoparticles laser-ablated in water. J. Phys. Chem. C 2007, 111, 17221–1722.
(23) Sylvestre, J.-P.; Poulin, S.; Kabashin, A. V.; Sacher, E.; Meunier, M.; Luong, J. H. T. Surface Chemistry of Gold Nanoparticles Produced by Laser Ablation in Aqueous
Me-(24) Merk, V.; Rehbock, C.; Becker, F.; Hagemann, U.; Nienhaus, H.; Barcikowski, S. In Situ Non-DLVO Stabilization of Surfactant-Free, Plasmonic Gold Nanoparticles: Effect of Hofmeister’s Anions. Langmuir 2014, 30, 4213–4222.
(25) Palazzo, G.; Valenza, G.; Dell’Aglio, M.; De Giacomo, A. On the stability of gold nanoparticles synthesized by laser ablation in liquids. J. Colloid Interface Sci. 2017, 489, 47–56.
(26) Dell’Aglio, M.; Motto-Ros, V.; Pelascini, F.; Gornushkin, I. B.; De Giacomo, A. Inves-tigation on the material in the plasma phase by high temporally and spectrally resolved emission imaging during pulsed laser ablation in liquid (PLAL) for NPs production and consequent considerations on NPs formation. Plasma Sources Sci. Technol. 2019, 28, 085017–085029.
(27) Prochazka, M.; Mojzes, P.; Stepanek, J.; Vlckova, B.; Turpin, P. Y. Probing applications of laser ablated Ag colloids in SERS spectroscopy: Improvement of ablation procedure and SERS spectral testing. Anal. Chem. 1997, 69, 5103–5108.
(28) Letzel, A.; Goekce, B.; Wagener, P.; Ibrahimkutty, S.; Menzel, A.; Plech, A.; Bar-cikowski, S. Size Quenching during Laser Synthesis of Colloids Happens Already in the Vapor Phase of the Cavitation Bubble. J. Phys. Chem. C 2017, 121, 5356–5365. (29) Letzel, A.; Reich, S.; dos Santos Rolo, T.; Kanitz, A.; Hoppius, J.; Rack, A.;
Olbi-nado, M. P.; Ostendorf, A.; G¨okce, B.; Plech, A.; Barcikowski, S. Time and Mechanism of Nanoparticle Functionalization by Macromolecular Ligands during Pulsed Laser Ab-lation in Liquids. Langmuir 2019, 35, 3038–3047.
(30) Siskova, K.; Vlckova, B.; Turpin, P. Y.; Fayet, C. Ion-specific effects on laser ablation of silver in aqueous electrolyte solutions. J. Phys. Chem. C 2008, 112, 4435–4443. (31) Pfeiffer, C.; Rehbock, C.; H¨uhn, D.; Carrillo-Carrion, C.; Jimenez de Aberasturi, D.;
local environment: the (ionic) nanoenvironment around nanoparticles is different from bulk and determines the physico-chemical properties of the nanoparticles. J. R. Soc. Interface. 2014, 11, 20130931–20130943.
(32) De Anda Villa, M. et al. Assessing the Surface Oxidation State of Free-Standing Gold Nanoparticles Produced by Laser Ablation. Langmuir 2019, 35, 11859–11871.
(33) Papagiannouli, I.; Patanen, M.; Blanchet, V.; Bozek, J. D.; de Anda Villa, M.; Huttula, M.; Kokkonen, E.; Lamour, E.; Mevel, E.; Pelimanni, E.; Scalabre, A.; Trassinelli, M.; Bassani, D. M.; L´evy, A.; Gaudin, J. Depth Profiling of the Chemical Composition of Free-Standing Carbon Dots Using X-ray Photoelectron Spectroscopy. J. Phys. Chem. C 2018, 122, 14889–14897.
(34) Fong, Y.-Y.; Gascooke, J. R.; Visser, B. R.; Harris, H. H.; Cowie, B. C. C.; Thomsen, L.; Metha, G. F.; Buntine, M. A. Influence of Cationic Surfactants on the Formation and Surface Oxidation States of Gold Nanoparticles Produced via Laser Ablation. Langmuir 2013, 29, 12452–12462.
(35) Ziefuß, A. R.; Haxhiaj, I.; M¨uller, S.; Gharib, M.; Gridina, O.; Rehbock, C.; Chakraborty, I.; Peng, B.; Muhler, M.; Parak, W. J.; Barcikowski, S.; Reichenberger, S. Origin of Laser-Induced Colloidal Gold Surface Oxidation and Charge Density, and Its Role in Oxidation Catalysis. J. Phys. Chem. C 2020, 124, 20981–20990.
(36) Wang, X.; McMurry, P. H. A design tool for aerodynamic lens systems. Aerosol Sci. Technol. 2006, 40, 320–334.
(37) Martial, I.; Balembois, F.; Didierjean, J.; Georges, P. Nd: YAG single-crystal fiber as high peak power amplifier of pulses below one nanosecond. Opt. Express 2011, 19, 11667–11679.
High-Intensity Nanosecond Pulses is Driven by a Single-Step Fragmentation Mechanism with a Defined Educt Particle-Size Threshold. J. Phys. Chem. C 2018, 122, 22125– 22136.
(39) Werner, D.; Hashimoto, S. Improved Working Model for Interpreting the Excitation Wavelength- and Fluence-Dependent Response in Pulsed Laser-Induced Size Reduction of Aqueous Gold Nanoparticles. J. Phys. Chem. C 2011, 115, 5063–5072.
(40) Sakaki, S.; Ikenoue, H.; Tsuji, T.; Ishikawa, Y.; Koshizaki, N. Pulse-Width Dependence of the Cooling Effect on Sub-Micrometer ZnO Spherical Particle Formation by Pulsed-Laser Melting in a Liquid. ChemPhysChem 2017, 18, 1101–1107.
(41) Tsuji, T.; Higashi, Y.; Tsuji, M.; Ishikawa, Y.; Koshizaki, N. Preparation of submicron-sized spherical particles of gold using laser-induced melting in liquids and low-toxic stabilizing reagent. Appl. Surf. Sci. 2015, 348, 10–15.
(42) Wagner T (2016) ij-particlesizer: ParticleSizer 1.0.1. Zenodo.
(43) Letzel, A.; Goekce, B.; Menzel, A.; Plech, A.; Barcikowski, S. Primary particle diame-ter differentiation and bimodality identification by five analytical methods using gold nanoparticle size distributions synthesized by pulsed laser ablation in liquids. Appl. Surf. Sci. 2018, 435, 743–751.
(44) Lindblad, A.; Soederstroem, J.; Nicolas, C.; Robert, E.; Miron, C. A multi purpose source chamber at the PLEIADES beamline at SOLEIL for spectroscopic studies of isolated species: Cold molecules, clusters, and nanoparticles. Rev. Sci. Instrum. 2013, 84 .
(45) LiuU, P.; Ziemann, P.; Kittelson, D.; MCMurry, P. Generating particle beams of con-trolled dimensions and divergence .1. Theory of particle motion in aerdynamic lenses and nozzle expansion. Aerosol Sci. Tech. 1995, 22, 293–313.
(46) LiuU, P.; Ziemann, P.; Kittelson, D.; MCMurry, P. Generating particle beams of con-trolled dimensions and divergence .2. Experimental evaluation of particle motion in aerodynamic lenses and nozzle expansions. Aerosol Sci. Tech. 995, 22, 314–324. (47) Cumpson, P.; Seah, M. Elastic scattering corrections in AES and XPS .2. Estimating
attenuation lengths and conditions required for their valid use in overlayer/substrate experiments. Surf. Interface Anal. 1997, 25, 430–446.
(48) Shard, A. G.; Wang, J.; Spencer, S. J. XPS topofactors: determining overlayer thickness on particles and fibres. Surf. Interface Anal. 2009, 41, 541–548.
(49) Antonsson, E.; Patanen, M.; Nicolas, C.; Neville, J. J.; Benkoula, S.; Goel, A.; Miron, C. Complete Bromide Surface Segregation in Mixed NaCl/NaBr Aerosols Grown from Droplets. Phys. Rev. X 2015, 5, 011025–011031.
(50) Kikas, A.; Osborne, S.; Ausmees, A.; Svensson, S.; Sairanen, O.; Aksela, S. High-resolution study of the correlation satellites in photoelectron spectra of the rare gases. J. Electron Spectros. Relat. Phenomena 1996, 77, 241–266.
(51) Trassinelli, M. Bayesian data analysis tools for atomic physics. Nucl. Instrum. Methods Phys. Res. 2017, 408, 301–312.
(52) Trassinelli, M. The Nested fit Data Analysis Program. Proceedings 2019, 33, 14–21. (53) Trassinelli, M.; Ciccodicola, P. Mean Shift Cluster Recognition Method Implementation
in the Nested Sampling Algorithm. Entropy 2020, 22, 185.
(54) Bagus, P.; Pacchioni, G. Core-level binding-energy shifts due to ionic adsorbates. Phy. Rev. B 1993, 48, 15262–15273.
(55) Zschornack, G. Handbook of X-Ray Data; Springer Berlin Heidelberg, 2007.
(57) Kresse, G.; Furthm¨uller, J. Efficient iterative schemes for ab initio total-energy calcu-lations using a plane-wave basis set. Phys. Rev. B 1996, 54, 11169–11186.
(58) Bl¨ochl, P. E. Projector augmented-wave method. Phys. Rev. B 1994, 50, 17953–17979. (59) Kresse, G.; Joubert, D. From ultrasoft pseudopotentials to the projector
augmented-wave method. Phys. Rev. B 1999, 59, 1758–1775.
(60) Perdew, J. P.; Burke, K.; Ernzerhof, M. Generalized Gradient Approximation Made Simple. Phys. Rev. Lett. 1996, 77, 3865–3868.
(61) Perdew, J. P.; Burke, K.; Ernzerhof, M. Generalized Gradient Approximation Made Simple [Phys. Rev. Lett. 77, 3865 (1996)]. Phys. Rev. Lett. 1997, 78, 1396–1396. (62) Rong, C.; Jiliang, W.; Hui, L.; Gang, C.; Zhong, L.; Chi-Ming, C. Fabrication of gold
nanoparticles with different morphologies in HEPES buffer. Rare metals 2010, 29, 180–186.
(63) Ziefuss, A. R.; Reich, S.; Reichenberger, S.; Levantino, M.; Plech, A. In situ structural kinetics of picosecond laser-induced heating and fragmentation of colloidal gold spheres. Phys. Chem. Chem. Phys. 2020, 22, 4993–5001.
(64) Neugebauer, J.; Scheffler, M. Adsorbate-substrate and adsorbate-adsorbate interactions of Na and K adlayers on Al(111). Phys. Rev. B 1992, 46, 16067–16080.
(65) Tchaplyguine, M.; Mikkel¨a, M.-H.; Zhang, C.; Andersson, T.; Bj¨orneholm, O. Gold Oxide Nanoparticles with Variable Gold Oxidation State. J. Phys. Chem. C 2015, 119, 8937–8943.
(66) Netzer, F.; Wille, R.; Grunze, M. Ultraviolet Photoemission of bromine adsorbed on Au(100). Solid State Commun. 1980, 36, 159–163.
Graphical TOC Entry
XPS: Br 3d core level
Halide adsorption on gold nanoparticles