Carbon Footprint Measurement and Analysis of a Multi-Modal Logistics
Network
by Adam J. Miller
B.S. Mechanical Engineering Technology, Purdue University, 2007
Submitted to the MIT Sloan School of Management and the Department of Mechanical Engineering in Partial Fulfillment of the Requirements for the Degrees of
Master of Business Administration and
Master of Science in Mechanical Engineering MASSACHUSETT'S INS ME In conjunction with the Leaders for Global Operations Program at the
Massachusetts Institute of Technology
JUN 18 2014
June 2014
LIBRARIES
© 2014 Adam J. Miller. All rights reserved.The author hereby grants to MIT permission to reproduce and to distribute publicly paper and electronic copies of this thesis document in whole or in part in any medium now known or hereafter created.
Signature redacted
Signature of AuthorMIT Sloan School of Management, MIT Deparpent of Mechanical Engineering
Signature redacted
May9,2014Certified by
Timothy G. Gutowski, Thesis Supervisor Professor, MIT Department of Mechanical Engineering
Signature redacted
Certified by
T
Jay, Thesis Supervisor
Lecturer an School of Management Directo;V ainablity itijyve at.Mj Tloan
Signature redacted
Accepted by
David E. Hardt, Chairman, Committee on Graduate Students Department of Mechanical Engineering
Signature redacted
Accepted by
Carbon Footprint Measurement and Analysis of a Multi-Modal Logistics
Network
by Adam J. Miller
Submitted to the MIT Sloan School of Management and the Department of Mechanical Engineering on May 9, 2014 in Partial Fulfillment of the Requirements for the Degrees of Master of Business
Administration and Master of Science in Mechanical Engineering
Abstract
General Motors (GM) is one of the world's largest automobile manufacturing companies and does business in over 120 countries, requiring a complex operations network. Operating with a focus on environmental impact has become a strategic pillar within the company, both in its products and in its supply chain. Specifically, the GM global logistics organization is driving toward greater emissions visibility and the identification of carbon dioxide reduction opportunities within its network.
Key objectives of this thesis work include creating business tools and processes to record global logistics emissions data, which will allow GM to more accurately report logistics emissions and reduction efforts to shareholders, track network emissions over time, pinpoint carbon reduction opportunities that align with cost savings efforts, and understand and mitigate future risks to the business.
The approach taken to address the above objectives unfolds into three distinct work streams: (1) implementation of industry-recognized methods and processes, (2) development of a global carbon footprint measurement model, and (3) emissions analysis of network change activities.
Industry research and data analysis along with internal cost and network data were used to develop carbon measurement tools. These tools are capable of estimating mass emissions (tons C02) generated by logistics operations globally as well as the increase or decrease in mass emissions generated by individual network change events (e.g., changes in mode, mileage, shipment frequency, etc.). Furthermore, through close collaboration with logistics providers, GM fulfilled the necessary requirements to become an official shipper partner of the USEPA SmartWay program.
Immediate benefits of the project work include using the resulting data for global reporting and benchmarking purposes, providing management with a new set of information that can be used to strengthen network change proposals, and tracking improvements in overall network emissions as well as the performance of individual providers. Long term benefits include stronger relationships with providers, reputational and governmental risk mitigation, and cost savings from increased fuel efficiency of operations.
Acknowledgments
I would first like to thank everyone at General Motors who helped make this research fellowship a success, starting with my supervisors Jeffrey Morrison and Elliot Swiss, who provided guidance and support for both my work and my professional development within the Global Purchasing and Supply Chain Organization. I am also grateful to David Tulauskas, a forward-thinking leader in sustainability at GM, with whom I met weekly to discuss progress and direction of my research. Furthermore, I wish to acknowledge the steering committee comprised of GM leaders who oversaw and gave helpful input to my work on a monthly basis. In addition to those mentioned above, members of the steering committee included Edgard Pezzo, Bill Hurles, Bryan Burkhardt, Grace Overlander, Al Hildreth, Doug Ravas, Jorge Arinez, Levon Hachigian, Mari Kay Scott, Alex Burnett, Nate Lawson, Vince Kretschmer, Leon Pozen, Colin Dill, and Mike Rhadigan.
Without the help of trusted partners of GM, significant outcomes of this work could not have been achieved. Therefore, great thanks goes to the teams at Ryder System Inc., Penske Corporation, Maersk Line, DSV, FedEx, Union Pacific Railroad, and the U.S. Environmental Protection Agency.
I would like to thank my MIT advisers Jason Jay and Timothy Gutowski for their academic perspective and guidance throughout my research and thesis preparation. With strong influences provided by Professor Jay's action-oriented sustainability focus and Professor Gutowski's carbon and life cycle analysis expertise, the results of this work are both practical and credible. Also, both advisers were
instrumental in helping me apply research findings in an industry setting.
Finally, I would like to thank my wife Grace for her encouragement and unending support, which continues to be my greatest source of motivation. Over the two years spent at MIT, Grace and I made many lifelong friends, shared countless new experiences, and welcomed our first child Alex into the world, which has made my grad school experience far more enriching and memorable that I could have ever envisioned.
Table of Contents
Abstract... 3
Acknow ledgm ents... 5
Table of Contents...7
List of Figures... 10
List of Equations ... 11
1 Introduction... 12
1.1 Background and M otivation... 12
1.2 Purpose of Research... 13
1.3 Overview of Approach... 13
1.4 Research M ethodology ... 14
2 Literature Review and Industry Research... 15
2.1 Corporate Sustainability... 15
2.1.1 Global W arm ing and Energy Consum ption... 16
2.1.2 Profitable Sustainability... 18
2.1.3 Additional M otivation for Corporate Sustainability ... 18
2.2 Logistics Carbon Footprint... 19
2.2.1 M IT CTL and the Environm ental Defense Fund ... 19
2.2.2 Em issions M easurem ent M ethods... 21
3 Logistics Carbon Footprint Initiative at General M otors ... 24
3.1 Objectives ... 24
3.2 Scope of Research...24
3.2.1 Included...25
3.2.2 Excluded ... 25
3.3.1 Com petition...27
3.4 Approach: Evaluating Emissions of a Complex, Global Logistics Network ... 27
3.4.1 Attem pting a Single G lobal Approach... 27
3.4.2 A Tripartite Solution ... 32
4 Environm ental Industry Group Participation... 34
4.1 Environm ental Industry Group Selection ... 34
4.2 U SEPA Sm art W ay Transport Partnership ... 35
4.2.1 M ethods and Tools... 35
4.3 Process to Onboard General Motors as a SmartWay Shipper Partner ... 41
4.4 Results... 41
4.5 D iscussion ... 42
5 G lobal Em issions M easurem ent M odel... 45
5.1 M ethodology ... 45
5.2 M odel Inputs ... 46
5.2.1 Environmentally-Extended Input Output Emissions Factors... 46
5.2.2 Logistics Spend by M ode of Transportation... 48
5.2.3 Analysis of Inputs ... 49
5.3 M odel Outputs ... 50
5.3.1 Sensitivity of Outputs... 51
5.4 Results... 51
6 N etwork Change Analysis ... 56
6.1 Building a Carbon Change M odel for Logistics ... 56
6.1.1 M odel Inputs ... 60
6.1.2 M odel Outputs ... 61
6.2 Results...62
7.1 Key Findings ... 64
7.1.1 Global Emissions Reporting ... 65
7.1.2 Logistics Provider Relationships and Sourcing Decisions...65
7.1.3 Cost Reduction Reinforcement... 66
7.1.4 Risk Reduction ... 66
7.2 Recommendations and Future Development... 67
8 A ppendix ... 69
8.1 Media Coverage Report for GM-SmartWay Partnership...69
List of Figures
Figure 1: Historical Levels of Greenhouse Gasses (C02, N20, CH4) [4]... 16
Figure 2: End-Use Sector of Total Energy Consumption, 2011 [7] ... 17
Figure 3: Triple Bottom Line M odel... 18
Figure 4: Top Factors Contributing to CEO Action on Sustainability Integration [10] ... 19
Figure 5: Industry Group Participation and Employed Framework for Carbon Footprint Measurement of Key GM Logistics Partners Serving North America ... 28
Figure 6: Current Global Freight Transportation Emissions Reduction (a.k.a "Green Freight") Efforts [18] ... 3 1 Figure 7: Information Flow of the SmartWay Shipper Tool... 36
Figure 8: C02 Emissions Factors (EF) by Fuel Type (assumes 100% combustion) [19]... 37
Figure 9: Sample of Carrier Performance Data Adapted from SmartWay Website [20]... 38
Figure 10: Example of SmartWay Shipper Activity Data Entry... 39
Figure 11: Home-Screen Menu of SmartWay Shipper Tool [21]... 40
Figure 12: Summary of 2012 Reporting Year SmartWay Shipper Tool Submission for GM...42
Figure 13: Components of a Complex International Shipment ... 45
Figure 14: EEIO Emissions Factors for Reporting Ocean Carriers ... 47
Figure 15: Outlier Analysis of EEIO Emissions Factors for Ocean Transportation... 47
Figure 16: Average EEIO Emissions Factors by Mode ... 48
Figure 17: Regional Logistics Spend by Mode of Transportation (SR,M), 2012...-... -... 48
Figure 18: Mass Emissions (Eco2) of GM's Global Logistics Network, 2012... 51
Figure 19: GM Global Logistics: Relative GHG Emissions by Region ... 52
Figure 20: GM Global Logistics: Relative GHG Emissions by Mode ... 52
Figure 22: C02 Emitted by Source: GM Production Operations [source: GM Energy Management Team]
... 5 5
Figure 23: Components and Influences on Logistics Cost and C02 Emissions ... 57
Figure 24: Natural Gas Consumption in the Transportation Sector, 1995 - 2040 [24]... 58
Figure 25: Activity-based Emissions Factors by Mode (EFM) ... 61
Figure 26: C02 and Cost Savings for ~800 GMNA Inbound Network Change Initiatives ... 62
Figure 27: Correlation of Emissions Change vs. Cost Savings for GMNA Inbound Logistics Network C hange Initiatives ... 63
Figure 28: The Virtuous Cycle of Organizational Efficiency [29] ... 67
List of Equations
Equation 1: C02 Calculation based on Fuel Consumption [19]... 37Equation 2: SmartWay Shipper Partner Mass Emissions Calculation [22] ... 40
Equation 3: EEIO Emissions Factor Calculation for a Carrier Company... 46
Equation 4: Mass Emissions as Calculated by EEIO Method ... 50
1
Introduction
General Motors (GM) is one of the world's largest automobile manufacturing companies and does business in over 120 countries, requiring a complex operations network. The company operates in four distinct regions: North America (GMNA), Europe (GME), South America (GMSA), and Asia and rest of world, which is referred to as International Operations (GMIO). Operating with a focus on environmental impact has become a strategic pillar within the company, both in its products and in its supply chain. Dan Akerson, GM's Chairman and CEO during the time of our study, was quoted in the company's annual sustainability report saying, "Our sustainability strategy is guided by this simple truth: energy diversity, resource conservation and C02 reduction are business imperatives [1]." Specific to our study, the GM global logistics organization is driving toward greater emissions visibility and the identification of carbon dioxide reduction opportunities within its network.
1.1
Background and Motivation
Recently, executives within the GM logistics organization have been stressing cost reduction as a critical business priority. The team has prided itself on waste elimination, which was a key contributor to cost savings in 2013 and will continue to drive savings in the future. In addition, the executive team has provided sound leadership in guiding the organization to deliver on cultural priorities such as nurturing strategic relationships with logistics providers and focusing on the total enterprise cost of doing business. Through network optimization, route analysis, production facility waste walks, and countless other studies and analyses, the logistics team has been able to save millions of dollars while continuing to provide superb customer satisfaction.
But it's not only dollars that are being saved. The team is also helping decrease damage to the environment by reducing GM's carbon footprint, creating further value for customers. Paying attention to carbon footprint can help achieve business and cultural goals. This has been exemplified at competing auto manufacturers such as Ford, who is actively reporting and reducing its carbon footprint by working
hand-in-hand with logistics providers on network optimization and emissions-related reduction activities and investments. In addition, the Fiat Group (Chrysler) employs a logistics sustainability team that has partnered with the United States Environmental Protection Agency's (USEPA) SmartWay program (see
2.2.2.2) to track and reduce logistics carbon emissions, leading the automaker to work with only the most
efficient carriers. In Europe, by prioritizing rail transport, BMW has secured long-term rail arrangements with its partners. These firms don't hesitate to promote their efforts. The GM Logistics team is doing some of the very same things operationally that its competitors are; however, there are two key differences. First, GM Logistics has not highlighted its environmental successes well in the past and must do a better job of this going forward. Second, the team is missing out on business benefits that can be achieved by looking at their operations through a sustainability lens. GM can gain a competitive advantage through sustainability initiatives that strengthen provider relationships, reduce long-term costs, and reduce business risk.
1.2
Purpose of Research
The purpose of our research is to develop an approach for GM to measure and analyze its logistics carbon footprint in order to drive business value by instituting simple, low-resource processes. This will allow the organization to win on more than just cost. GM has a prime opportunity to lead all major automakers in operating the most efficient, lowest-cost, and most environmentally responsible logistics network; the team is working hard to win in the first two categories, and our research, recommendations, and deliverables will help them with the third. We will achieve this by enabling GM logistics to report logistics emissions, take action on emissions data, and champion sustainability in logistics.
1.3
Overview of Approach
Globally and regionally, the logistics group needs to formalize its emissions reporting and tracking. To do this globally is very complex, but we create a simplified process that can be used to estimate total emissions and concentrate on reduction year-over-year. Global tracking would be considered a pioneer
effort in the industry. Regionally, an internal method and process for detailed carbon footprint analysis is difficult without a dedicated team in logistics, therefore we pursue an externally-based,
industry-recognized solution. We endorse and establish a partnership with the USEPA SmartWay program in conjunction with third party logistics (3PL) partners that will allow GM to see specific data on the emissions output of its carrier network with minimal resource investment.
Once the data and reporting is established, the company can use it as a powerful business tool and take action. GM can ask providers and carriers key questions about emissions reduction and efficiency, and asking such questions can lead to more optimization opportunities, technology investment, and carrier improvements in fuel consumption. In addition, management can leverage this new information as another data point in carrier sourcing, ensuring only the best, most efficient carriers are used. We highlight these opportunities to management through our conclusions and recommendations.
Finally, the logistics team has the opportunity to champion sustainability within the organization. Our work will allow employees to take credit for current efforts by using carbon calculation tools to convert cost-saving network changes into carbon savings. The ability to view cost-savings work in a new light will provide additional workplace motivation and help to impart a cultural change that encourages employees to think about each situation through a sustainability lens no matter what the job is.
1.4 Research Methodology
Our work reflects efforts to solve a problem for GM, an auto industry giant. Although the data and organizational descriptions are unique to GM, our research methodology is intended to provide an framework that can be applied to any company seeking to undertake a large-scale multi-modal carbon footprint measurement initiative for its logistics organization. Furthermore, not only does our work address the mechanics of how a logistics organization can measure its carbon emissions, but we also describe ways to use emissions data to take action and realize the business benefits of increased network efficiency.
2 Literature Review and Industry Research
This chapter gives an overview of various works that were used to both clarify the problem and motivation as well as provide a foundation for our approach. While the review is broad in scope, it is intended to be a holistic, yet concise, preamble for anyone attempting to introduce carbon footprint measurement and analysis into a logistics organization.
2.1
Corporate Sustainability
Sustainability initiatives within corporations have become more popular in recent years for a number of reasons. One major contributor to this trend comes from the increased level of attention that has been given to serious environmental topics such as global warming and resource conservation. Environmental concerns have been discussed for decades, but have recently sparked to heightened public attention with the help of activists such as Al Gore, whose campaign to educate citizens about the severity of such issues was featured in the 2006 documentary An Inconvenient Truth. These types of public awareness campaigns, along with recent natural disasters that seemingly support activist claims, have put the spotlight on pollution. Especially targeted are businesses and corporations, who are typically viewed as major contributors to global warming, resource depletion, and environmental waste.
Evidence of global warming, combined with internal and external pressure to take responsibility for environmental impact, has led major companies to take action toward reversing climate change trends. These actions may be as modest as tracking energy consumption internally, or as assertive as taking a public stance toward supporting climate change mitigation efforts. For example, in 2009, both Nike and Apple made strong statements by vacating their memberships within the U.S. Chamber of Commerce due to opposing views on climate change. Specifically, the firms vacated because the Chamber was not in support of the Waxman-Markey bill, which would have placed a cap-and-trade system on greenhouse gasses in the United States [2][3].
With increased publicity on the topic of corporate sustainability, individual citizens have become more passionate about resource conservation, waste reduction, and repurposing materials. These citizens comprise the human resources that drive business practices, so it is no surprise that product life cycle planning and waste elimination initiatives have sprung up in many corporations.
2.1.1 Global Warming and Energy Consumption
Understanding the importance of sustainable business practices related to greenhouse gas emissions begins with a brief introduction of global warming. Greenhouse gases, such as carbon dioxide (C02), Methane (CH4), and Nitrous Oxide (N20) exist naturally in Earth's atmosphere, but due to human activities such as burning fossil fuels to produce energy and increasing agricultural activity, mass quantities of these gases have been unnaturally released into the atmosphere over the past 200 years. This contributes to the "greenhouse effect," a phenomenon in which a blanket of greenhouse gases trap heat within earth's atmosphere. Figure 1 below indicates a startling increase in the amount of greenhouse gasses measured in the atmosphere beginning around the industrial revolution through 2005. Essentially, as soon as humans began conducting large scale business and began burning fossil fuels to meet increasing energy demands, greenhouse gas emissions began to increase at a highly accelerated rate.
400... .2000
1800
-. - Carbon Dioxide (CO2
-- Methane (CH4) 1600 350 - Nitrous Oxide (N2O) .. 1400
-:1
1200 0 300--1000 800 0 500 1000 1500 2000 YearAccording to the Intergovernmental Panel on Climate Change (IPCC), the increase of greenhouse gases has been scientifically linked to a steady increase in global mean surface temperature at rate of 0. 12*C per decade from 1951-2012 [5]. If this trend continues, it could have hugely negative implications including drastic changes to weather patterns, rise of sea levels, and intense risk to the economy, human health, and infrastructure.
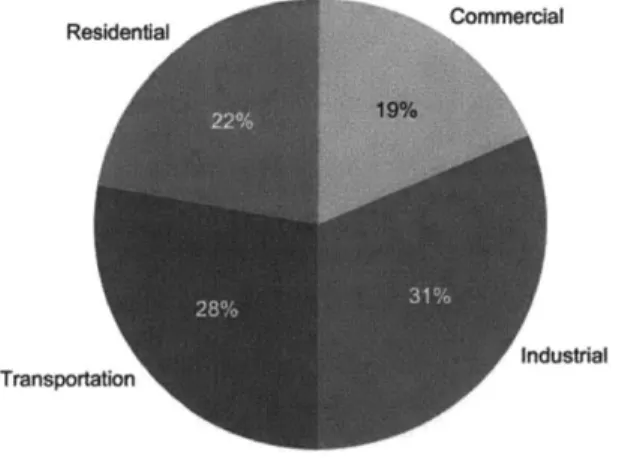
As stated previously, the increased rate of global warming appears to be a direct result of humans' consumption of energy, specifically energy created by burning fossil fuels. Figure 2 illustrates the breakdown of energy consumption in the United States. Corporate operations consume energy in three of the four major consumption categories and account for 100 percent of the commercial and industrial categories. In addition, logistics and freight operations make up approximately 30 percent of the energy used for transportation, the balance of which is associated with passenger transportation [6]. Transportation energy consumption is especially relevant to an automotive OEM such as GM, since its products contribute to both freight and passenger-use consumption components. In an effort to reduce energy consumption and carbon dioxide emissions, corporations have been under pressure to become more environmentally sustainable.
Transportation Industrial
2.1.2 Profitable Sustainability
In response to the growing concern of global warming, among other social and environmental concerns, businesses have begun to make changes to the way they operate. For some businesses, the pursuit of sustainability is solely to demonstrate social responsibility, and they implement changes without much hope of financial benefits [8]. However, many businesses are charting new routes in profitable sustainability. The ideal state in which corporations can intelligently make changes to their operations to (1) improve the environment, (2) manage human resources more responsibly, and (3) make a profit has been referred to as achieving a "Triple Bottom Line" [9], illustrated in Figure 3. Sustainability initiatives with the potential to be profitable are far more persuasive and likely to be approved by senior leaders who must face cost-cutting pressures. This concept was incredibly important to keep in mind as we formulated our approach for GM.
Figure 3: Triple Bottom Line Model
2.1.3 Additional Motivation for Corporate Sustainability
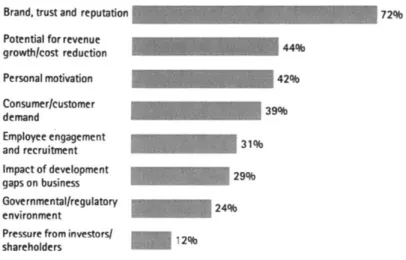
A number of other motivating factors have been pushing corporations toward reducing their environmental footprint. A survey conducted by consulting firm Accenture of 766 CEOs worldwide
identified the top factors contributing to action on integrating sustainability strategies into their businesses. The results can be seen in Figure 4.
Brand, trust and reputation 72%
Potential for revenue growth/cost reduction Personal motivation 42% Consumer/customer 39% demand Employee engagement 31% and recruitment Impact of development 29% gaps on business Governmental/regulatory 24% environment
Pressure from investors/ 12%
shareholders
Figure 4: Top Factors Contributing to CEO Action on Sustainability Integration [101
2.2 Logistics Carbon Footprint
Reducing the carbon emissions associated with logistics operations can be done in several ways. Companies may choose to solely focus on optimizing their logistics networks, while others may choose to invest in fuel-saving technology for their freight transport equipment. Regardless of what method is chosen, one must first generate a baseline measurement of emissions in order to track and measure improvements over time. Our initial research led to a few significant findings that helped shape our approach at GM. These findings are summarized below.
2.2.1 MIT CTL and the Environmental Defense Fund
Research performed by the MIT Center for Transportation and Logistics (CTL) and sponsored by the EDF suggests that a strong focus on optimizing logistics networks can lead to greater carbon efficiency. Collaborating with logistics providers as well as competitors to generate creative transportation solutions is one way to achieve this goal. Applying this concept, agricultural cooperative Ocean Spray gained
significant logistics efficiencies by partnering with one of its competitors [11]. Jason Mathers, an expert in supply chain and logistics at EDF, concluded,
"Ocean Spray has shown that concrete and measurable sustainability results can be found within projects that were previously identified for cost savings only. We encourage
all companies who identify cost cutting opportunities within their logistics operations to also calculate potential emissions reductions to add greater overall value to their organizations."
We agree with Mr. Mathers in his assessment and also recognize that by quantifying emissions reductions associated with the numerous network change initiatives identified for cost-savings at GM, the company can yield greater value from its efforts. This concept is a major driver in our network change analysis process implementation and results discussed in Chapter 6.
The MIT CTL has dedicated multiple research initiatives to advance sustainability efforts in logistics operations and supply chains. In addition to the study mentioned above, two other works influenced the approach for our work with GM: "The Value of Detailed Logistics Information in Carbon Footprints"
[12] and "System Dynamics Modeling of the SmartWay Transport Partnership" [13].
First, the research paper entitled "The Value of Detailed Logistics Information in Carbon Footprints" provides a comparison of estimating, or screening, the carbon emissions associated with a product's logistics operations. The study compares results of calculating logistics-related carbon emissions using public information versus using actual, detailed information from the 3PL provider managing the shipment of the products. Public information included road distances and ocean distances calculated from online map tools, mass emissions factors published by the GHG Protocol (see section 2.2.2.1), and port emissions published by the Port of Seattle. Detailed information included specifics on carriers, ocean routes, ports of call, truck road distances, warehouse emissions factors, and in some cases actual fuel consumption of equipment. The study proceeds to compare the emissions calculation from a 'screening
model' (based on public information) to a presumably more accurate 'detailed model' (based on actual activity data) for products transported by five different global logistics networks. The results of the study show misalignment and variation between the two methods of calculation. In some instances, the detailed model suggests lower emissions than the screening model, and in some instances, the opposite is true. The results of the comparison study are beneficial for our work at GM as they reinforce the preference for using activity-based data when calculating emissions in logistics.
Second, the paper entitled "System Dynamics Modeling of the SmartWay Transport Partnership" provides deep insights into the USEPA SmartWay Transport Partnership. The work includes detailed system dynamics models of stakeholder interactions and factors driving the SmartWay program's success. While evaluating potential solutions for measuring the carbon footprint of GM's logistics network, this work from the CTL was helpful in providing further clarification of the benefits of becoming a SmartWay shipper partner.
2.2.2 Emissions Measurement Methods
For those attempting to measure carbon emissions produced by a corporation, the first question often is, which method should be employed? Countless methods and models exist for measuring emissions from operations and supply chains, including freight transportation and logistics. These methods have been published by all levels of governments around the world (national, regional, and local) as well as by individual companies and industry groups. A quick internet search for 'greenhouse gas measurement methods' will provide evidence for this claim. Despite the growing popularity of emissions management, no single method has emerged as a universal standard. This is because few countries, including the United States, have not yet mandated the practice of reporting GHG inventories for municipalities and corporations. On the other hand, some individual countries have created mandates for GHG reporting, driving the use of specific methods for quantifying such emissions. An example of this is France and its Decree n' 2011-1336.
Through the course of this research, we studied numerous methodologies for measuring GHG emissions in logistics operations. The following sections describe three groups that stand out as leaders in carbon emissions measurement and analysis. The fundamentals of their methodologies have provided a solid foundation for our work.
2.2.2.1 Greenhouse Gas (GHG) Protocol
The GHG Protocol is recognized as one of few globally-used accounting tools for measurement of greenhouse gases. The protocol outlines three primary source types, called scopes, of emissions for a reporting organization [14]. In our case, GM is considered to be the reporting organization. Scope 1 emissions are those created as a result of the reporting organization consuming primary fuel sources on-site within its owned assets. An example of Scope 1 emissions for GM would be C02 generated by burning natural gas to heat facilities. Scope 2 emissions are those that are created by an outside organization but consumed directly by the reporting organization. An example of Scope 2 emissions is C02 created by power plants that produce electricity for GM-owned buildings. Scope 3 emissions are those created by outside organizations in order to provide a purchased good or service to the reporting organization. Emissions created by contracted logistics services, the focus of our research, are considered Scope 3. As GM does not operate its own logistics fleet, we do not need to focus on any Scope 1 generated emissions. The GHG Protocol and its Scope 3 calculations guidance is essential to understanding how to evaluate carbon emissions within a logistics network.
2.2.2.2 USEPA SmartWay Transport Partnership
The SmartWay Transport Partnership is a public-private collaboration between the United States Environmental Protection Agency and the freight transportation industry. It was started in 2004 and its primary goal is to reduce the amount of carbon emissions produced by transporting materials and finished goods, thus creating more efficient logistics networks [15]. Through our research, we have concluded that the program's tools and methods are best-in-class for truck and rail freight transportation networks. As a result of our work, GM logistics has joined SmartWay. We explore this program in detail in Chapter 4.
2.2.2.3 Carbon Disclosure Project (CDP)
CDP is an international organization that provides an information sharing platform for companies and cities to disclose carbon emissions. It holds the largest set of climate change data globally, which can be used to support strategic business and policy decisions with regards to environmental impact [16]. GM is a current member of CDP's supply chain program, which requires annual reporting of global emissions data. Building on existing efforts, our work has enhanced GM's external reporting processes to organizations such as CDP.
3
Logistics Carbon Footprint Initiative at General Motors
Proposed by executives within GM's logistics, sustainability, and energy management organizations, the idea for the logistics carbon footprint initiative was conceived to add business value and achieve greater alignment with the company's overall sustainability strategy. Though multiple sustainability initiatives had been pursued with regards to GM's products, facilities, and supply chain (sourcing of material), minimal and unstructured effort had been given to understanding and reporting the environmental impact of its global logistics network. The project was loosely defined at first, as the company chose to leverage its partnership with the MIT Leaders for Global Operations program to lead the research effort.
3.1 Objectives
Desired outcomes of this research are:
1) Create a recommendation for GM to implement a global method for measuring and reporting carbon footprint for inbound and outbound logistics operations.
2) Design business processes for capturing and reporting carbon footprint data from logistics providers, allowing GM to:
* Accurately report emissions and reduction efforts to shareholders
* Track network emissions over time
* Pinpoint carbon reduction opportunities and align with cost reduction efforts
* Understand future risks to the business
3) Work with GM's sustainability team to integrate our project into the overall company strategy.
3.2 Scope of Research
A clearly defined scope of work is imperative to successfully achieving our objectives. In sustainability and emissions measurement initiatives, defining a scope (or boundary) can greatly alter results. For example, when quantifying logistics emissions, whether or not empty miles (the required
miles traveled by a freight vehicle when it does not contain goods, sometimes called return miles) are included in the calculation could yield results that differ by nearly a factor of two. Therefore, we define what is included and excluded in the scope of this work.
3.2.1 Included
The scope of this project spans GM global logistics, inbound and outbound. This includes transportation of parts and material from the shipping dock of tier 1 parts suppliers to the receiving dock of GM assembly plants (inbound) as well as transportation of finished vehicles from the shipping dock of GM assembly plants to dealer locations (outbound). Empty miles are included when applicable. All modes of transportation will fall within the project scope, including truck, rail, air, ocean, and intermodal (any combination of truck, rail, and ocean). Research extends from global logistics to operations, engineering, and business planning groups as required. Direct interaction with logistics providers (external to GM) is required. Logistics data within scope are those necessary to report global greenhouse gas emissions per the Greenhouse Gas Protocol's Scope 3 emissions classification, within the 'upstream' and 'downstream' transportation categories (excluding warehousing and distribution center emissions
-see exclusions below).
3.2.2 Excluded
Analysis of any emissions related to facilities used to manufacture, warehouse, or consolidate GM-owned material is not included in the project scope. This is because: (1) emissions produced from manufacturing and storage of products in GM owned facilities is currently captured and reported in GM's Scope 1 and Scope 2 emissions categories, and (2) data availability restrictions prevent direct tracking of emissions from third party facilities. Emissions of products sold are not included in this analysis. These are classified in the 'use of sold products' category of the GHG Protocol and are currently tracked by
3.3
Current State of Emissions Reporting at General Motors
GM has an impressive and robust annual sustainability report that includes a wide range of ongoing environmental and social responsibility efforts at the company [1]. Regarding emissions measurement not related to logistics, GM reports annually on its global facilities and product portfolio. The facilities organization has a structured energy management team that leads energy efficiency projects around the globe. The energy management team has been in place for over a decade, and has implemented various business processes as well as a comprehensive, global energy management IT system that collects consumption data for all GM-owned facilities. Through constant monitoring and analysis, the team can recommend critical energy and cost reduction projects for the company. This is a clear benefit that can be gained from having access to energy consumption data and the resulting emissions dataset. As for GM's product portfolio, the product development team pays close attention to the emissions generated by the products it designs. This is not only critical for consumer satisfaction but also to adhere to governmental regulation and corporate average fuel economy (CAFE) standards for passenger cars and light trucks.
Prior to applying the approach resulting from our research, GM's logistics emissions reporting was in its beginnings. The company had already been reporting supply chain activity to the CDP, but it did not yet have a robust method for collecting logistics emissions data nor did it have any method instilled to analyze such data and guide business decisions. The process for reporting logistics emissions data to the CDP originated from the facilities energy management team, who solicited data from the logistics organization on an annual basis. Information such as 'planned network miles traveled' and 'dollars spent on logistics services' (called "spend") was collected to satisfy reporting requirements. Due to data inconsistencies, along with the use of planned miles instead of actual miles and the need for global extrapolation based on unit sales, the results of GM's initial GHG emissions estimates in logistics were not accurate to a high level of confidence.
3.3.1 Competition
An initial analysis of competitors, through public sources, indicated that Ford, Chrylser (Fiat), Toyota, and Volkswagen all have ongoing logistics-targeted emissions reduction initiatives. Sections detailing logistics carbon footprint reduction efforts were found within each competing firm's sustainability report. Through 2012, GM's sustainability report did not include sustainability efforts specifically related to logistics. Furthermore, Ford has partnered with Odette to publish common guidelines for freight carbon dioxide reporting for the European auto industry. Finally, both Chrysler and Toyota participate in the USEPA SmartWay program as shipper partners.
3.4
Approach: Evaluating Emissions of a Complex, Global Logistics Network
Considering our objectives, we focus on creating a lasting system to measure and analyze logistics emissions and view our approach as an ongoing initiative rather than a one-time project. Additionally, working within an organization whose goals are heavily focused on cost savings, and given that negligible budget is reserved for implementation of our approach, it is critical that our approach be one that can be easily understood, easy to implement in a complex business environment, and does not require large capital or human resources. From this vantage, a solution including a robust internal global transportation management system (TMS) requiring software and IT investment would be cost-prohibitive and human resource intensive and thus could not be considered. Such a system would be ideal for a company with logistics operations that are primarily internal; however, most global corporations, including GM, leverage 3PL partners that closely manage logistics operations using their own TMS. Therefore, in addition to internal data and information, we place high importance on working closely with 3PL partners to develop and implement our approach.3.4.1 Attempting a Single Global Approach
Adopting a single global method for measuring and analyzing GM's logistics carbon footprint is the ideal solution to achieve the stated objectives. Whether this solution is created using internal company
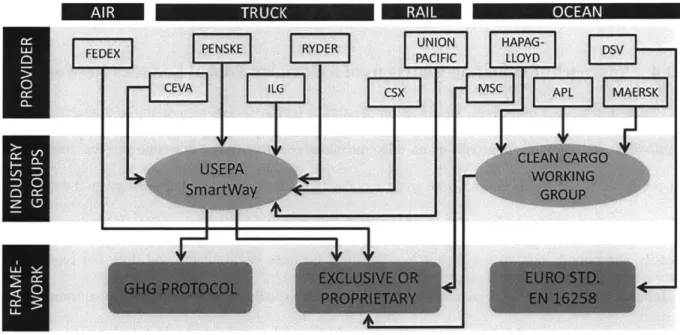
early in developing a successful approach. In order to answer this question, our research began with interviewing GM's key logistics providers. Our intention was to better understand the capabilities, methods, and processes that were being used currently and to determine if any method or methods stood out as common among industry providers or mode types globally. Common themes were identified as a result of over a dozen interviews and further industry research. A graphical representation of these findings for GMNA is shown in Figure 5.
FEDEX PENSKE RYDER PACIFIC UNION HA G-DSVLLOYD
CEVA ILG CSX N4C APL MAERSK
Figure 5: Industry Group Participation and Employed Framework for Carbon Footprint Measurement of Key GM Logistics Partners Serving North America
Two main conclusion can be drawn from our GMNA findings. First, we see a clear preference among truck and rail carriers to use the USEPA SmartWay program for emissions reporting. Second, and although not as predominate, we see major ocean carriers choosing the Clean Cargo Working Group for emissions reporting. Furthermore, the underlying measurement frameworks for providers serving North America were found to be either adaptations of the GHG Protocol and/or an exclusive or proprietary method. Exclusive methods use custom calculations based on company-specific data or modal intricacies. An example of this is found within the Clean Cargo Working Group's methods, which use loads
measured in TEUs (or twenty-foot equivalent units, a common unit of measure for container ships) instead of units of weight. Proprietary methods, such as those used at FedEx, are kept secret but are verified by a third party audit firm. The sole firm using the Euro Standard EN 16258 is based in Europe.
This mapping process was attempted for GM's three other regions (GME, GMSA, and GMIO), but substantial issues arose as internal and external interviews revealed clear differences in the maturity of carbon footprint measurement capabilities and data availability among the regions as compared to North America. The gaps most crippling to our work were found in the truck, rail, and short sea (moving goods by sea without crossing an ocean, typically intra-continental) modes of transportation outside of North America. Global maturity of the top ten largest ocean carriers was not a problem, as these carriers serve the entire globe, and it is with these large carriers that GM contracts its intercontinental ocean freight. The following issues were identified, by region, which prevented one consolidated approach for all regions:
Europe (GME): We originally anticipated Europe to be as advance, if not more advanced, than North America in its ability to measure and analyze carbon footprint given the region's reputation shaped by countries like Sweden and Germany, for example. This indeed was the case. Organizations such as Odette and Green Freight Europe mirror the U.S.'s Automotive Industry Action Group (AIAG) and SmartWay, respectively. In fact, SmartWay and Green Freight Europe consistently work together, cooperating toward a common goal of reducing global emissions produced by freight transportation. However, we were unable to develop a comprehensive map similar to our GMNA illustration due to a GM logistics transition within the European network. Although data availability was limited due to the transition during the time of our study, we developed important contacts within the new management structure who we recommend to co-lead future global synchronization efforts. Once the European network data systems are complete, GM logistics will easily be able to develop a partnership with Green Freight Europe.
South America (GMSA): Anecdotes had been given by GM leaders who have spent time working in the company's South American region that there is a trending focus to operate in a more sustainable
manner. Work performed by GMSA teams with regards to facilities energy management, factory waste reduction, and responsible sourcing prove this to be true. However, the region significantly lacks organized industry groups dedicated to helping companies measure and reduce carbon emissions in logistics. Brazil has created a program based on the GHG Protocol that provides 'how-to' training and workshops for organizations that wish to create a greenhouse gas emissions inventory for voluntary reporting. The program is a step in the right direction, but it is still in its early stages of development and does not provide a common database or collaborative environment for providers and procurers of logistics services like the SmartWay and Green Freight Europe programs do. We determined that far too few of the logistics providers that GM works with in South America were a part of Brazil's GHG Protocol program or had the technical knowledge required to be able to provide emissions data.
Asia and Rest of World (GMIO): Currently, the GMIO logistics group functions in a unique way that works well for its operating structure. Each manufacturing facility largely controls the logistics operations needed to sustain production. The centralized regional logistics team is much smaller than in North America and is more involved with logistics strategy for the region. This is problematic in that mapping major logistics providers and researching what, if any, environmental industry groups or emissions measurement methods they employ would mean interfacing with each manufacturing facility and the smaller logistics providers that service each facility. Two main barriers to progress arise because of this. First, the amount of time that would be required to make the connections required to sufficiently map the GMIO network was not anticipated nor allocated to the initial phase of our effort. Second, we realized that even if we allocated time to map the GMIO network, emissions measurement of logistics services in Asia is also in its infancy, and robust tools and processes such as those found within the SmartWay and Green Freight Europe program do not yet exist to aggregate regional data for large procurers of logistics services. Green Freight Asia, based in Singapore, and Green Freight India, based in New Delhi, are gaining momentum and show promise to evolve into practical, data-driven industry groups in the near future as more members join.
Initial conclusions were that a single global model for measuring and analyzing the carbon footprint of GM's logistics network was not yet feasible at the time of the study. However, we have identified numerous independent initiatives around the globe aimed at addressing and reducing freight transport emissions. Figure 6 shows the world's leading initiatives geographically. In the coming years, we anticipate a stronger and more untied global effort. As noted in its Green Freight Call to Action [17], an effort by the partners of the Climate and Clean Air Coalition (CCAC) is underway to "...collaborate with stakeholders to develop and deploy a coordinated Global Green Freight Action Plan that can be implemented through public-private partnerships worldwide. The Action Plan will provide a common roadmap that can help to harmonize and coordinate the development of green freight programs, ease implementation, and incorporate a large knowledge base of previous efforts. It will also provide a platform for companies to share best practices, promote innovation, and communicate sustainability improvements on road freight." The CCAC is supported by various global governments, NGOs, IGOs, and members from the private sector.
WOR LD _ - sa EC4N MIC CENTRE NDN FREEIGHT
NKSmartWa
fRESClean
~
"~~iIATA
3.4.2 A Tripartite Solution
Our initial research findings suggested that a single global approach would not be feasible in the short term, but that this ideal state will likely exist in the near future. Therefore, we propose a tripartite solution that includes participating in one of the major environmental industry groups focused on logistics emissions measurement for North America, while creating an interim estimation model for the rest of the globe. These two parts generate separate work streams and together quantify the mass emissions
generated by GM's global logistics network. A third work stream is also added in which we leverage the existing cost savings work done in the logistics organization to show the positive relationship between cost savings and emissions reduction.
3.4.2.1 Part One: Environmental Industry Group Participation
Part one of our approach solidifies GM's efforts to implement industry-recognized methods and processes for logistics-related emissions measurement. Here, we take the steps necessary for GM to become a shipper member of the USEPA SmartWay program. SmartWay was selected among all other industry groups due to its strength in membership within North America and its robust, industry-recognized methodology. Chapter 4 is dedicated to explaining the work completed to achieve this partnership and discusses the current and future benefits of joining SmartWay.
3.4.2.2 Part Two: Global Emissions Measurement
Part two of our approach creates a model for estimating GM's logistics carbon footprint for all regions of the globe. The model is based on the amount of spend on each mode of transportation and uses emissions factors in terms of carbon dioxide per U.S. dollar (C02/$USD) to equate mass emissions generated by operating the network. Chapter 5 is dedicated to explaining the work completed to build this model and discusses the outputs of the model.
3.4.2.3 Part Three: Network Change Analysis
In part three of our approach, we develop a tool that translates cost savings from network change activities into increases or decreases in carbon dioxide emissions generated by the change activities. Our analysis of these emissions changes shows a positive correlation with cost savings, providing further reinforcement and motivation for implementing carbon reduction projects in logistics. Chapter 6 is dedicated to explaining the work completed to create this tool and its use within the organization.
4 Environmental Industry Group Participation
After researching and benchmarking other automakers, logistics service providers, and individual transport carriers, we concluded that there many environmental industry groups across the globe (see Figure 6) that are dedicated to measurement and reduction of logistics-related carbon emissions. These groups, however, are not yet unified in their efforts and still operate with independent processes and membership pools. Yet, we offer that becoming a member of at least one of these environmental industry groups is critical for sustaining carbon footprint measurement and reduction efforts within GM logistics as well as driving a cultural shift. We selected the USEPA SmartWay Transport Partnership, and this chapter explains the selection process, onboarding effort, and benefits of participating in the program.
4.1
Environmental Industry Group Selection
By participating in an environmental industry group, GM can leverage external expertise, methods, tools, and participant networks. For an organization with constrained budgetary and human resources, adopting an existing and externally supported process is superior to creating an internal data solution. Most of the environmental industry groups manage and update their systems on a yearly basis, which delivers a more sustainable business process for GM and is more likely to live-on and evolve even as corporate stakeholders change roles or leave the organization.
Because of the issues identified in Chapter 3 (3.4.1) with global data acquisition, we determined that it would be best to pilot GM's participation in such a group in North America. With success, efforts would be mirrored around the globe as other regions' environmental industry groups become more mature and required data becomes available.
After narrowing our search to the North American region, two groups became front-runners for selection. First, the USEPA SmartWay program, which spans the United States and Canada and focuses efforts on truck and rail networks, has been in existence for over a decade and has a large and established member base with over 3,000 participating firms. Second, the Clean Cargo Working Group, which has a
smaller number of members (fewer than 50 at the time of this study) around the globe, focuses solely on ocean carrier networks. Two primary considerations led us to select SmartWay initially instead of Clean Cargo: (1) most importantly, truck and rail make up the vast majority of the North American network, while ocean remains small in comparison, and (2) joining SmartWay requires no monetary membership fee, while Clean Cargo charges nominal membership dues annually.
4.2 USEPA SmartWay Transport Partnership
The SmartWay Transport Partnership program is a public-private collaboration between the United States Environmental Protection Agency and the freight transportation industry. The program is free of charge and voluntary. It was started in 2004 and its primary goal is to reduce the amount of carbon emissions produced by transporting materials and finished goods, thus creating more efficient logistics networks [15]. Active participation in the program can lead to environmental, operational, and cost efficiencies. SmartWay pioneered methods and developed tools whereby information is voluntarily shared among freight carriers, logistics service providers, and shippers, yet data regarding actual fuel consumption (and hence, financial information) is kept confidential. This fosters a collaborative environment in which all parties can work together toward achieving a common goal of emissions reduction. Currently, the program has members in the United States and Canada and focuses on truck and rail transportation. Each year, the EPA recognizes member firms that have achieved excellence in reporting transparency and reduction efforts. The use of the program's logo is encouraged in company reports and press releases, and it has been likened to the Energy Star logo for appliances. In addition to providing methods and tools for carbon measurement, SmartWay also provides guidance for technology selection and network optimization.
4.2.1 Methods and Tools
SmartWay offers a platform for companies to measure transportation-related emissions. For freight carriers operating owned assets, these classify as Scope
1
emissions per the GHG Protocol. For shipperScope 3 emissions (i.e., emissions resulting from purchased goods or services). The tools are capable of calculating C02 emissions as well as NOx and particulate matter; however, for the purposes of our research, we discuss only C02. We explain the process from the perspective of a shipper partner.
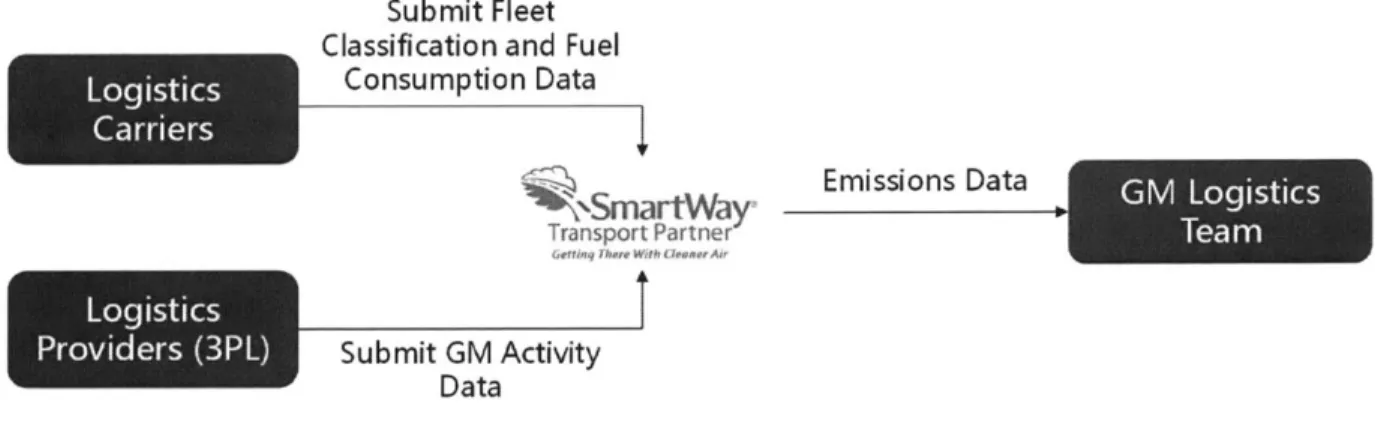
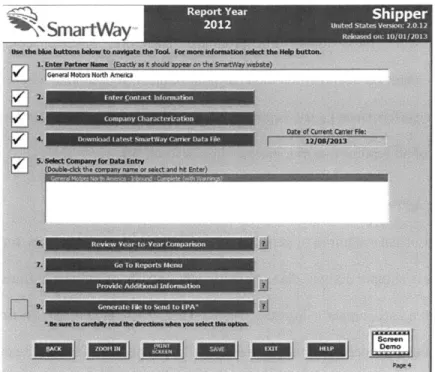
At a high level, the SmartWay Shipper Tool requires two sets of information to generate detailed mass emissions data useful to a shipper partner: (1) fleet classification and fuel consumption data from individual freight carriers, and (2) activity data from shippers or the 3PL providers managing operations on behalf of the shipper. This data is processed through the tool and the resulting mass emissions data can be used by shippers for benchmarking and reduction tracking. The process is illustrated in Figure 7.
Submit Fleet Classification and Fuel
Emissions Data
ow)-SmartWay,
Transport PartnerGetting Theme With Clop."rAir
e
Figure 7: Information Flow of the SmartWay Shipper Tool
4.2.1.1 Logistics Carrier Data
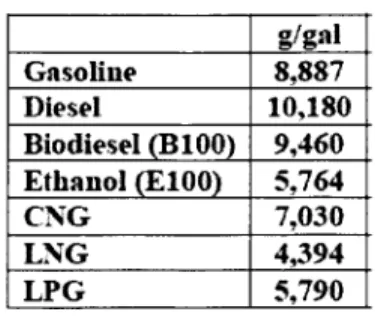
To begin the process, individual carriers must submit a fleet classification describing equipment and service type. For truck mode, this includes options such as standard truckload, flat bed, refrigerated, etc. For rail, this distinction is not relevant, as SmartWay rail carriers are simply classified as Class 1. Carriers must also submit fuel consumption data for their fleet vehicles over the course of the reporting year. The tool uses this data to categorize each company to a specific fleet type and calculates C02 emissions based on emissions factors found in Figure 8.
g/gal Gasoline 8,887 Diesel 10,180 Biodiesel (B100) 9,460 Ethanol (E100) 5,764 CNG 7,030 LNG 4,394 LPG 5,790
Figure 8: C02 Emissions Factors (EF) by Fuel Type (assumes 100% combustion) 1191
These factors are used to calculate C02 based on type and amount of fuel consumed. The equation used to calculate mass emissions is:
Eco2 = (F x EFF)+(B X EFB)
Equation 1: C02 Calculation based on Fuel Consumption 1191
List of Variables
Eco2 = Mass emissions (grams C02/year)
F = Fossil fuel (gallons/year)
B = Biofuel (gallons/year)
EFF = Fossil fuel emissions factor based on fuel type (grams/gallon)
EFB = Biofuel emissions factor based on fuel type (grams/gallon)
Mass emissions are totaled for each carrier and divided by the total miles traveled during the reporting year to generate an average value for the firm in units of grams of C02 per mile (g C02/mile). The mass emissions are also divided by the total mileage multiplied by the average weight per shipment during the reporting year to generate an average value for the firm in units of grams of C02 per ton-mile (g C02/ton-mile). These metrics are referred to as "carrier performance data" and are used by SmartWay as indicators of efficiency, normalized and comparable across firms operating similar equipment types.
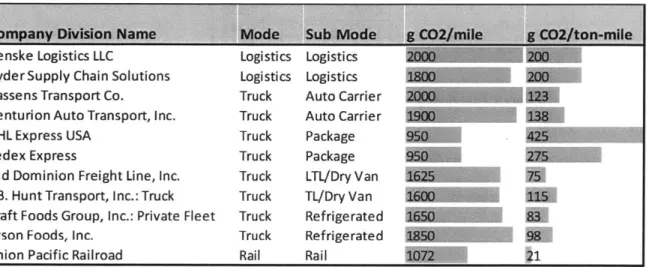
to the public. A selection of this report has been adapted from the SmartWay website and can be found in Figure 9.
Company Division Name Mode Sub Mode g C02/mile g C02/ton-mile
Penske Logistics LLC Logistics Logistics
Ryder Supply Chain Solutions Logistics Logistics
Cassens Transport Co. Truck Auto Carrier
Centurion Auto Transport, Inc. Truck Auto Carrier
DHL Express USA Truck Package
Fedex Express Truck Package
Old Dominion Freight Line, Inc. Truck LTL/Dry Van
J.B. Hunt Transport, Inc.: Truck Truck TL/Dry Van
Kraft Foods Group, Inc.: Private Fleet Truck Refrigerated
Tyson Foods, Inc. Truck Refrigerated
Union Pacific Railroad Rail Rail
Figure 9: Sample of Carrier Performance Data Adapted from SmartWay Website [201
It is important to understand that the performance value measured in units of g C02/ton-mile accounts for the weight capacity utilization of an average shipment for the firm. For example, we see that companies DHL Express USA and Fedex Express post the best performance in terms of g C02/mile, but these companies offer package/parcel services that typically carry lightweight yet bulky consumer packages and end up maximizing volume of shipment while underutilizing weight of shipment. This leads to a greater amount of emissions released into the atmosphere in terms of g C02/ton-mile of shipment. In contrast, Old Dominion Freight Line, Inc. reports an average performance in terms of g C02/mile, however they seem to do well at maximizing weight utilization as they post exceptional performance in terms of g C02/ton-mile. Moreover, rail firms utilize locomotives and uninterrupted momentum to pull shipments far heavier than a single truck can, resulting in superior emissions performance values per
ton-mile. In most industrial cases, transport logistics firms will seek to optimize both weight and volume of shipment, but the limiting factor is often weight due to transporting heavy-goods. Therefore, in the auto industry, it is preferred to use performance values in terms of g C02/ton-mile when possible.