Checkpoint Blockade Immunotherapy Induces Dynamic
Changes in PD-1−CD8+ Tumor-Infiltrating T Cells
The MIT Faculty has made this article openly available.
Please share
how this access benefits you. Your story matters.
Citation
Kurtulus, Sema et al. “Checkpoint Blockade Immunotherapy
Induces Dynamic Changes in PD-1−CD8+ Tumor-Infiltrating T
Cells.” Immunity 50 (2019): 181-194 © 2019 The Author(s)
As Published
10.1016/J.IMMUNI.2018.11.014
Publisher
Elsevier BV
Version
Author's final manuscript
Citable link
https://hdl.handle.net/1721.1/125032
Terms of Use
Creative Commons Attribution-NonCommercial-NoDerivs License
Checkpoint blockade immunotherapy induces dynamic changes
in PD-1
−CD8
+tumor-infiltrating T cells
Sema Kurtulus1,6, Asaf Madi1,2,6, Giulia Escobar1, Max Klapholz1, Jackson Nyman3, Mathias Pawlak1, Danielle Dionne3, Junrong Xia1, Orit Rozenblatt-Rosen3, Vijay K.
Kuchroo1,*, Aviv Regev3,4,5,*, and Ana C. Anderson1,7,*
1Evergrande Center for Immunologic Diseases and Ann Romney Center for Neurologic Diseases,
Harvard Medical School and Brigham and Women’s Hospital, Boston, MA, 02115,
2Department of Pathology, Sackler School of Medicine, Tel Aviv University, Tel Aviv, Israel, 3Broad Institute of MIT and Harvard, Cambridge, MA 02142,
4Department of Biology, Koch Institute and Ludwig Center, Massachusetts Institute of Technology,
Cambridge, MA 02142,
5Howard Hughes Medical Institute. 6These authors contributed equally 7Lead contact: A.C.A.
Summary
An improved understanding of the anti-tumor CD8+ T cell response after checkpoint blockade would enable more informed and effective therapeutic strategies. Here we examined the dynamics of the effector response of CD8+ tumor-infiltrating lymphocytes (TILs) after checkpoint blockade therapy. Bulk and single-cell RNA profiles of CD8+ TILs following combined Tim-3+PD-1 blockade in preclinical models revealed significant changes in the transcriptional profile of PD-1− TILs. These cells could be divided into subsets bearing characterstics of naïve-, effector-, and memory-precursor-like cells. Effector- and memory-precursor-like TILs contained tumor-antigen specific cells, exhibited proliferative and effector capacity and expanded in response to different
*Correspondence: [email protected] (V.K.K.), [email protected] (A.R.), [email protected]
(A.C.A).
Author Contributions
Conceptualization, S.K., A.M., G.E., V.K.K., and A.C.A.; Methodology, A.C.A., S.K., A.M., G.E., O. R. R., and A. R.; Formal Analysis, S.K., A.M., G.E., and A.R.; Investigation, S.K., A.M., G.E.; Resources, S.K., G.E., M.P., J.N., D.D., M.K. and J.X.; Writing – Original Draft, S.K., A.M., A.C.A. V.K.K. and A.R.; Supervision, A.R., V.K.K., and A.C.A.; Funding Acquisition, V.K.K., A.R. and A.C.A.
Publisher's Disclaimer: This is a PDF file of an unedited manuscript that has been accepted for publication. As a service to our
customers we are providing this early version of the manuscript. The manuscript will undergo copyediting, typesetting, and review of the resulting proof before it is published in its final citable form. Please note that during the production process errors may be discovered which could affect the content, and all legal disclaimers that apply to the journal pertain.
Declaration of interests
A.C.A. is a member of the SAB for Potenza Therapeutics and Tizona Therapeutics, which have interests in cancer immunotherapy. V.K.K. has an ownership interest and is a member of the SAB for Potenza Therapeutics and Tizona Therapeutics. A.C.A.’s and V.K.K.’s interests were reviewed and managed by the Brigham and Women’s Hospital and Partners Healthcare in accordance with
HHS Public Access
Author manuscript
Immunity
. Author manuscript; available in PMC 2020 January 15.Published in final edited form as:
Immunity. 2019 January 15; 50(1): 181–194.e6. doi:10.1016/j.immuni.2018.11.014.
A
uthor Man
uscr
ipt
A
uthor Man
uscr
ipt
A
uthor Man
uscr
ipt
A
uthor Man
uscr
ipt
checkpoint blockade therapies across different tumor models. The memory-precursor-like subset shared features with CD8+ T cells associated with response to checkpoint blockade in patients, and was compromised in the absence of Tcf7. Expression of Tcf7/Tcf1 was requisite for the efficacy of diverse immunotherapies, highlighting the importance of this transcriptional regulator in the development of effective CD8+ T cell responses upon immunotherapy.
In Brief:
Kurtulus et al examine the dynamics of the effector CD8+ T cell response in the tumor
microenvironment in response checkpoint blockade immunotherapy. Checkpoint blockade induced a shift from naive- to memory-precursor- and effector-like subsets within PD-1−CD8+ T cells in tumors. The memory-precursor-like subset is maintained by the transcriptional regulator Tcf7, which is required for efficacy of checkpoint blockade and other immunotherapies.
Graphical Abstract
Keywords
CD8+ T cell; cancer; single-cell; dysfunction; exhaustion; memory; checkpoint blockade; immunotherapy
Introduction
The CD8+ T cell response within the tumor microenvironment (TME) is transcriptionally (Singer et al., 2016; Tirosh et al., 2016; Zheng et al., 2017) and functionally (Sakuishi et al., 2010; Woo et al., 2012; Xu et al., 2015) heterogeneous. At one end of the spectrum are CD8+ tumor-infiltrating lymphocytes (TILs) that lack the expression of co-inhibitory or immune checkpoint receptors (eg. CTLA-4 and PD-1) and exhibit effector potential, while at the opposite end are CD8+ TILs that co-express multiple checkpoint receptors and exhibit an
A
uthor Man
uscr
ipt
A
uthor Man
uscr
ipt
A
uthor Man
uscr
ipt
A
uthor Man
uscr
ipt
“exhausted” or dysfunctional phenotype. Checkpoint blockade immunotherapy, using antibodies against checkpoint receptors, is associated with improved CD8+ T cell responses in multiple pre-clinical cancer models (Duraiswamy et al., 2013; Rangachari et al., 2012; Woo et al., 2012) and in patients (Das et al., 2015; Gubin et al., 2014; Huang et al., 2017; Kamphorst et al., 2017; Yuan et al., 2008). Accordingly, the success of checkpoint receptor blocking antibodies is attributed to the direct blockade of these receptors on dysfunctional CD8+ T cells, thereby reinvigorating their effector functions. However, it remains unclear whether checkpoint blockade therapy can also act on other cells in the TME to generate an environment that promotes optimal differentiation of T cell precursors into functional effector cells.
Recent studies suggest that PD-1 blockade acts on a distinct subset of PD-1+ precursors that reside in lymphoid organs in the setting of chronic viral infection (Im et al., 2016;
Utzschneider et al., 2016) and that a similar population may exist in tumor tissue
(Brummelman et al., 2018). However, PD-1+CD8+ T cells have limited potential to give rise to a long-lasting effector response due to their acquisition of a stable epigenetic state that cannot be reverted by therapy (Ghoneim et al., 2017; Pauken et al., 2016; Philip et al., 2017; Scott-Browne et al., 2016; Sen et al., 2016). These observations raise the important question of which cells give rise to the effector T cells that expand after checkpoint blockade therapy and are responsible for the therapeutic effect. Understanding which CD8+ TILs give rise to the effector response upon checkpoint blockade could enable not only improved strategies for harnessing the CD8+ T cell response to fight cancer, but also the identification of biomarkers to track responses to therapy.
To address this question, we examined changes in the RNA profiles of population and single CD8+ TILs after Tim-3+PD-1 blockade in a preclinical model of colon cancer. The most significant transcriptional change in CD8+ TILs after checkpoint blockade occured in cells that lack expression of PD-1 and other checkpoint receptors. In depth analyses of PD1− CD8+ TILs revealed three subsets that share features with naïve, memory-precursor, and effector CD8+ T cells and change in their proportion in response to different checkpoint blockade therapies across different cancers. The number of memory-precursor-like CD8+ T cells increased upon therapy, and shared features with human CD8+ T cells that are
associated with favorable prognosis and response to checkpoint blockade in cancer patients. The transcription factor Tcf7/Tcf1 was a critical regulator of this subset, and we found that checkpoint blockade and innate agonist immunotherapies failed in its absence. Thus, examination of the dynamics of the development of the effector CD8+ T cell response in the TME in the context of immunotherapy suggests a central role for PD-1− CD8+ TILs, and argues for the importance further defining the mechanisms underlying the response to checkpoint blockade therapies.
Results
Checkpoint blockade results in profound transcriptional changes in CD8+ TILs that lack co-inhibitory receptor expression
We have previously demonstrated that Tim-3 and PD-1 can be used to identify CD8+ TILs at opposite ends of the functional spectrum: Tim-3+PD-1+ CD8+ TILs are severely
A
uthor Man
uscr
ipt
A
uthor Man
uscr
ipt
A
uthor Man
uscr
ipt
A
uthor Man
uscr
ipt
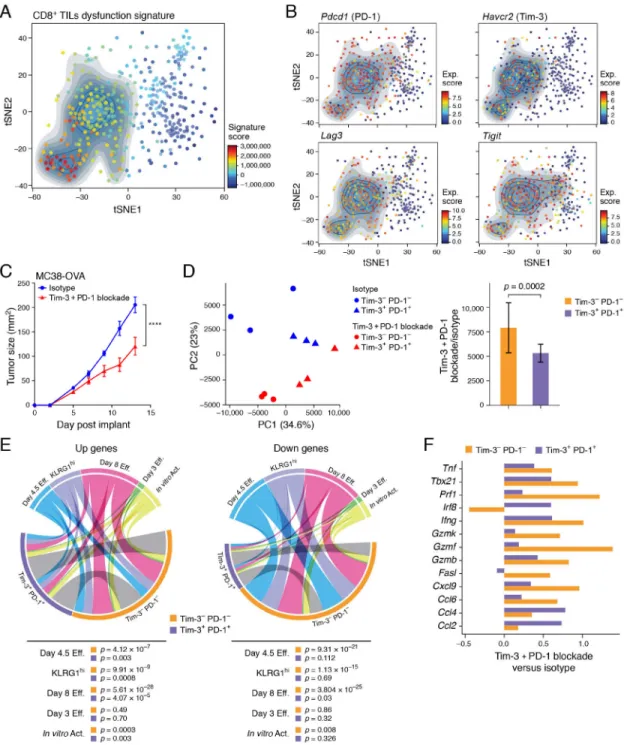
dysfunctional, whereas Tim-3−PD-1− CD8+ TILs exhibit effector potential (Fourcade et al., 2010; Sakuishi et al., 2010), with each population harboring distinct transcriptional profiles (Singer et al., 2016). To determine the functional and transcriptional heterogeneity within CD8+ TILs, we generated a dysfunction signature defined as the differentially expressed genes between Tim-3−PD-1− and Tim-3+PD-1+ CD8+ TILs (Methods) and scored this signature in our previously reported scRNA-Seq profile of CD8+ TILs from B16F10 melanoma (Singer et al., 2016). We observed a gradient of low to high expression of the dysfunction signature across single CD8+ TILs (Figure 1A). As expected, cells with low expression of the dysfunction signature were negative for checkpoint receptors, such as Tim-3, PD-1, Lag-3, and TIGIT (Figure 1B).
We next determined the effect of checkpoint blockade therapy on Tim-3−PD-1− and Tim-3+PD-1+ CD8+ TIL populations, considering that checkpoint receptor blockade could impact these populations either directly or indirectly due to the expression of checkpoint receptors on multiple immune cell populations in the TME (da Silva et al., 2014; Gordon et al., 2017; Jiang et al., 2016; Krempski et al., 2011; Lim et al., 2016; Sakuishi et al., 2013). We used ovalbumin-expressing MC38 colon carcinoma (MC38-OVA) to enable tracking of endogenous T cell responses to the tumor-expressed OVA antigen. We treated MC38-OVA tumor-bearing mice with a combination of anti-Tim-3 and anti-PD-1 antibodies (hereafter referred to as Tim-3+PD-1 blockade) (Figure 1C), given the demonstrated efficacy of this antibody combination in multiple tumor models (Ngiow et al., 2011). We used
non-competing anti-Tim-3 and anti-PD-1 antibody clones to isolate low (Tim-3−PD-1−) and high (Tim-3+PD-1+) dysfunction signature-expressing CD8+ TIL populations and profiled them in bulk. Principal Component Analysis (PCA) (Figure 1D) distinguished Tim-3+PD-1+ and Tim-3−PD-1− CD8+ TILs in the first principle component (PC1, 34.6% of variance), irrespective of treatment condition, while PC2 (23% of variance) primarily distinguished between treatment condition, but in a manner that also reflected the CD8+ TILs population. Importantly, the change in profiles between the isotype and the Tim-3+PD-1 blockade groups were more significant for Tim-3−PD-1− TILs than for Tim-3+PD-1+ CD8+ TILs (Figure 1D, p=0.0002, t-test, and Methods).
Next, we determined whether the changes observed in Tim-3−PD-1− and Tim-3+PD-1+ CD8+ TILs populations after Tim-3+PD-1 blockade were associated with the acquisition of an effector phenotype. As expected, several effector genes were increased in Tim-3+PD-1+ CD8+ TILs after Tim-3+PD-1 blockade (Table S1). However, analysis of multiple effector CD8+ T cell signatures (Hervas-Stubbs et al., 2010; Kaech et al., 2002; Kalia et al., 2010; Sarkar et al., 2008) revealed a more substantial overlap of these signatures with the
differentially expressed genes found between the isotype and Tim-3+PD-1 blockade groups in the Tim-3−PD-1− CD8+ TILs as compared to the Tim-3+PD-1+ CD8+ TILs
(p-value=0.008, paired t-test, Figure 1E). We identified 39 genes that were increased in both subsets (Table S2). These included effector genes such as Ifng, Tnfa, and Gzmb, and transcription factors such as Tbx21; however, these and other well-known effector genes showed greater treatment-induced changes in Tim-3−PD-1− as compared to Tim-3+PD-1+ CD8+ TILs (Figure 1F). Thus, checkpoint blockade-induced transcriptional changes were consistent with acquisition of effector potential in CD8+ TILs, and this occurred to a significantly greater extent in CD8+ TILs that lack expression of co-inhibitory receptors.
A
uthor Man
uscr
ipt
A
uthor Man
uscr
ipt
A
uthor Man
uscr
ipt
A
uthor Man
uscr
ipt
PD-1− CD8+ TILs contain tumor-antigen specific precursors that expand in response to checkpoint blockade
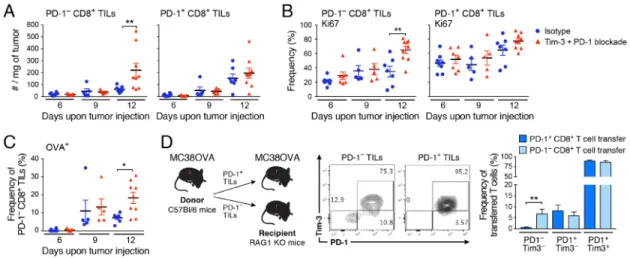
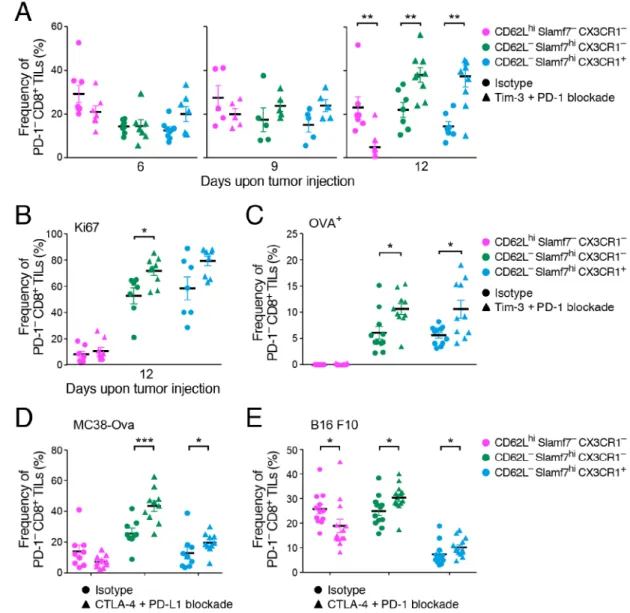
Given the observed changes in Tim-3−PD-1− CD8+ TILs (Figure 1D,E) and the recent studies indicating the limited potential of PD-1+ cells to establish long-lasting immunity (Ahn et al., 2016; Ghoneim et al., 2017; Pauken et al., 2016; Sen et al., 2016; Utzschneider et al., 2013), we focused on understanding the changes within Tim-3−PD-1− CD8+ TILs (cells that are PD-1− are uniformly negative for Tim-3 and other checkpoint receptors) and their relationship to Tim-3+PD-1+ CD8+ TILs. We quantified the numbers of PD-1− and PD-1+ CD8+ TILs after each anti-Tim-3+anti-PD-1 treatment and found increased numbers of PD-1−, but not PD-1+ CD8+ TILs, after three treatments (Figure 2A). This was due to increased proliferation of PD-1− CD8+ TILs as determined by Ki67 expression (Figure 2B). The proliferation of PD-1− CD8+ TILs was antigen-driven as indicated by the increased frequency of OVA-specific PD-1− CD8+ TILs after three treatments (Figure 2C). Together these data indicated that checkpoint blockade induced expansion of antigen-specific PD-1− CD8+ TILs.
PD-1− CD8+ TILs are presumably at an earlier phase of effector differentiation compared to PD-1+ CD8+ TILs and would therefore be predicted to have better effector potential and capacity to sustain long-lasting immunity. To test whether PD-1− CD8+ TILs contain precursors of PD-1+ CD8+ TILs, we isolated PD-1− and PD-1+ CD8+ TILs from MC38-OVA tumor-bearing mice and adoptively transferred the two subsets into RAG−/− mice that were subsequently implanted with MC38-OVA (Figure 2D). In line with observations in chronic viral infection models, we found that PD-1 expression remained stable on
transferred PD-1+ cells (Ahn et al., 2016; Utzschneider et al., 2013). In contrast, transferred PD-1− CD8+ TILs not only gave rise to PD-1+ as well as Tim-3+ CD8+ TILs, but also maintained a pool of PD-1− CD8+ TILs (Figure 2D). Thus, PD-1− CD8+ TILs contained tumor-antigen specific precursors that expanded and differentiated into PD-1+ cells.
Identification of distinct PD-1− CD8+ TIL subsets
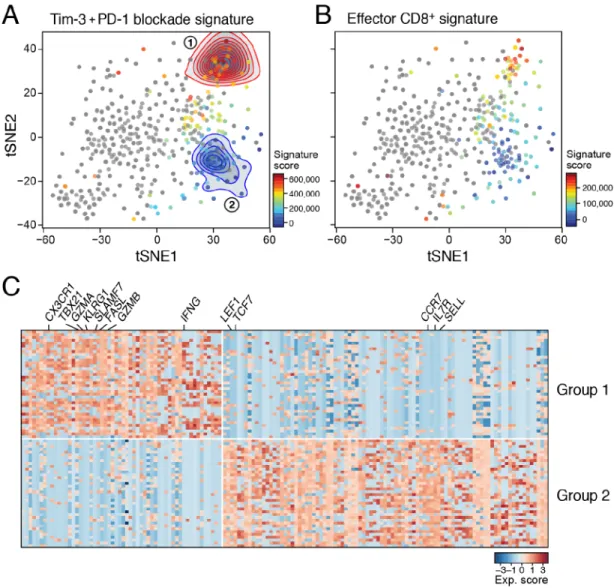
To determine whether the changes observed in the PD-1−CD8+ TILs were due to cell intrinsic changes or shifts in the proportions of pre-existing sub-populations within PD-1−CD8+ TILs, or both, we scored the differentially expressed gene signature of
Tim-3+PD-1 blockade and isotype-treated PD-1− CD8+ TILs within our previously reported scRNASeq profile from untreated mice (Singer et al., 2016). This highlighted two distinct sets of cells within PD-1− CD8+ TILs (Figure 3A). Group 1 cells expressed genes that were increased after Tim-3+PD-1 blockade, whereas Group 2 cells expressed genes that were higher in the isotype-treated group. This suggested that both groups of cells exist even in the absence of checkpoint blockade, and that the differences observed in bulk RNA profiles reflected proportional changes in pre-existing sub-populations. Moreover, Group 1 cells also showed higher expression of a CD8+ T cell effector signature (Kaech et al., 2002) than Group 2 cells (Figure 3B), suggesting that Tim-3+PD-1 blockade may induce an increase in CD8+ T cells with effector potential within the PD-1−CD8+ TILs population. Indeed, genes found in effector T cells, such as Ifng, Gzma, Gzmb, Tbx21, and Fasl, were more highly expressed in Group 1, and genes associated with naïve and memory CD8+ T cells, such as, Sell, Il7r, Ccr7, Tcf7, Lef1, were more highly expressed in Group 2 cells (Figure 3C).
A
uthor Man
uscr
ipt
A
uthor Man
uscr
ipt
A
uthor Man
uscr
ipt
A
uthor Man
uscr
ipt
Together, these data indicate that there are distinct subsets within PD-1−CD8+ TILs that differ in their expression of effector (Group 1) and naïve/memory (Group 2) programs.
PD-1−CD8+ TIL subsets exhibit properties of naïve, effector, and memory-precursor T cells
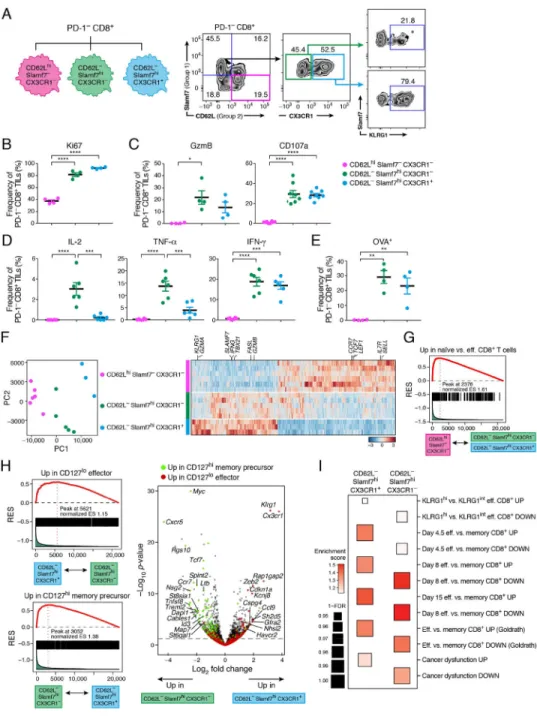
To better characterize the cells in Group 1 and Group 2, we sought to identify surface markers that could distinguish them. We identified CX3CR1 and KLRG1 for Group 1 and CD62L for Group 2 based on their differential expression (Figure 3C) and their known associations with effector and naïve CD8+ T cell subsets (Bottcher et al., 2015; Gerlach et al., 2016; Joshi et al., 2007; Lefrancois, 2006). We additionally used Slamf7 for Group 1. Consistent with their differential expression in Group 1 and 2 cells, CD62L expression marked a subset of PD-1− CD8+ TILs distinct from those expressing CX3CR1 and KLRG1 (Figure S1A). As Slamf7 expression captured a larger proportion of CD62L− cells than either CX3CR1 or KLRG1 (Figure 4A and S1A), we further examined the expression of CX3CR1 and KLRG1 within CD62L−Slamf7hiPD-1−CD8+ TILs (Figure 4A). CX3CR1 distinguished two subsets of Slamf7hiPD-1−CD8+ TILs that differ in the expression of KLRG1 (Figure 4A). Two additional small subsets defined as Slamf7−CD62L− and CD62LhiSlamf7lo could not be assigned to either Group 1 or 2 and were not considered further. We subsequently focused on three subsets of PD-1−CD8+ TILs:
CD62LhiSlamf7−CX3CR1−, CD62L−Slamf7hiCX3CR1−, and CD62L−Slamf7hiCX3CR1+. We next isolated TILs from MC38-OVA tumor-bearing mice and examined the three PD-1−CD8+ TIL subsets for their proliferative, cytotoxic, and effector capacities as well as antigen specificity. Both Slamf7hi subsets exhibited higher proliferative capacity compared to the CD62LhiSlamf7−CX3CR1− subset as determined by the fraction of Ki67+ cells (Figure 4B). The CD62LhiSlamf7−CX3CR1− subset completely lacked Granzyme B and CD107a expression in response to OVA257–264 stimulation, while both the CD62L −Slamf7hiCX3CR1− and CX3CR1+ subsets had similar expression of these proteins,
indicating similar cytotoxic capacity (Figure 4C). The CD62L−Slamf7hiCX3CR1− subset had the highest production of IL-2 and TNF-α in response to OVA257–264 stimulation, while
both the CD62L−Slamf7hiCX3CR1− and CX3CR1+ subsets equally produced IFN-γ (Figure 4D), and the CD62LhiSlamf7−CX3CR1− subset did not produce any cytokines. Overall, the CD62L−Slamf7hiCX3CR1− subset exhibited the most poly-functionality in cytokine production (Figure S1B). H-2Kb- OVA257–264 dextramer staining further showed
that there were OVA-specific CD8+ T cells within both the CD62L−Slamf7hiCX3CR1− and CX3CR1+ subsets, but not in the CD62LhiSlamf7−CX3CR1− subset (Figure 4E). Thus, the CD62LhiSlamf7−CX3CR1− subset exhibited naïve-like properties, while both the CD62L
−Slamf7hiCX3CR1− and CX3CR1+ subsets exhibited properties of antigen-specific effector
cells with the CD62L−Slamf7hiCX3CR1− subset exhibiting more poly-functionality.
The three PD-1−CD8+ TIL subsets also had distinct RNA expression profiles (Figure 4F and Table S3), with the CD62L−Slamf7hiCX3CR1− subset sharing some transcriptional features with both the CD62LhiSlamf7−CX3CR1− and the CD62L−Slamf7hiCX3CR1+ subsets. CD62LhiSlamf7−CX3CR1− cells expressed genes associated with naïve T cells, such as Il7r and Ccr7 (Table S3) and were enriched for a naïve CD8+ T cell signature (Figure 4G, FDR- adjusted P value=0.011, Kolmogorov-Smirnov) (Kaech et al., 2002), consistent with their
A
uthor Man
uscr
ipt
A
uthor Man
uscr
ipt
A
uthor Man
uscr
ipt
A
uthor Man
uscr
ipt
naïve-like functional properties (Figure 4B–D). Within the two Slamf7hi subsets, the CX3CR1− subsets showed enrichment for a signature of CD127hi memory-precursor CD8+ T cells (Joshi et al., 2007) (FDR- adjusted P value =0.012, Kolmogorov-Smirnov) (Figure 4H) and other CD8+ T cell memory signatures (Figure 4I). Conversely, signatures of CD127lo effector CD8+ T cells, and of effector and KLRG1hi terminal effector CD8+ T cells were enriched in the Slamf7hiCX3CR1+ subset (Figure 4H, FDR- adjusted P value =0.027, Kolmogorov-Smirnov), as was a signature of dysfunctional CD8+ TILs (Figure 4I), suggesting that this subset was further along the trajectory for developing a dysfunctional phenotype. Thus, CD62L−Slamf7hiCX3CR1−PD-1−CD8+ TILs maintained
polyfunctionality and potentially contained memory precursors, whereas CD62L
−Slamf7hiCX3CR1+PD-1−CD8+ TILs more closely resembled terminal KLRG1hiCD127lo
effector CD8+ T cells that may eventually develop a dysfunctional phenotype. In light of these data, the CD62LhiSlamf7−PD-1−CD8+ subset is hereafter referred to as naive-like, the CD62L−Slamf7hiCX3CR1−PD-1−CD8+ subset as memory-precursor-like, and the CD62L
−Slamf7hiCX3CR1+PD-1−CD8+ subset as effector-like.
Shifts in PD-1−CD8+ TIL subsets in response to various immunotherapies in different cancers
We next examined the changes in the naïve-, memory-precursor-, and effector-like PD-1−CD8+ TIL subsets over the course of Tim-3+PD-1 blockade in MC38-OVA tumor-bearing mice. We found a significant decrease in the naïve-like and increase in the memory-precursor- and effector-like PD-1− subsets upon Tim-3+PD-1 blockade (Figure 5A and S2). The increased frequencies of the memory-precursor- and effector-like PD-1− subsets were due to augmented proliferation of tumor-antigen specific T cells as evidenced by the higher frequency of Ki67+ and OVA-specific CD8+ TILs (Figure 5B and 5C). In line with our previous data (Figure 4E), we did not observe OVA-specific CD8+ TILs within the naive-like subset (Figure 5C). Together these data indicated that tumor antigen-specific CD8+ T cells within the memory-precursor and effector-like PD-1−CD8+ TILs expanded upon checkpoint blockade.
We next addressed whether similar shifts within PD-1−CD8+ TILs were detected in response to different therapies and in different tumor types. We examined CTLA-4+PDL1 blockade in MC38-OVA and observed increases in the memory-precursor- and effector-like subsets (Figure 5D). We further confirmed these findings in B16F10 melanoma-bearing mice treated with CTLA-4+PD-1 blockade (Figure 5E) and Tim-3+PD-1 blockade (Figure S2B). These data indicate that our observations are generalizable to other checkpoint blockade therapies and other cancer types and show that the changes in PD-1−CD8+ TILs are not due to antibody-induced PD-1 down-modulation on the surface of CD8+ TILs.
Checkpoint blockade-induced memory and effector-like transcriptional programs in murine and human cancer
To determine whether changes in the naïve-, memory-precursor-, and effector-like PD-1−TIL subsets captured all of the changes occuring within PD-1− CD8+ TILs after checkpoint blockade, we performed scRNA-Seq of PD-1−CD8+ TILs from MC38-OVA tumor-bearing mice treated with Tim-3+PD-1 blockade or isotype control. We found a major shift in the
A
uthor Man
uscr
ipt
A
uthor Man
uscr
ipt
A
uthor Man
uscr
ipt
A
uthor Man
uscr
ipt
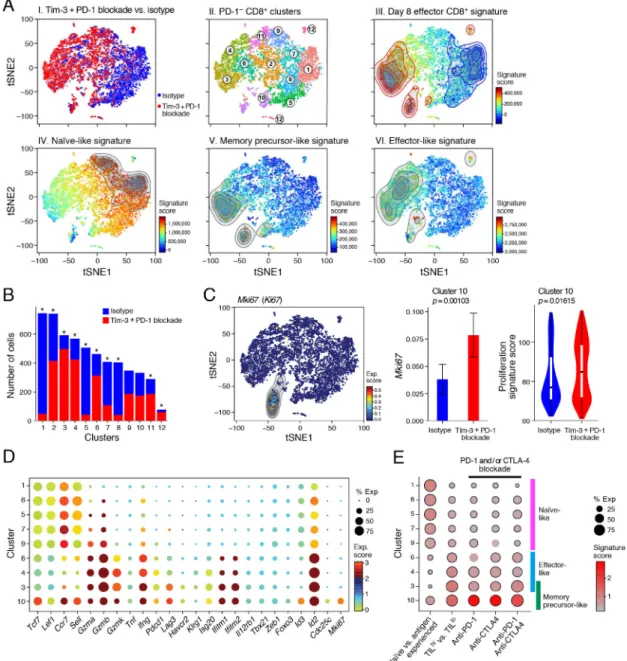
proportion of cells in different transcriptional clusters (Figure 6A, panel I). Unsupervised clustering of the cells’ profiles showed that all clusters had representation from both treated and control mice, but at dramatically different proportions (Figure 6A, panel I and II, 6B and S3A). Clusters 1,5,7, and 8 were enriched for cells from isotype-treated mice while clusters 3,4, and 6 were enriched for cells from Tim-3+PD-1 blockade-treated mice. Indeed, clusters 3, 4, and 6 were also enriched for cells expressing an effector CD8+ T cell signature (Kaech et al., 2002) (Figure 6A, panel III). Scoring the single cells with the signatures of the three new subsets revealed that Tim-3+PD-1 blockade shifted the proportions within PD-1−CD8+ TILs from naïve-like cells to cells expressing memory-precursor-and effector-like signatures (Figure 6A and S3B). Overall, PD1− TILs spanned a spectrum from naïve- (Figure 6A, panel IV) to memory-precursor (Figure 6A, panel V) and effector-like (Figure 6A, panel IV) cells, and cells from isotype- or Tim-3+PD-1 blockade-treated mice were enriched at opposite ends of this spectrum. We further found enrichment of IFNγ, IL-6, and IFN-β signatures and, to a lesser degree, an IL-12 signature in cells from Tim-3+PD-1 blockade-treated mice (Figure S3C), indicating that Tim-3+PD-1 blockade elicited a pro-inflammatory TME that expanded effector PD-1− CD8+ TILs.
Clustering further highlighted subtler distinctions, including naïve-like cells that began to adopt features of effector cells and highly proliferative cells that retained features of memory. Specifically, the naïve-like signature was expressed in cells from clusters 1, 5, 8, 7 and 9, (Figure 6D and S3D), but only cells in cluster 9, which had equal proportions of isotype- and Tim-3+PD-1 blockade-treated cells (Figure 6B and S3A), also expressed several effector genes including Gzma, Gzmb, and Ifng (Figure 6D). Cluster 10 cells exhibited high expression of the memory-precursor-like signature and was equally
comprised of cells from both treatment groups (Figure 6A, panel V, Figure 6B and S3A), but a larger proportion of cells from the Tim-3+PD-1 blockade group expressed Mki67, as well as a proliferation signature (Tirosh et al., 2016) (Figure 6C). The cells in cluster 10 also expressed Tcf7, Lef1, Ccr7, and Sell together with several effector T cell genes (Figure 6D). Thus, Tim-3+PD-1 blockade induced cells within cluster 10 that are highly proliferative, exhibited features of effector cells, and retained features of naïve/memory cells.
We next addressed whether the memory-precursor- and effector-like subsets that expand after therapy have relevance in human cancer. We found that TILhi and CD103hi TRM
signatures that have been associated with better prognosis in NSCLC patients (Ganesan et al., 2017) were enriched for the memory-precursor-like signature relative to the effector-like signature (Figure S4A). Additional signatures correlated with TILs persistence and durable responses (Haymaker et al., 2015; Li et al., 2010) were also enriched for the memory-precursor-like signature (Figure S4A). In accordance with these findings, scoring of our PD-1−CD8+ TILs scRNA-seq profiles also showed that the memory-precursor- and effector-like clusters (3,4,6, and 10) were enriched for the TILhi vs TILlo signature (Ganesan et al., 2017) (Figure 6E and S4B). In particular, the memory-precursor-like cluster 10 was enriched for a signature of CD8+ T cells from either anti-PD-1 (nivolumab), anti-CTLA-4
(ipilimumab), or anti-CTLA-4+anti-PD-1−treated cancer patients (Das et al., 2015) (Figure 6E and S4B). Conversely, a signature of genes differentially expressed between naïve vs. antigen experienced CD8+ T cells obtained from the peripheral blood of melanoma patients (Baitsch et al., 2011) was enriched in the naïve-like clusters (1,5,7,8, and 9). Thus, the
A
uthor Man
uscr
ipt
A
uthor Man
uscr
ipt
A
uthor Man
uscr
ipt
A
uthor Man
uscr
ipt
effector- and memory-like PD-1−CD8+ TILs we defined shared features with human T cells associated with better prognosis and response to checkpoint blockade.
Tcf7/Tcf1 is required for effective anti-tumor responses upon immunotherapy
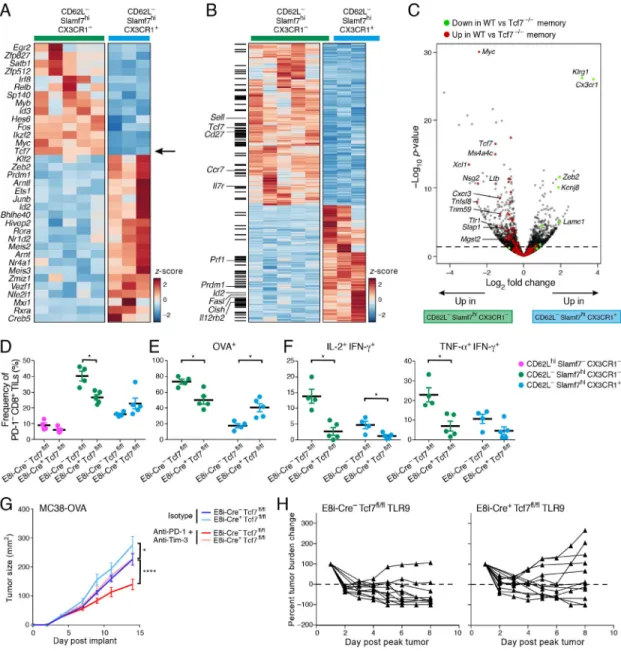
We hypothesized that the memory-precursor-like subset may be essential to sustain long-lasting anti-tumor effector CD8+ T cell responses. To test this, we identified candidate regulators of the memory-precursor-like PD-1−CD8+ TIL subset by focusing on transcription factors that were more highly expressed in CD62L−Slamf7hiCX3CR1− vs. CX3CR1+ PD-1− CD8+ TILs (Figure 7A). Tcf7, which encodes Tcf1/TCF1 was of key interest given its role in self-renewal and maintenance of memory CD8+ T cells (Jeannet et al., 2010; Zhou et al., 2010) and recent studies showing its requirement for the expansion of PD-1+CD8+ T cells after PD-L1 blockade (Im et al., 2016; Utzschneider et al., 2016). Tcf1 was indeed more highly expressed in the memory-precursor-like subset compared to the effector-like subset of PD-1−CD8+ TILs (Figure S5A). Moreover, Tcf1 transcriptional targets, either selected from Tcf1 chromatin-immunoprecipitation sequencing (ChIP-Seq) data on naïve CD8+ T cells (Steinke et al., 2014) or from RNA profiling of WT vs. Tcf7-deficient TCR-transgenic memory CD8+ T cells (Zhou et al., 2010), were enriched in genes differentially expressed between the memory and effector-like subsets (Figure 7B,C). To determine the role of Tcf1 selectively in CD8+ TILs, we generated mice that harbored deletion of Tcf7 in mature CD8+ T cells by crossing Tcf7flox/flox mice with mice that expressed Cre recombinase under the E8I promoter (Maekawa et al., 2008). We did not observe any gross defects in T cell development or in the peripheral T cell compartment in these mice (Figure S5B). We implanted MC38-OVA and did not observe significant changes in the distribution of Tim-3+PD-1+ and Tim-3−PD-1− TILs in wild type (E8i-Cre-Tcf7fl/fl) vs. E8i-Cre+Tcf7fl/fl mice (data not shown); however, we found a significant decrease in the memory-precursor-like subset within PD-1− CD8+ TILs in E8i-Cre+Tcf7fl/fl mice (Figure 7D). This indicated an essential role for Tcf1 in the development and/or maintenance of the memory-precursor-like subset. We further observed that the frequency of OVA-specific T cells was decreased within the memory-precursor-like subset, shifting the balance towards the effector-like subset of PD-1−CD8+ TILs (Figure 7E). Overall, the frequency of OVA-specific CD8+ TILs was significantly decreased within both PD1− and PD-1+ CD8+ TILs in E8i-Cre+Tcf7fl/fl mice (Figure S6A), suggesting that the defects in the memory-precursor-like subset were propagated to PD-1+CD8+ TILs. Lastly, the poly-functionality of the memory-precursor-like subset in response to tumor antigen stimulation was reduced in the absence of Tcf1 (Figure 7F). Together these data indicated that both the maintenance and functionality of tumor antigen-specific memory-precursor-like PD-1− cells was impaired in the absence of Tcf1 and that the defects in these cells extended to the bulk CD8+ T cell pool. Our results indicated that the memory-precursor-like PD-1−CD8+ TIL subset expanded upon Tim-3+PD-1 blockade, potentially providing a wave of effector CD8+ T cells able to sustain an effective anti-tumor response. Given that Tcf1 regulates the maintenance of this subset, we hypothesized that Tcf1 may be essential for effective immunotherapy. To test this, we treated MC38-OVA tumor-bearing WT and E8i-Cre+Tcf7fl/fl mice with anti Tim-3+PD-1 or isotype control antibodies. Supporting our hypothesis, the efficacy of Tim-3+PD-1 blockade
A
uthor Man
uscr
ipt
A
uthor Man
uscr
ipt
A
uthor Man
uscr
ipt
A
uthor Man
uscr
ipt
was lost in E8i-Cre+Tcf7fl/fl mice (Figure 7G). Of note, isotype treated E8i-Cre+Tcf7fl/fl mice showed accelerated tumor growth compared to controls. Given our data indicating an enrichment in pro-inflammatory cytokine (IFNβ, IL-16, IL-12, and IFNγ) signatures in PD-1− CD8+ TIL subsets after checkpoint blockade (Figure S3C), we next examined whether Tcf1 was required for the efficacy of a Toll-like receptor 9 (TLR9) agonist (IMO-2125, currently in clinical development) that induces pro-inflammatory cytokines (IL-12, Type 1 IFN, and IL-6) (Makowska et al., 2013) in the TME and resulted in complete regression of MC38-OVA tumors in WT mice (Figure S6B,C). We treated MC38-OVA tumor-bearing WT and E8i-Cre+Tcf7fl/fl mice with the TLR9 agonist and found that while this therapy induced an effective anti-tumor response in WT mice, it failed in E8i-Cre
+Tcf7fl/fl mice (p=0.0361, Figure 7H). Thus, Tcf1 expression in CD8+ T cells was required
for the generation of effective anti-tumor immunity in response to different immunotherapies.
Discussion
We used an integrated experimental and computational approach to show that checkpoint blockade therapy recruited cells that lack expression of PD-1 and other checkpoint receptors. We identified three subsets of PD-1−CD8+ TILs that had features of naïve,
memory-precursor, or effector CD8+ T cells and showed that different checkpoint blockade therapies across different cancers induced expansion of the memory-precursor-and effector-like PD-1−CD8+ TIL subsets with concomitant decrease in the naïve-like subset. We further showed that the memory-precursor-like subset was compromised in the absence of Tcf7 and shared features with CD8+ T cells that correlate with better prognosis and with response to checkpoint blockade in cancer patients, highlighting the clinical relevance of our findings. The discovery of PD-1−CD8+ T cell subsets that change in response to immunotherapy is important in light of the recent studies describing a population of PD-1+CD8+ T cells that expresses CXCR5 and provides the proliferative burst after PD-1 blockade during chronic viral infection (Im et al., 2016). Indeed, several studies have described similar subsets of PD-1+CD8+ T cells in the context of chronic viral infection and cancer (Brummelman et al., 2018; Leong et al., 2016; Philip et al., 2017; Utzschneider et al., 2016). These PD-1+CD8+ T cells and the memory-precursor-like subset that we identify share some important features. They express Tcf1 and are proliferative. However, that the memory-precursor-like CD8+ TIL subset does not express PD-1 indicates that this subset is earlier along the T cell activation and differentiation trajectory. This could be critically important, as several recent studies have shown that PD-1+CD8+ T cells under chronic stimulation undergo chromatin remodeling, resulting in a fixed epigenetic profile that limits their potential to be
reprogrammed in response to interventions such as checkpoint blockade (Ghoneim et al., 2017; Pauken et al., 2016; Philip et al., 2017; Scott-Browne et al., 2016). Conversely, the memory-precursor-like PD-1− CD8+ TIL subset likely contains earlier precursors that have a better capacity to persist and continuously seed the effector T cell pool to sustain long-term responses. The presence of sufficient numbers of such CD8+ TILs can be advantageous in the setting of cancer and chronic viral infection where checkpoint blockade therapy takes the brakes off chronically stimulated T cells, thereby accelerating the T cell activation and differentiation trajectory towards activation-induced cell death.
A
uthor Man
uscr
ipt
A
uthor Man
uscr
ipt
A
uthor Man
uscr
ipt
A
uthor Man
uscr
ipt
Our data showed that in the absence of Tcf7/Tcf1 the memory-precursor-like subset was compromised and different immunotherapies failed. These results underscore the importance of maintaining such a TIL subset and of understanding the mechanisms underlying its regulation by Tcf7. Future adoptive transfer experiments will be required to directly
demonstrate the potential of this subset to sustain effective and durable anti-tumor responses upon immunotherapy. Nonetheless, the recent demonstration that PD-1− CAR-T cells having features of memory-like cells are predictive of complete remission in cancer patients and that an analogous population is required for tumor control in mice (Fraietta et al., 2018) supports the relevance of PD-1− cells with memory like features.
In addition to changes in PD-1+CD8+ TILs, our data show that checkpoint blockade therapy also induces changes in PD-1− CD8+ TILs, which can contribute to the therapeutic effect. This could occur through a direct therapy-mediated effect on CD4+ regulatory T cells (Treg), as CTLA-4 is constitutively expressed on Treg and Tim-3 is highly expressed on tumor-infiltrating Tregs (Sakuishi et al., 2013). Checkpoint blockade can also act on cells of the innate immune system. Tim-3 blockade can improve the function of natural killer cells from melanoma patients (da Silva et al., 2014). Anti-Tim-3 and anti-PD-1 or PD-L1 antibodies can affect the phenotype of myeloid cells in the TME, abrogating the acquisition of an M2-like phenotype in tumor-associated macrophages (TAMs) (Jiang et al., 2016) and inducing Type 1 IFN, IL-12 and IFN-γ in CD103+ dendritic cells (DCs) in breast cancer (de Mingo Pulido et al., 2018). Similarly, PD-1 or PD-L1 blockade can promote the release of pro-inflammatory cytokines by DCs in ovarian cancer (Krempski et al., 2011; Lim et al., 2016)). These findings are in line with our observation that Type 1 IFN, IL-12, and IFN-γ signatures were induced in the effector- and memory-precursor like PD-1−CD8+ TILs from treated mice. Thus, checkpoint blockade can act on different immune cell types within the TME to promote anti-tumor CD8+ T cell responses.
Our findings identify changes in PD-1−CD8+ TILs in response to checkpoint blockade immunotherapy. In particular, the identification of PD-1−CD8+ memory-precursor-like TILs that share features with human CD8+ T cells associated with good prognosis and response to therapy has important clinical implications for the identification of biomarkers of therapeutic response, as well as of targets that can be modulated in T cells used for adoptive cell
therapies to ensure sustained and durable responses.
STAR METHODS
Contact for reagent and resource sharing
Requests for reagents should be directed to Ana C. Anderson at [email protected]
EXPERIMENTAL MODEL AND SUBJECT DETAILS
Mice6–8 week old C57BL/6 and Rag−/− mice were purchased from the Jackson Laboratories. Embryonic stem cells with a targeted Tcf7 gene were obtained from Eucomm. Embryonic stem cells were injected into blastocysts to obtain chimeras. Presence of the targeted Tcf7
A
uthor Man
uscr
ipt
A
uthor Man
uscr
ipt
A
uthor Man
uscr
ipt
A
uthor Man
uscr
ipt
locus was confirmed by Southern Blot. Chimeras were bred to mice that transgenically express flpO recombinase (MMRC, UC Davis) to remove the neomycin cassette and then bred with mice that express Cre recombinase under the CD8 Enhancer I (E8I-Cre) that was previously described (Maekawa et al., 2008). E8I is activated after the single positive CD8+ T cell stage in the thymus (Ellmeier et al., 1997) allowing deletion only in CD8+ T cells. All experiments were approved and conducted according to the guidelines set forth by the Harvard Medical Area Standing Committee on Animals.
Tumor experiments
MC38-OVA cell line was derived from MC38 as previously described (Gilfillan et al., 2008). MC38-OVA (0.5×10⁶) cells were implanted subcutaneously into the right flank. Tumor size was measured in two dimensions by caliper and is expressed as the product of two
perpendicular diameters. In some experiments, mice were treated with 200 μg of anti-Tim-3 (RMT3–23) and 100 g of anti-PD-1 (RMP1–14) antibodies or 200 μg of control
immunoglobulin (Rat IgG2a) i.p. on days 4, 7 and 10 post tumor implant. Mice were either monitored for tumor growth or sacrificed on day 12 for functional and transcriptional analysis. The B16F10 cell line was purchased from ATCC. B16F10 (0.2×10⁶) cells were implanted subcutaneously into the right flank. Tumor size was measured as described above. For Tim-3+PD-1 blockade, mice were treated with 200 μg of anti-Tim-3 (RMT3–23) and 200 μg of anti-PD-1 (RMP1–14) antibodies or control immunoglobulin (Rat IgG2a) i.p. on days 4, 7, and 10 post tumor implant. For CTLA-4+PD-1 blockade, mice were treated with 200 μg of anti-CTLA4 (9H10) and 200 μg of anti-PD-1 (RMP1–14) or 200 g of each control immunoglobulin (Syrian hamster IgG and Rat IgG2a, respectively) i.p. on days 4, 7, and 10 post tumor implant. For CTLA-4 and PD-L1 blockade experiments, mice were injected with 100ug (MC38-OVA model) or 200ug (B16F10 model) of anti-CTLA-4 (9H10) and 200ug of PD-L1 (10F.9G2) or 200 μg of control immunoglobulin (Syrian hamster polyclonal IgG), i.p. on days 4, 7 and 10 (MC38-OVA model) or 3, 6 and 9 (B16 model) post tumor implant. Mice were sacrificed on day 11 for analysis by flow cytometry. In some experiments, mice were treated with either PBS or 2 mg/kg of a TLR9 agonist (IMO-2125 provided by Sudhir Agrawal of Idera Pharmaceuticals under MTA) by intra-tumoral injection on days 4, 7, 10, and 13 post tumor implant. % Tumor burden change is calculated as % change in tumor size compared to the peak tumor size (day 8–10). For response to treatment, a threshold of ≥30% decrease in reference to baseline is considered (Nishino et al., 2016). For adoptive cell transfer experiments, PD1+ or PD1− TILs were sorted from Tim-3+PD-1-treated C57BL/6 mice bearing MC38-OVA tumors at 12 days upon tumor injection. A total of 105 sorted cells were transferred intravenously into RAG KO donor mice that were injected subcutaneously with MC38-OVA tumors the same day.
METHOD DETAILS
Isolation of Tumor Infiltrating Lymphocytes (TILs)
TILs were isolated by dissociating tumor tissue in the presence of collagenase D (2.5 mg/ml) for 20 min prior to centrifugation on a discontinuous Percoll gradient (GE Healthcare). Isolated cells were then used in various assays of T cell function (below).
A
uthor Man
uscr
ipt
A
uthor Man
uscr
ipt
A
uthor Man
uscr
ipt
A
uthor Man
uscr
ipt
Flow cytometry
Single cell suspensions were stained with antibodies against TCRβ (H57–597), CD8 (53– 6.7), PD-1 (RMP1–30), Tim-3 (5D12), CX3CR1 (SA011F11), CD319 (4G2), KLRG1 (MAFA) and CD62L (MEL-14). Fixable viability dye eF506 (ebioscience) or Zombie UV fixable viability dye (Biolegend) was used to exclude dead cells. All data were collected on a BD Fortessa (BD Biosciences) and analyzed with FlowJo software (Tree Star). To assess OVA-specific CD8+ cells, TILs were stained with H-2Kb-OVA257–264 dextramers
(Immudex) and then stained with surface antibodies. To determine Tcf1 protein levels, TILs were stained with surface antibodies then fixed and permeabilized with eBioscience Transcription Factor Staining Buffer Set. Cells were then stained with anti-Tcf1 antibody (C63D9) followed by fluorescently tagged anti-Rabbit IgG (Cell Signaling). For intra-cytoplasmic cytokine staining, cells were stimulated in vitro with 5 g/ml OVA257–264 peptide
for 3.5 hrs in the presence of Golgi stop (BD Biosciences). Cells were then harvested and stained with antibodies against surface proteins prior to fixation and permeabilization. Permeabilized cells were then stained with antibodies against IL-2 (JES6–5H4), TNF-α (MP6-XT22) and IFN-γ (XMG1.2). For Granzyme B staining, TILs were stained with antibodies against surface proteins prior to fixation and permeabilization. Permeabilized cells were then stained with antibody against Granzyme B (2C5/F5). For CD107a staining, TILs were stimulated in vitro with 5 μg/ml OVA257–264 peptide for 3.5 hrs in the presence of
Golgi stop and an antibody against CD107a (1D4B). Cells were then harvested and stained with antibodies against surface proteins. To assess cell proliferation, TILs were stained with surface antibodies and fixed/permeabilized with eBioscience Transcription Factor Staining Buffer Set and stained with the antibody against Ki67 (SolA15).
Population RNA-seq
On day 12 post tumor implantation, Tim-3+PD-1+ and Tim-3−PD-1− CD8+ TILs were isolated by cell sorting (BD FACS Aria II) from MC38-OVA tumor-bearing mice that were treated with anti-PD-1 and anti-Tim-3 antibodies or isotype controls. Isolated cells were immediately lysed in RLT Plus lysis buffer (Qiagen). In another set of experiments, TILs were isolated from MC38-OVA bearing mice. CD62Lhi CD319−, CD62L− CD319+ CX3CR1− and CD62L− CD319+ CX3CR1− CD8+ T cells from TILs were sorted by BD FACS Aria II and were immediately lysed in RLT buffer (Qiagen). In all cases, full-length RNA-seq libraries were prepared as previously described (Picelli et al., 2013) using the SMART-seq2 protocol with reduced PCR cycle number (12–15 cycles) and one-fourth of the standard Illumina Nextera XT reaction volume, followed by paired-end Illumina sequencing (38bp × 2) with a 75 cycle Nextseq 500 high output V2 kit.
Population RNA-Seq data pre-processing
RNA-seq reads were aligned using Tophat (Trapnell et al., 2009) (to mouse genome version mm9), and expression levels were calculated using RSEM (Li and Dewey, 2011) using known transcripts (mm9), followed by further processing using the Bioconductor package DESeq in R (Anders and Huber, 2010). The data was normalized using TMM normalization, and differentially expressed genes were defined using the differential expression pipeline on the raw counts with a single call to the function DESeq (FDR-adjusted P value <0.05).
A
uthor Man
uscr
ipt
A
uthor Man
uscr
ipt
A
uthor Man
uscr
ipt
A
uthor Man
uscr
ipt
Heatmap figures were generated using pheatmap package (Kolde and Vilo, 2015). To quantify the global genomic changes in Tim-3−PD-1− and Tim-3+PD-1+ sub-populations CD8+ TILs following treatment, we calculated the Euclidean distance between each pair of profiles, we then compared the difference in Euclidean distance between the isotype and Tim-3+ PD-1 blockade treated groups for the Tim-3−PD-1− and Tim-3+PD-1+ cells.
Plate-based CD8+ TILs single-cell RNA-Seq
CD8+ TILs data was obtained from (Singer et al., 2016), where it was collected in 96 well plates.
Plate-based single-cell RNA-seq data processing
Initial preprocessing was performed as described in (Singer et al., 2016). Briefly, paired reads were mapped to mouse annotation mm10 using Bowtie (Langmead et al., 2009) (allowing a maximum of one mismatch in seed alignment, and suppressing reads that had more than 10 valid alignments) and TPMs were computed using RSEM (Li and Dewey, 2011), and log2(TPM+1) values were used for subsequent analyses. Next, we filtered out
low quality cells and cell doublets, maintaining for subsequent analysis the 588 cells that had (1) 1,000–4,000 detected genes (defined by at least one mapped read), (2) at least 200,000 reads mapped to the transcriptome, and (3) at least 50% of the reads mapped to the transcriptome. Here, we restricted the genes considered in subsequent analyses to be the 7,790 genes expressed at log2(TPM+1)≥2 in at least ten percent of the cells. After removal
of low quality cells/genes, the data were normalized using quantile normalization followed by PCA. PCs 1–8 were chosen for subsequent analysis due to a drop in the proportion of variance explained following PC8. We used tSNE (Maaten L, 2008) to visualize single cells in a two-dimensional non-linear embedding.
Gene signatures
Mouse: CD8+TILs dysfunction signature (Figure 1A and 4I) was generated by using the differentially expressed genes between Tim-3−PD-1− and Tim-3+PD-1+ CD8+ TILs from MC38-OVA (FDR- adjusted P value <0.05 3,382 DE genes; Bioconductor package DESeq2 (Love et al., 2014)). CD8+TILs treatment signature for Tim-3−PD-1− (DN) and
Tim-3+PD-1+ (DP) CD8+ TILs (Figure 1 and 3) was generated by using the differentially expressed genes between CD8+TILs from MC38-OVA bearing mice treated with anti-PD1+anti-Tim-3 and isotype control (FDR-adjusted P value <0.2, 608 and 364 DE genes respectively). CD8+ T cell effector signatures (Figure 1) were downloaded from MSigDB: Day 4.5 effector CD8+ T cell and KLRG1hi CD8+ T cell signatures (Sarkar et al., 2008), Day 3 effector CD8+ T cell (Kalia et al., 2010), for day 8 effector CD8+ T cell, (Kaech et al., 2002), and for in vitro activated CD8+ T cells (Hervas-Stubbs et al., 2010).
Cytokine signatures (Figure S3): IFN-γ and IFN-β signatures were from (Iwata et al., 2017)-table S2, which lists DE genes between naïve CD4+T cells after 6h, 24h and 72h with or without cytokine treatment. IL-6 signature was defined by differentially expressed genes between cytokine treated and non-treated naïve CD4+T cells for 72h using RNAseq data from (Hirahara et al., 2015) (FDR- adjusted P value <0.05, 116 DE genes; bioconductor package DESeq2 (Love et al., 2014)). IL-12 signature was defined by differentially
A
uthor Man
uscr
ipt
A
uthor Man
uscr
ipt
A
uthor Man
uscr
ipt
A
uthor Man
uscr
ipt
expressed genes between CD8+ T cells stimulated with or without IL-12 for 48h using microarray data from (Agarwal et al., 2009) (P value < 0.05 and log2(fold change) > 0.7, 527
DE genes, Limma package).
Gene sets for naïve cells (Figure 4G) were downloaded from MSigDB (Kaech et al., 2002). Microarray dataset of memory-precursor and effector CD8+ T cell data was downloaded from (Joshi et al., 2007) (Figure 4H). Limma package was used to estimate the fold changes and standard errors by fitting a linear model for each gene for the assessment of differential expression (p.value < 0.05 and log2(fold change) > 2, 2,036 DE genes). CD8+ T cells
signatures were downloaded from MSigDB. For KLRG1hi versus KLRG1int and memory versus day 4.5 effector (Sarkar et al., 2008), day 8 and day 15 effector versus memory CD8+ T cells is from (Kaech et al., 2002) and another effector versus memory CD8+ T cell signature is from (Luckey et al., 2006) (Figure 4I).
Tcf7 ChIP-Seq data (Figure 7B) for naïve CD8+ T cells was downloaded from (Steinke et al., 2014). ChIPpeakAnno R package (Zhu et al., 2010) was used to annotate CHIP-Seq peaks to gene promoter regions based on the following thresholds (upstream=1000, downstream=500 of TSS). Microarray gene expression data from Tcf7−/− memory CD8+ T cells (Figure 7C) was downloaded from (Zhou et al., 2010). Limma package was used for the assessment of differential expression (p-value < 0.05 and log2(fold-change > 0.7), 253
DE genes).
Human: Gene sets used for TILhi vs TILlo and CD103hi and CD103lo (Figure S4A and Figure 6E) signatures are from n=36 NSCLC patients (Ganesan et al., 2017) (Tables S6 and S7). CD28+ vs CD28− CD8+ TILs microarray data are from n=3 expanded TIL lines (Li et al., 2010) and BTLA+ vs BTLA− CD8+ TILs microarray data are from n=5 melanoma patients (Haymaker et al., 2015) (Figure S4A). Limma package was used for the assessment of differential expression (p value < 0.05 and log2(fold change) > 0.7, 1146 and 124 DE
genes respectively). Proliferation signature is taken from (Tirosh et al., 2016) (Figure 6C). Gene sets for naïve (n=13) vs antigen-specific CD8+ T cells (n=19) are from (Baitsch et al., 2011). Microarray data of blood CD8+ T cells after anti-CTLA-4 (n=5), anti-PD-1 (n=6), or anti-PD-1+anti-CTLA-4 (n=6) treatment was downloaded from (Das et al., 2015) (Figure 6E and S4B). Limma package was used for the assessment of differential expression (p value < 0.05, 548, 244 and 800 DE genes respectively).
Single-cell gene signature scoring
As an initial step, the data was scaled (z-score across each gene) to remove bias towards highly expressed genes. Given a gene signature (list of genes), a cell-specific signature score was computed by first sorting the normalized scaled gene expression values for each cell followed by summing up the indices (ranks) of the signature genes. For gene-signatures consisting of an upregulated and downregulated set of genes, two ranking scores were obtained separately, and the down-regulated associated signature score was subtracted from the up-regulated generated signature score. A contour plot was added on top of the tSNE space, which takes into account only those cells that have a signature score above the indicated threshold to further emphasis the region of highly scored cells.
A
uthor Man
uscr
ipt
A
uthor Man
uscr
ipt
A
uthor Man
uscr
ipt
A
uthor Man
uscr
ipt
As background to assess significance, we used a scheme that controls for expression of the signature using expression-level-matched subsets of genes. The p-value for each cell is calculated by generating random sets of signatures that are composed of genes with a similar average and variance expression levels as the original signature. This was followed by comparing the generated scores to the score obtained from the original signature. Cells that had a statistically significant score (FDR- adjusted P value <0.05) were marked by ‘+’ (Fig. S4B). Statistical significance for the human signatures for each of the clusters in Figure 6E was calculated by averaging the human signature scores across the cells that compose each cluster and comparing them to random sets of signatures as described above. Clusters that had a statistically significant score (FDR- adjusted P value <0.05) were marked by ‘+’ (Figure S4B).
Droplet-based single-cell RNA-Seq of Tim-3−PD-1− CD8+ TILs
Tim-3−PD-1− CD8+ TILs were sorted from MC38-OVA tumor-bearing mice that were treated with anti-PD-1 and anti-Tim-3 antibodies or isotype controls and were encapsulated into droplets, and libraries were prepared using Chromium Single Cell 3′ Reagent Kits v2 according to manufacturer’s protocol (10× Genomics). The generated single cell RNA-seq libraries were sequenced using a 75 cycle Nextseq 500 high output V2 kit.
Droplet-based single-cell RNA-Seq data processing
Gene counts were obtained by aligning reads to the mm10 genome using CellRanger software (v1.3 10× Genomics). To remove doublets and poor-quality cells, we removed cells that contained more than 10% mitochondrially derived transcripts, or where less than 500 genes were detected. Among the retained cells, we considered only genes that are present in >30 cells and have >60 transcripts summed across all the selected cells, yielding 5,457 cells and 9,505 genes. Transcript count for each library was normalized to the median of the transcript counts across all cells. For PCA and clustering, we used a log-transformed expression matrix. The top 13 PCs were included for subsequent tSNE analysis, determined by a drop in the proportion of variance explained by subsequent PCs. We confirmed that the resulting analyses were not particularly sensitive to this choice.
Single cell RNA-seq clustering
Cells were clustered based on their top 13 PCs scores using the Louvain-Jaccard graph clustering algorithm (Blondel et al., 2008) as previously described (Levine et al., 2015; Shekhar et al., 2016). Shifts in the distribution of Tim-3−PD-1− CD8+ TILs from mice treated with anti-PD-1 and anti-Tim-3 antibodies or isotype controls for each of the clusters were calculated using Fisher’s exact test.
Differentially expressed genes between clusters
We used a binomial test to find genes differentially expressed (DE) between clusters, as previously described (Shekhar et al., 2016). To find marker genes for subpopulation A against all the other cell types in the data, we pooled the cells from all the subpopulations except A, and regarded this pool as subpopulation B. We corrected for multiple hypothesis
A
uthor Man
uscr
ipt
A
uthor Man
uscr
ipt
A
uthor Man
uscr
ipt
A
uthor Man
uscr
ipt
testing with a Benjamini-Hochberg FDR. A gene was considered statistically significant if it satisfied FDR < 0.01.
Visualization of single cell data
To generate tSNE plots (Maaten L, 2008) of single cell profiles, the scores along the 13 significant PCs estimated above were used as input to the R implementation of tSNE (Maaten, 2009; Maaten L, 2008) for 1000 steps and setting the perplexity parameter to 50. Expression patterns of selected genes across cell clusters are shown in dot plots, which depict the fraction of cells in a cluster (row) that express a particular gene (column) based on the size of the dot, and the average number of transcripts in the expressing cells indicated by the color scale. We plotted the expression of selected cell surface, cytokines and
transcription factor markers.
Gene Set Enrichment Analysis
Gene Set Enrichment Analysis (GSEA) (Mootha et al., 2003; Subramanian et al., 2005) was run for each cell subset in pre-ranked list mode with 1,000 permutations (nominal P-value cutoff < 0.01). Enrichment scores were visualized using the SeqGSEA package in R (Wang and Cairns, 2014).
Quantification and statistical analysis
Values are expressed as mean ± standard error of the mean (SEM) as indicated. Statistical analyses were performed by Linear Regression test, Mann-Whitney test or One-way ANOVA test followed by Tukey’s multiple comparison test, unless otherwise indicated. Differences were considered statistically significant at p < 0.05. Analyses were performed with Prism (GraphPad Prism version 7.0).
Software and data availability
The sequence data genereated in this study have been deposited in the Gene Expression Omnibus (GEO) with the accession code GSEXXX. The software used for the analyses for each of the data platforms and integrated analyses are described and referenced in the individual Method Details subsections.
Supplementary Material
Refer to Web version on PubMed Central for supplementary material.
Acknowledgments
We thank Mary Collins for comments on this manuscript, Deneen Kozoriz for cell sorting, Samantha Riesenfeld for computational advice, Sigrid Knemeyer and Leslie Gaffney for help in figure preparation. IM0–2125 was obtained from Idera Pharmaceuticals under an MTA. This work was supported by grants from the National Institutes of Health (R01NS045937 to VKK, P01AI073748 to VKK and ACA, R01CA187975 to ACA), the American Cancer Society (RSG-11-057-01-LIB to ACA), and by the Klarman Cell Observatory at the Broad Institute and HHMI. A.R. is an Investigator of the Howard Hughes Medical Institute.
A
uthor Man
uscr
ipt
A
uthor Man
uscr
ipt
A
uthor Man
uscr
ipt
A
uthor Man
uscr
ipt
References
Agarwal P, Raghavan A, Nandiwada SL, Curtsinger JM, Bohjanen PR, Mueller DL, and Mescher MF (2009). Gene regulation and chromatin remodeling by IL-12 and type I IFN in programming for CD8 T cell effector function and memory. Journal of immunology 183, 1695–1704.
Ahn E, Youngblood B, Lee J, Lee J, Sarkar S, and Ahmed R (2016). Demethylation of the PD-1 Promoter Is Imprinted during the Effector Phase of CD8 T Cell Exhaustion. Journal of virology 90, 8934–8946. [PubMed: 27466420]
Anders S, and Huber W (2010). Differential expression analysis for sequence count data. Genome biology 11, R106. [PubMed: 20979621]
Baitsch L, Baumgaertner P, Devevre E, Raghav SK, Legat A, Barba L, Wieckowski S, Bouzourene H, Deplancke B, Romero P, et al. (2011). Exhaustion of tumor-specific CD8(+) T cells in metastases from melanoma patients. The Journal of clinical investigation 121, 2350–2360. [PubMed: 21555851]
Blondel VD, Guillaume J, Lambiotte R, and Lefebvre E (2008). Fast unfolding of communities in large networks. Journal of Statistical Mechanics: Theory and Experiment 2008, P10008.
Bottcher JP, Beyer M, Meissner F, Abdullah Z, Sander J, Hochst B, Eickhoff S, Rieckmann JC, Russo C, Bauer T, et al. (2015). Functional classification of memory CD8(+) T cells by CX3CR1 expression. Nature communications 6, 8306.
Brummelman J, Mazza EMC, Alvisi G, Colombo FS, Grilli A, Mikulak J, Mavilio D, Alloisio M, Ferrari F, Lopci E, et al. (2018). High-dimensional single cell analysis identifies stem-like cytotoxic CD8(+) T cells infiltrating human tumors. The Journal of experimental medicine.
da Silva IP, Gallois A, Jimenez-Baranda S, Khan S, Anderson AC, Kuchroo VK, Osman I, and Bhardwaj N (2014). Reversal of NK-cell exhaustion in advanced melanoma by Tim-3 blockade. Cancer immunology research 2, 410–422. [PubMed: 24795354]
Das R, Verma R, Sznol M, Boddupalli CS, Gettinger SN, Kluger H, Callahan M, Wolchok JD, Halaban R, Dhodapkar MV, and Dhodapkar KM (2015). Combination therapy with anti-CTLA-4 and anti-PD-1 leads to distinct immunologic changes in vivo. Journal of immunology 194, 950–959. de Mingo Pulido A, Gardner A, Hiebler S, Soliman H, Rugo HS, Krummel MF, Coussens LM, and
Ruffell B (2018). TIM-3 Regulates CD103(+) Dendritic Cell Function and Response to Chemotherapy in Breast Cancer. Cancer cell 33, 60–74 e66. [PubMed: 29316433]
Duraiswamy J, Kaluza KM, Freeman GJ, and Coukos G (2013). Dual blockade of PD-1 and CTLA-4 combined with tumor vaccine effectively restores T-cell rejection function in tumors. Cancer research 73, 3591–3603. [PubMed: 23633484]
Ellmeier W, Sunshine MJ, Losos K, Hatam F, and Littman DR (1997). An enhancer that directs lineage-specific expression of CD8 in positively selected thymocytes and mature T cells. Immunity 7, 537–547. [PubMed: 9354474]
Fourcade J, Sun Z, Benallaoua M, Guillaume P, Luescher IF, Sander C, Kirkwood JM, Kuchroo V, and Zarour HM (2010). Upregulation of Tim-3 and PD-1 expression is associated with tumor antigen-specific CD8+ T cell dysfunction in melanoma patients. The Journal of experimental medicine 207, 2175–2186. [PubMed: 20819923]
Fraietta JA, Lacey SF, Orlando EJ, Pruteanu-Malinici I, Gohil M, Lundh S, Boesteanu AC, Wang Y, O’Connor RS, Hwang WT, et al. (2018). Determinants of response and resistance to CD19 chimeric antigen receptor (CAR) T cell therapy of chronic lymphocytic leukemia. Nat Med 24, 563–571. [PubMed: 29713085]
Ganesan AP, Clarke J, Wood O, Garrido-Martin EM, Chee SJ, Mellows T, Samaniego-Castruita D, Singh D, Seumois G, Alzetani A, et al. (2017). Tissue-resident memory features are linked to the magnitude of cytotoxic T cell responses in human lung cancer. Nat Immunol 18, 940–950. [PubMed: 28628092]
Gerlach C, Moseman EA, Loughhead SM, Alvarez D, Zwijnenburg AJ, Waanders L, Garg R, de la Torre JC, and von Andrian UH (2016). The Chemokine Receptor CX3CR1 Defines Three Antigen-Experienced CD8 T Cell Subsets with Distinct Roles in Immune Surveillance and Homeostasis. Immunity 45, 1270–1284. [PubMed: 27939671]
A
uthor Man
uscr
ipt
A
uthor Man
uscr
ipt
A
uthor Man
uscr
ipt
A
uthor Man
uscr
ipt
Ghoneim HE, Fan Y, Moustaki A, Abdelsamed HA, Dash P, Dogra P, Carter R, Awad W, Neale G, Thomas PG, and Youngblood B (2017). De Novo Epigenetic Programs Inhibit PD-1 Blockade-Mediated T Cell Rejuvenation. Cell 170, 142–157 e119. [PubMed: 28648661]
Gilfillan S, Chan CJ, Cella M, Haynes NM, Rapaport AS, Boles KS, Andrews DM, Smyth MJ, and Colonna M (2008). DNAM-1 promotes activation of cytotoxic lymphocytes by nonprofessional antigen-presenting cells and tumors. The Journal of experimental medicine 205, 2965–2973. [PubMed: 19029380]
Gordon SR, Maute RL, Dulken BW, Hutter G, George BM, McCracken MN, Gupta R, Tsai JM, Sinha R, Corey D, et al. (2017). PD-1 expression by tumour-associated macrophages inhibits
phagocytosis and tumour immunity. Nature 545, 495–499. [PubMed: 28514441]
Gubin MM, Zhang X, Schuster H, Caron E, Ward JP, Noguchi T, Ivanova Y, Hundal J, Arthur CD, Krebber WJ, et al. (2014). Checkpoint blockade cancer immunotherapy targets tumour-specific mutant antigens. Nature 515, 577–581. [PubMed: 25428507]
Haymaker CL, Wu RC, Ritthipichai K, Bernatchez C, Forget MA, Chen JQ, Liu H, Wang E, Marincola F, Hwu P, and Radvanyi LG (2015). BTLA marks a less-differentiated tumor-infiltrating
lymphocyte subset in melanoma with enhanced survival properties. Oncoimmunology 4, e1014246. [PubMed: 26405566]
Hervas-Stubbs S, Riezu-Boj JI, Gonzalez I, Mancheno U, Dubrot J, Azpilicueta A, Gabari I, Palazon A, Aranguren A, Ruiz J, et al. (2010). Effects of IFN-alpha as a signal-3 cytokine on human naive and antigen-experienced CD8(+) T cells. European journal of immunology 40, 3389–3402. [PubMed: 21108462]
Hirahara K, Onodera A, Villarino AV, Bonelli M, Sciume G, Laurence A, Sun HW, Brooks SR, Vahedi G, Shih HY, et al. (2015). Asymmetric Action of STAT Transcription Factors Drives
Transcriptional Outputs and Cytokine Specificity. Immunity 42, 877–889. [PubMed: 25992861] Huang AC, Postow MA, Orlowski RJ, Mick R, Bengsch B, Manne S, Xu W, Harmon S, Giles JR,
Wenz B, et al. (2017). T-cell invigoration to tumour burden ratio associated with anti-PD-1 response. Nature 545, 60–65. [PubMed: 28397821]
Im SJ, Hashimoto M, Gerner MY, Lee J, Kissick HT, Burger MC, Shan Q, Hale JS, Lee J, Nasti TH, et al. (2016). Defining CD8+ T cells that provide the proliferative burst after PD-1 therapy. Nature 537, 417–421. [PubMed: 27501248]
Iwata S, Mikami Y, Sun HW, Brooks SR, Jankovic D, Hirahara K, Onodera A, Shih HY, Kawabe T, Jiang K, et al. (2017). The Transcription Factor T-bet Limits Amplification of Type I IFN Transcriptome and Circuitry in T Helper 1 Cells. Immunity 46, 983–991 e984. [PubMed: 28623086]
Jeannet G, Boudousquie C, Gardiol N, Kang J, Huelsken J, and Held W (2010). Essential role of the Wnt pathway effector Tcf-1 for the establishment of functional CD8 T cell memory. Proceedings of the National Academy of Sciences of the United States of America 107, 9777–9782. [PubMed: 20457902]
Jiang X, Zhou T, Xiao Y, Yu J, Dou S, Chen G, Wang R, Xiao H, Hou C, Wang W, et al. (2016). Tim-3 promotes tumor-promoting M2 macrophage polarization by binding to STAT1 and suppressing the STAT1-miR-155 signaling axis. Oncoimmunology 5, e1211219. [PubMed: 27757304]
Joshi NS, Cui W, Chandele A, Lee HK, Urso DR, Hagman J, Gapin L, and Kaech SM (2007). Inflammation directs memory precursor and short-lived effector CD8(+) T cell fates via the graded expression of T-bet transcription factor. Immunity 27, 281–295. [PubMed: 17723218]
Kaech SM, Hemby S, Kersh E, and Ahmed R (2002). Molecular and functional profiling of memory CD8 T cell differentiation. Cell 111, 837–851. [PubMed: 12526810]
Kalia V, Sarkar S, Subramaniam S, Haining WN, Smith KA, and Ahmed R (2010). Prolonged interleukin-2Ralpha expression on virus-specific CD8+ T cells favors terminal-effector differentiation in vivo. Immunity 32, 91–103. [PubMed: 20096608]
Kamphorst AO, Pillai RN, Yang S, Nasti TH, Akondy RS, Wieland A, Sica GL, Yu K, Koenig L, Patel NT, et al. (2017). Proliferation of PD-1+ CD8 T cells in peripheral blood after PD-1−targeted therapy in lung cancer patients. Proceedings of the National Academy of Sciences of the United States of America 114, 4993–4998. [PubMed: 28446615]