Publisher’s version / Version de l'éditeur:
Optical Engineering, 39, 1, pp. 196-211, 2000
READ THESE TERMS AND CONDITIONS CAREFULLY BEFORE USING THIS WEBSITE. https://nrc-publications.canada.ca/eng/copyright
Vous avez des questions? Nous pouvons vous aider. Pour communiquer directement avec un auteur, consultez la première page de la revue dans laquelle son article a été publié afin de trouver ses coordonnées. Si vous n’arrivez pas à les repérer, communiquez avec nous à [email protected].
Questions? Contact the NRC Publications Archive team at
[email protected]. If you wish to email the authors directly, please see the first page of the publication for their contact information.
NRC Publications Archive
Archives des publications du CNRC
This publication could be one of several versions: author’s original, accepted manuscript or the publisher’s version. / La version de cette publication peut être l’une des suivantes : la version prépublication de l’auteur, la version acceptée du manuscrit ou la version de l’éditeur.
For the publisher’s version, please access the DOI link below./ Pour consulter la version de l’éditeur, utilisez le lien DOI ci-dessous.
https://doi.org/10.1117/1.602352
Access and use of this website and the material on it are subject to the Terms and Conditions set forth at
Eye-safe digital 3-D sensing for space applications
Beraldin, J.-A.; Blais, F.; Rioux, M.; Cournoyer, L.; Laurin, D.; MacLean, S.
G.
https://publications-cnrc.canada.ca/fra/droits
L’accès à ce site Web et l’utilisation de son contenu sont assujettis aux conditions présentées dans le site LISEZ CES CONDITIONS ATTENTIVEMENT AVANT D’UTILISER CE SITE WEB.
NRC Publications Record / Notice d'Archives des publications de CNRC:
https://nrc-publications.canada.ca/eng/view/object/?id=b9201f39-3063-499f-af8f-7e87de675e78 https://publications-cnrc.canada.ca/fra/voir/objet/?id=b9201f39-3063-499f-af8f-7e87de675e78National Research Council Canada Institute for Information Technology Conseil national de recherches Canada Institut de Technologie de l’information
Eye-Safe Digital 3-D Sensing for Space Applications
J.-A. Beraldin, F. Blais, M. Rioux, L. Cournoyer, D. Lauri,
and S.G. MacLean
January 2000
Copyright 2001 by
National Research Council of Canada
Permission is granted to quote short excerpts and to reproduce figures and tables from this report, provided that the source of such material is fully acknowledged.
Eye-safe digital 3-D sensing for space
applications
J.-A. Beraldin F. Blais M. Rioux
L. Cournoyer,MEMBER SPIE
Visual Information Technology Group National Research Council Canada Ottawa, Ontario, Canada K1A 0R6 E-mail: [email protected]
D. Laurin S. G. MacLean
Canadian Space Agency 6767 route de l’Ae´roport
St-Hubert, Que´bec, Canada, J3Y 8Y9
Abstract. This paper focuses on the characteristics and performance of an eye-safe laser range scanner (LARS) with short- and medium-range 3-D sensing capabilities for space applications. This versatile LARS is a precision measurement tool that will complement the current Canadian Space Vision System. The major advantages of the LARS over conven-tional video-based imaging are its ability to operate with sunlight shining directly into the scanner and its immunity to spurious reflections and shadows, which occur frequently in space. Because the LARS is equipped with two high-speed galvanometers to steer the laser beam, any spatial location within the field of view of the camera can be ad-dressed. This versatility enables the LARS to operate in two basic scan pattern modes: (1) variable-scan-resolution mode and (2) raster-scan mode. In the variable-resolution mode, the LARS can search and track targets and geometrical features on objects located within a field of view of 30 by 30 deg and with corresponding range from about 0.5 to 2000 m. The tracking mode can reach a refresh rate of up to 130 Hz. The raster mode is used primarily for the measurement of registered range and intensity information on large stationary objects. It allows, among other things, target-based measurements, feature-based measurements, and surface-reflectance monitoring. The digitizing and modeling of human subjects, cargo payloads, and environments are also possible with the LARS. Examples illustrating its capabilities are presented. © 2000 Society of Photo-Optical Instrumentation Engineers. [S0091-3286(00)02301-1]
Subject terms: range camera; time of flight; space vision system; dimensional measurements; 3-D model building; target tracking; eye-safe range camera; solar-light immunity.
Paper SM-23 received May 2, 1999; revised manuscript received Aug. 25, 1999; accepted for publication Aug. 25, 1999.
1 Introduction
1.1 Application of Computer Vision in Space
Canada is participating in the International Space Station ~ISS! Program by providing a Mobile Servicing System ~MSS! that will be used in assembling and maintaining the station as well as servicing and manipulating payloads and loading and unloading the space shuttle. Computer vision will be an integral part to the success of the ISS Program.1 The space environment is open, and events occur unexpect-edly, requiring deviations from plans. Thus, sensory-based feedback is necessary, and vision is the sense through which some of the most valuable information about the environment is available. Space operations are also charac-terized by an overriding requirement for operational safety and reliability. Given the large uncertainty and instability of most complex robotic operations, it follows that large amounts of sensing data are required for reliability.
To date, most sensing has been interactive. A human operator has direct visual feedback either through the cock-pit windows or via a video imaging system mounted di-rectly on the manipulator. While this method may appear to be free of computational expense, the cost in manpower is enormous, and the efficiency with which tasks are carried out is limited.
Another characteristic of the ISS Program is that at the present level of planning, the amount of extravehicular ac-tivity ~EVA! required is still high. Thus, any technology likely to decrease this need will reduce operational costs and increase the safety of the astronauts.
The current vision system is based on the Canadian Space Vision System2~SVS! that was demonstrated during CANEX 2, on the Space Shuttle flight STS-52 in October 1992. The SVS, which is part of the Artificial Vision Func-tion ~AVF! of the MSS, analyzes video signals from the closed-circuit television system of the Space Shuttle and provides real-time position-orientation and velocity infor-mation on an object with a cooperative target array. The baseline requirements for the AVF are as follows:
• identify suitably illuminated targets mounted on ob-jects
• estimate the position, attitude, translational rate, and rotational rate of an object
• provide appropriate camera control to track an object • track objects before capture by MSS manipulators, and berth objects/payloads handled by manipulators. The Canadian Space Agency ~CSA! intends to enhance the actual capabilities of the AVF by developing additional
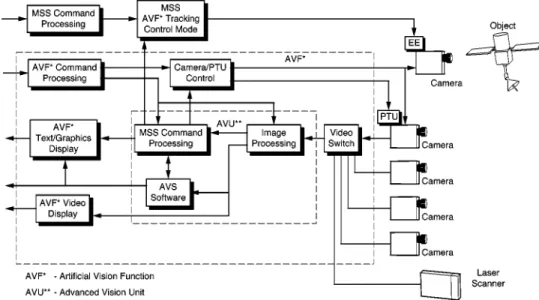
vision systems such as a laser-based range-finding camera. The enhanced AVF, as depicted in Fig. 1, will be capable of performing labeled and unlabeled object identification, shape determination of unknown objects, automatic target acquisition, update of the world-model database, and ma-nipulator end-point and link-deflection sensing. These new features will be used in the following areas: ~1! enhanced target recognition in AVF tracking and berthing, ~2! world-map verification for collision detection and avoidance, and ~3! object recognition and verification during automatic op-erations, e.g., truss assembly.
1.2 Previous Work
1.2.1 Active versus passive vision
Vision involves the analysis of the properties of the lumi-nous flux reflected or radiated by objects. To recover the geometrical structures of these objects, either to recognize or to track them, two basic vision strategies are available. The first strategy, known as passive vision, attempts to ana-lyze the structure of the scene under ambient light. The second, known as active vision, attempts to reduce the am-biguity of scene analysis by structuring the way in which images are formed. By utilizing the properties of invariance in rotation and translation of 3-D objects, sensors that capi-talize on active vision can resolve most of the ambiguities found with 2-D imaging systems. Moreover, with laser-based approaches, the 3-D information becomes relatively insensitive to background illumination and surface texture. Complete images of visible surfaces that are rather feature-less to the human eye or a video camera can be generated. Thus, the task of processing the 3-D data is greatly simpli-fied. Triangulation-based or lidar-based laser cameras are examples of vision systems built around such a strategy. 1.2.2 Literature survey
A survey of the literature on space vision systems shows that many systems are being developed and tested by engi-neers and scientists. Here, we give only a brief overview of some key papers.
MacLean et al.3 discuss some aspects of a program to develop the necessary machine vision technologies for space applications. The authors propose the testing and verification of an integrated prototype in a simulation test facility. The system integrates passive and active vision systems.
Following this work, Blais et al.4,5 demonstrated a fast random-access laser range camera @Fig. 2~a!# capable of automatically searching and tracking, in 3-D space, either targets attached to an object or, directly, its geometrical features @Fig. 2~b!#. Very high immunity to ambient illumi-nation is obtained with this system using the auto synchro-nized triangulation technique, interference filters, and ad-vanced signal-processing algorithms. With a data rate of 18,000 3-D points per second, real-time tracking of targets on an object is realized using Lissajous-type scanning pat-terns. A modular architecture of the laser scanner operating system, in order to enable the simultaneous tracking of multiple targets, is also described. Parallel processing using an array of digital signal processors is utilized to give the processing power needed for real-time multiple-target tracking. High-resolution images of objects are shown, along with a discussion of how to measure the geometrical characteristics of objects and targets to be tracked from those images. The camera was further refined by Laurin et al.6with the integration into the system of a lidar-based range sensor for long distance ~10 to 2000 m! and by se-lecting a pulsed laser with an operating wavelength that is relatively eye-safe, viz., 1.54mm.
Other systems have been proposed for space vision. Liv-ingstone et al.7 discuss a prototype real-time laser scanner for object recognition, inspection, and robot control. With this system, range and intensity images are generated in perfect registration at a rate of 10 megasamples per second. Images have a resolution of 483 lines, each having 512 pixels. The angular field of view is 30330 deg. The stand-off distance is 0.5 m, and the operational depth of field is 1 m. Under normal operating conditions, range precisions of 0.2 and 2 mm are achieved at 0.5 and 1 m respectively. The camera weighs only 2.75 kg. The light source used by that
system is a Nd-YAG laser emitting a beam with a wave-length of 1.064 mm. The authors discuss future develop-ments in order to include a source at 1.54mm and hence make the system eye-safe. A passive vision system was developed by deFigueiredo et al.8 to perform an autono-mous grapple based on guidance control feedback provided by an image generated by a single video camera mounted on the end effector of a slave robot. The authors provide results on a procedure that determines the 3-D attitude and the position of machined objects without the use of any special marks.
The next two papers describe laser altimeters. Though not intended as vision systems, these devices might be modified to generate images. Cole9 describes a laser rangefinder for the near-earth asteroid rendezvous ~NEAR! mission. This rangefinder provides altimetry data useful in characterizing the geophysical nature of 433 Eros ~a near-earth asteroid!. In addition, range data from the system can support navigational functions associated with spacecraft stationkeeping and orbit maintenance. With the use of a
solid-state laser operating at 1.064 mm and an avalanche photodiode detector receiver, the rangefinder can achieve a measurement range of 50 km. Bufton10 describes a shuttle laser altimeter ~SLA! that was integrated on flight STS-72 in November 1995. The SLA measures the distance from the Space Shuttle to the earth’s surface. A Nd:YAG ~1.064
mm! device generates the pulses at a rate of 10 per second, and returned pulses are detected by an avalanche photodi-ode detector.
1.3 Goals
It is the goal of this paper to summarize the work that was performed in our respective laboratories on short- and medium-range 3-D sensing. Many of the results are given in Refs. 4–6. But many more results obtained recently with our prototype range camera will be shown here so the reader can have a better feel for the potential of such sens-ing technology in the context of space. Figure 3 shows a chart of some of the capabilities of the LARS camera. Most Fig. 2 Laser range scanner: (a) photograph, (b) artist’s view of range camera mounted on a dexterous
manipulator.
Fig. 3 Operating modes and applications of the laser range scanner.
Beraldin et al.: Eye-safe digital 3-D sensing for space applications
of these operating modes have been tested in the laboratory and on remote sites.
Section 2 summarizes the principle of optical triangula-tion and of time-of-flight range-sensing devices. Sectriangula-tion 3 discusses the intrinsic characteristics of the system and ex-plains the design choices in the context of a space environ-ment. Section 4 describes the random-access mode that is used to search and track geometrical features. Section 5 contains a description of the raster mode of operation, also known as the imaging mode. Finally, a conclusion appears in Sec. 6.
2 Laser Range Scanner
To help explain the optical geometry used in the prototype described in this paper, conventional active triangulation is reviewed and compared with synchronized scanning. The implementation of synchronized scanning as an autosyn-chronized camera is shown to have many advantages over conventional triangulation. Active triangulation is used for short-range sensing, i.e., 0.5 to 10 m. For medium-range sensing, i.e., 10 to 2000 m, this LARS has been equipped with a range-measuring device based on the time-of-flight principle. This section covers details of short- and medium-range sensing techniques, laser sources operating at around 1.54mm, laser safety issues, diffraction effects, calibration, and results on spatial precision.
2.1 Short-Range Sensing (0.5 to 10 m)
2.1.1 Conventional active triangulation
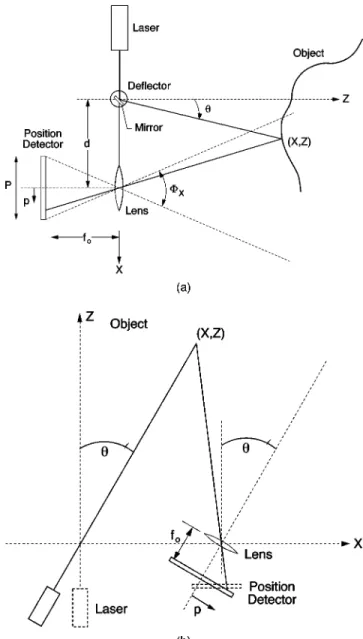
The basic geometrical principle of optical triangulation is shown in Fig. 4~a!. The light beam generated by the laser is deflected by a mirror and scanned on an object. A camera, composed of a lens and a position-sensitive photodetector, measures the location of the image of the illuminated point on the object. By simple trigonometry, the (x,z) coordi-nates of the illuminated point on the object are calculated:
z5 d f0 p1 f0tanu
~1! and
x5z tanu, ~2!
where p is the position of the imaged spot on the position detector,uis the deflection angle of the laser beam, d is the separation between the lens and the laser source, and f0 is
the effective distance between the position detector and the lens.
To show some of the limitations of this triangulation method, let us approximate the standard deviation of the error in z, sz, as a function of p only.11The law of
propa-gation of errors gives as a measurement of uncertainty
sz'
z2
f0d
sp ~3!
wherespis the standard deviation of the error in the
mea-surement of p. The meamea-surement uncertainty sz is often
referred to as the precision. It is seen to be inversely
pro-portional to both the camera baseline and the effective focal length of the lens, but directly proportional to the square of the distance. Unfortunately, d and f0 cannot be made as
large as desired. The baseline is limited mainly by the me-chanical structure of the optical setup ~the stability of the whole system decreases as d increases! and by shadow ef-fects ~self-occlusion problems increase with d!. Further-more, in the conventional triangulation geometry, the field of view Fxof the sensor, assuming the laser beam can scan
the whole field of view, is given approximately by
Fx'2 arctan
S
P
2 f0
D
, ~4!
Fig. 4 Principle of active triangulation: (a) conventional, (b)
where P is the length of the position detector. Therefore, in the conventional setup, a compromise among field of view, measurement uncertainty, and shadow effects must be con-sidered. A synchronized geometry provides a way to alle-viate these tradeoffs.
2.1.2 Autosynchronized scanning
Rioux12introduced an innovative approach to triangulation-based range imaging by using a synchronized scanning scheme that allows very large fields of view with small triangulation angles and without compromising the mea-surement uncertaintysz. With smaller triangulation angles
@or equivalently d in Fig. 4~a!#, a reduction of shadow ef-fects is inherently achieved. The intent is to synchronize the projection of the laser spot with its detection. As depicted in Fig. 4~b!, the instantaneous field of view of the position detector follows the spot as it scans the scene. The focal length of the lens is therefore related only to the desired depth of field or measurement range. Implementation of this triangulation technique with an autosynchronized scan-ner yields a considerable reduction in the optical head size compared to conventional triangulation methods @Fig. 5~a!#. Figure 5~b! depicts schematically the basic components of
the dual-axis autosynchronized scanner used in the LARS camera. A 3-D surface map is obtained by using two mir-rors ~mounted orthogonally to one another! to scan a laser beam onto a scene, collecting the light that is scattered by the scene in synchronism with the projection, and finally focusing this light onto a linear position detector, e.g., pho-todiode array, charge-coupled device, or lateral-effect photodiode.13 The image acquisition process yields three quantities per sampling interval: two angular positions of the mirrors, and the position of the laser spot on the posi-tion detector. The equaposi-tions for the mapping of those vari-ables to (x,y ,z) coordinates are given in Ref. 14.
2.1.3 Laser-spot position detection: linear array of photodiodes
This sub-subsection examines in more detail the operation of the position detector used to extract the location of the laser spot in most short-range laser scanners, i.e., linear arrays of photodiodes operating at 1.54mm. Speckle noise, bandwidth requirements, dynamic range ~noise level!, and a design example are given for this detector.
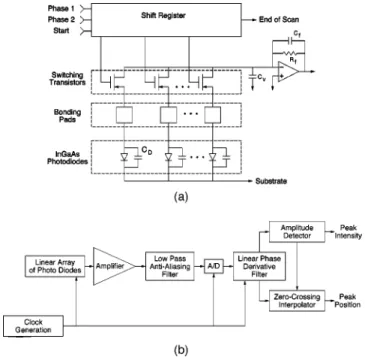
Operation of InGaAs linear arrays. Recent advances in InGaAs materials have made possible the fabrication of commercial short-wave infrared detector arrays that operate at room temperature.15 Commercial detector arrays are composed of an array of photodiodes made of InGaAs that are wire-bonded to a MOSFET-based multiplexer made of silicon. The width of the active area of one photodiode varies from 25mm to about 50mm, and its height from 100
mm to about 500mm. Array lengths vary between 64 and 1024 photodiodes. These arrays operate on the principle of charging the photodiodes’ junction capacitance with a suit-able bias voltage on the video line during the sequential readout and letting the impinging light discharge ~by photon-generated carriers! the junction capacitance. This video line connects all the photodiodes through a MOSFET @as shown on Fig. 6~a!#. Finally, an external preamplifier performs the charge-to-voltage conversion. Newer arrays combine an amplifier with each photodiode.16 The maxi-mum clock speed is about 10 MHz. The output of the de-tector is a stream of pulses whose envelope is a function of the laser spot distribution. The time of occurrence of the peak on the signal is directly related to the geometrical position of the laser spot. For example, a 512-photodiode array clocked at 5 MHz yields a maximum spot position measurement rate of about 9.76 kHz.
Subpixel interpolation @Fig. 6~b!# is performed by a digi-tal finite impulse response ~FIR! filter containing a deriva-tive stage.17 The output of this filter is used to interpolate the zero crossing of the signal. A validation step is added to eliminate false detections. The maximum peak-position ex-traction rate is achieved by allowing the imaged laser spot to extend over a number of photodiodes and interpolating. The digital filter used provides good attenuation of low-and high-frequency noise low-and especially of the frequency components induced by the clocks used to address and read each photodiode of the array.
Speckle noise. Baribeau and Rioux18,19 predicted that the error contribution of speckle noise for such a position
Fig. 5 Autosynchronized scanner: (a) single-scan axis, (b)
dual-scan axis (triangulation and time of flight).
Beraldin et al.: Eye-safe digital 3-D sensing for space applications
detector and peak-finding method behaves like a Gaussian random process, and the estimated fluctuation of p deter-mined by such noise is given by
sp5
1
A
2pl f0
D cosb ~5!
where l is the wavelength of the laser source, f0 is the
effective position of the imaging lens, D is the lens diam-eter, andbis the tilt angle of the position detector. Let us take a design example: f05110 mm, D520 mm, l
51.54mm, andb555 deg. Then one getssp55.89mm or
1/8.5 of a detector pixel ~pixel width550mm!. For a given optical geometry,sp can be substituted into Eq. ~3!.
To decrease the measurement uncertainty on p, one can-not simply average a number of spot position measure-ments, because the imaged speckle pattern does not change when multiple samples of the same surface patch are mea-sured. For a given surface patch, the macroscopic structure does not change. Spatial averaging is the only solution to reducesp. Dremel et al.
20
propose the introduction of spa-tial averaging in the object plane or in the pupil plane of the imaging lens. The first method is inherent in this synchro-nized scanner. When a constant-depth surface is scanned, the image of the laser spot remains almost stationary on the position detector.18 Because a linear array of photodiodes responds to the integral of the light pattern during a mea-surement interval, the net result is a fourfold reduction in the measurement uncertainty sp, i.e., sp51.47mm, or
1/34 of a pixel. For other surface orientations, this factor varies between 1 and 4.
Bandwidth requirement. Prior to digitizing the laser spot, an antialiasing filter with linear phase is necessary @Fig. 6~b!#. The choice of the filter bandwidth is a trade-off
among noise bandwidth, aliased components, and accurate reproduction of the envelope of the laser spot. The criterion used is that the filter should introduce less than 1-dB at-tenuation at the cutoff frequency for the minimum-spot-size condition. Hence, the bandwidth requirement of the detec-tion chain ~charge-to-voltage converter and antialiasing fil-ter! is given approximately by
Bs' 2~ ln 2 !1/2 p fs pw v0 , ~6!
where Bs is the required 23-dB system bandwidth, fs is
the pixel clock rate, pw is the pixel width, and v0 is the
spot radius at 1/e2. The envelope of the laser spot is mod-eled by a Gaussian distribution. According to experimental measurements, this model is found sufficient for design purposes. For instance, the bandwidth requirement for a spot size of 100mm using the previous design example is about 1.33 MHz.
Dynamic range and noise sources. The dynamic range of an array of photodiodes is defined as
DRArray5
QT/qe
~ nT2!1/2 ~7!
where QTis the total equivalent charge collected on a
pho-todiode ~saturation charge!, qeis the electronic charge and
(nT
2
)1/2 is the equivalent input referred noise in electrons. The saturation charge of a pixel, assuming the capacitance of the junction varies with the reverse voltage across it, is given by
QT'2~ VbiVr!1/2Cj0 ~8!
where Vbiis the built-in voltage for InGaAs, Vris the
maxi-mum reverse bias across the photodiode, and Cj0 is the
junction capacitance at zero bias.21
With linear arrays of photodiodes, one can distinguish two sources of interference: ~1! those that are stationary for a fixed temperature and clock rate, and ~2! those that are random in nature. The former is often called fixed-pattern noise and includes, among other things, dark-current vari-ability across the array, sensitivity variation between pho-todiodes, and reading-clock feedthrough.21 Random noise sources are composed of photon shot noise of the incident light, shot noise of the dark current, reset noise of the pixels in the array, and current and voltage noise of the preamplifier.22Two other sources of noise are identified in the literature: the amplifier glow noise23 and popcorn noise.24 These two sources are not covered here.
The equivalent input referred noise ~in electrons! due to the random noise sources is
nT 2 5iph1id qe N fs 1 1 qe 2kTCT1 Cf 2 en 2 qe 2 ~9!
where iph5 PdetR is the incident light ~laser and
back-ground!, idis the averaged dark current, N is the number of
pixels ~photodiodes!, Pdet is the laser power collected on
Fig. 6 Laser spot position detection: (a) equivalent circuit of
one photodiode before saturation is reached, and R is the photodiode responsivity at the wavelength of interest. The dark current has a strong dependence on temperature: It is halved for every decrease of 8°C. The quantity CT is the
total capacitance that is reset to the video-line bias. It in-cludes the photodiode junction and parasitic capacitance, and the capacitance from video line to clock lines.22 The integrated noise ~over Bs! due to the charge amplifier, en
2
in Eq. ~9! is found by computing the voltage noise at the output of the amplifier:
en 2 5Bs~ ia 2 Rf 2 14kTRf!1B1ea 2 1 Bs 3 2B1 3 3B1 2 ea 2 , ~10! where ia 2 and ea 2
are, respectively, the amplifier current and voltage noise spectral densities, Rfand Cfare the feedback
resistance and capacitance, respectively, and B1<Bs is the
frequency of the zero introduced in the noise gain of the amplifier, B1'@2pRf(Cv1CD)#
21. Here C
v and CD are
the video-line and photodiode capacitances, respectively. The temperature is T, and k is Boltzmann’s constant. Usu-ally, these noise sources include flicker noise ~noise with 1/f distribution!. Here, it is omitted because the derivative term in the FIR filter of the peak detector eliminates that noise component. Furthermore, in order to improve opera-tion at lower signal-to-noise ratios ~SNRs!, fixed-pattern noise should be minimized by proper signal processing methods, e.g., implemented by hardware or software tech-niques. Usually, for high SNR, the effect of the random noise and the quantization noise of the peak detector11 on the measurement of p are swamped by speckle noise. Table 1 presents a design example for an InGaAs photodiode
ar-raycomposed of N5512 photodiodes, which is read at 5 MHz and is connected to a commercial charge preamplifier. The dynamic range is equivalent to more than 14 bits of an analog-to-digital converter. A closer look at the noise contribution of the different sources shows that 94.5% ~ra-tio of variances! comes from the reset noise. Therefore, one can take advantage of a technique called correlated double sampling ~CDS! to reduce this noise source substantially.21 CDS, however, doubles the amplifier noise power compo-nent ~10!. Nevertheless, the dynamic range will still be about 23105, i.e., almost 18 bits.
2.2 Medium-Range Sensing (10 to 2000 m)
The range measurement uncertainty of any triangulation-based camera increases rapidly with increasing range. From Eq. ~3!, the range measurement uncertainty increases pro-portionally to the square of the camera-object distance z. With this camera, the measurement uncertainty at 10 m is about 10 mm ~more data about measurement uncertainty are given in Sec. 2.6!. Furthermore, typical position sensors used in triangulation-based systems do not possess any current-gain mechanism. Hence, as distance increases, the signal-to-noise ratio becomes a problem, because the amount of light collected ~scattered! is inversely propor-tional to the square of the distance. The solution is to use a range-sensing device for which the measurement uncer-tainty is almost independent of range and the scattered laser light is detected with a photodetector that possesses current gain, e.g., an avalanche photodiode ~APD!. Current gain does not remove the dependence on the distance, but does alleviate it. Time-of-flight systems operate on that prin-ciple.
A time-of-flight ~TOF! unit has been added to the scan-ner to achieve longer and more precise range measurements above 10 m. By using a short-pulsed laser, the range can be obtained by timing the delay between a reference pulse and the return signal from the target or object. The pulsed laser source is used with both the triangulation and the TOF detection units and thus shares the same scanning and re-ceiving optics @Fig. 5~b!#. The signal is divided by a beam-splitter, thus requiring no mechanical device for switching between triangulation and TOF modes. The triangulation system uses an InGaAs photodiode array operating in the integration mode, and the TOF unit uses an APD. The TOF unit installed in the LARS was developed by Optech Inc., Canada, under contract from the Canadian Space Agency ~CSA!. The APD detector is made of InGaAs and has good spectral sensitivity in the range 1.1 to 1.6mm. At the cur-rent operating wavelength of 1.54mm, the responsitivity of the APD is about 9.3 A/W, compared to only 0.5 A/W for the photodiode array. The range measurement uncertainty is about 25 mm at a distance of 100 m. According to the manufacturer, the limit for this unit is about 2000 m. Fur-ther tests should confirm these specifications.
2.3 Pulsed Laser Sources and Eye Safety Issues at 1.54 mm
For the scanner to achieve reasonable range measuring ca-pabilities and high scan rates, a high-power laser is re-quired. Most scanners built at NRC use lasers that emit light in the visible ~3-D color scanner! or in the near infra-red ~0.78 to 0.86mm!. The power levels vary in the range Table 1 Design example for 512-element InGaAs array.
Specification Value N 512 fs 5 MHz Pixel widthpw 50mm Pixel heightph 100mm Spot size (v0) 125mm Vr 25 V T 300 K Id 8 pA Cj 2.5 pF Rf 5.6 kV Cf 2.7 pF ia 0.1 pA/AHz ea 5 nV/AHz Bs 1 MHz
Saturation charge per pixel 403106e
Saturation power forv0 500 nW
Noise charge per pixel 1600e
Noise power forv0 20 pW
Dynamic range 25,000
Beraldin et al.: Eye-safe digital 3-D sensing for space applications
of 1 to 100 mW. At these power levels and wavelengths, such range imaging cameras pose problems for eye safety. In the wavelength region from 1.5 to 1.8 mm, there is a remarkable increase in the maximum permissible exposure ~MPE! level for the eye. The MPE is defined as the level of laser radiation to which a person may be exposed without hazardous effect or adverse biological changes in the eye or skin.25Because eye safety for this space camera is a crucial requirement, the MPE becomes very important. Fractions of a milliwatt in the visible spectrum are sufficient to cause eye damage, since the laser light density entering the pupil is magnified, at the retina, through the lens, by a factor of roughly 105 ~intrabeam viewing!. At longer wavelengths, however, strong absorption by water in the eye serves to reduce the optical power reaching the retina, thus increas-ing the damage threshold. From the absorption coefficient of water at 1.54 mm, an e-folding distance of 0.6 mm is found, which means that any damage that could occur will always be surface effects and not damage to the retina. At 1.54 mm the recommended single-pulse threshold energy for eye damage25 is roughly 104 times greater than it is at the visible wavelength of 0.632 mm. For longer exposure, the recommended threshold power factor is down to 103. The ANSI standard for eye safety takes into account that some laser light at 1.54mm is transmitted through the cor-nea and reaches the lens. The rest is absorbed by the vitre-ous body of the eye.
In the original scanner system4 ~equipped with a cw la-ser!, it was demonstrated that a rate of 18,000 3-D points per second is sufficient to maintain reasonable tracking per-formance. In order to incorporate a TOF unit into the scan-ner, a laser that could be pulsed at 18 kHz or more had to be found. The energy per pulse required for detecting ret-roreflective targets for this system at a range of 2 km has been estimated to be about 10 mJ. This corresponds to an average power of 180 mW; this is sufficient power for the triangulation system. The current range camera uses an erbium-doped fiber laser providing pulsed energy at 1.54
mm. It generates 1.5-mJ, 10-ns pulses at 20 kHz ~30 mW!, single mode, in a very compact package while consuming only 2.5 W. Future development projects include the addi-tion of a fiber amplifier to boost the output energy fourfold. The National Optics Institute, Canada, is currently develop-ing such a fiber laser under contract from the CSA.
2.4 Diffraction and Scanner Resolution
For any laser range imaging device the 3-D sampling prop-erties can be estimated by the accessible number of voxels ~volume elements! within a given cubic volume.26 Using the Gaussian beam propagation formula, one finds
v~ z !5v0
F
11S
lz pv0 2D
2G
1/2 , ~11!wherev(z) is the radius of the laser beam at a distance z from the beam waist location, and l is the wavelength of the laser source. The beam waist has a radius ofv0 and is
defined as the radius of the 1/e2 irradiance contour at the plane where the laser wavefront is flat. Figure 7~a! shows the propagation of a laser beam within the volume of
inter-est. Then, if the depth of field a is defined according to the Rayleigh criterion, the following relationship is obtained:
v05
S
la 2p
D
1/2
. ~12!
The maximum number of resolvable volume elements (VF)
along each axis within the volume of interest is
VF5 2pv0 l 5
S
2pa lD
1/2 . ~13!Figure 7~b! shows a graphical representation of this func-tion for l51.54mm. As an example, within a cube 3 m on a side, one has access to 35003 voxels.
2.5 Calibration
Owing to the shape of the coordinate system spanned by the variables measured with range cameras, the resultant images are not compatible with the coordinate system used by most geometric image-processing algorithms, e.g., for a rectangular coordinate system. A calibration of the range camera is therefore required. The calibration techniques used at NRC are divided into two main groups: ~1! lookup-table construction and ~2! model-based fitting. The latter procedure relies on the fact that the parameters of a math-ematical model describing the camera operation can be ex-tracted from known target locations. This model includes internal ~lens focal length, distortion parameters, scanning
Fig. 7 Gaussian beam: (a) propagation in space, (b) resolvable
parameters, etc.! and external ~LARS orientation! camera parameters. A calibration procedure was especially de-signed for the LARS. It relies on a global model and uses a two-step methodology to calibrate short and medium range. For the short range (z,2 m), a target array (939 grid) is positioned at a minimum of two known locations. The reg-istered range and intensity image are then acquired in the field of view of the range camera using a precise linear stage. The center of each target is extracted and compared with the known coordinates obtained from a coordinate-measuring machine ~CMM! after manufacturing the target array. A personal computer is used to solve for the camera parameters using an iterative nonlinear simultaneous least-squares adjustment method. For medium range (z.2 m), a number of targets ~the number depends on the number of unknown parameters in the model! are positioned randomly in the field of view of the camera. Their positions are mea-sured with accurate theodolite surveying or digital photo-grammetry.
2.6 Spatial Resolution and Measurement Uncertainty
Accuracy is the degree of conformance between a
measure-ment of an observable quantity and a recognized standard or specification that indicates the true value of the quantity. In practice, the accuracy is determined by the calibration process. Measurement uncertainty, sometimes referred to precision ~s!, is the degree to which repeated measure-ments of the same quantity vary about their mean. Image
resolution is defined here as the smallest element that can
be meaningfully displayed, and is limited either by the sys-tem or a physical limit, e.g., diffraction. In the case of the LARS, the maximum x-y ~angular! resolution depends on laser propagation ~see Sec. 2.4!. Figure 8~a! shows the maximum resolution in image pixels as a function of dis-tance to the camera for a Gaussian laser beam. Two curves are shown: one for a focused laser beam and one for a collimated laser beam. The x-y measurement uncertainty depends mostly on the scanning mechanism and to a lesser extent the laser spot measurement. The maximum resolu-tion of the LARS is limited by the number of bits assigned to it. The current value of z is represented by a 32-bit floating-point number. The measurement uncertainty in z (sz) depends mostly upon distance, speckle, surface
char-acteristics, and defocusing ~at projection!.
A good approximation of the measurement uncertainty of a laser range camera (sx,sy,sz) is computed from the
error propagation of measurements of the position of the laser spot on the detector, the scanning mirrors, and the geometry of the sensor. These measurement uncertainty es-timates are used to determine the optimal distance from camera to object for a given survey. The LARS camera uses two galvanometers to drive the two mirrors. The point-ing uncertainty ~precision! was measured at distances to the camera varying between 15 and 45 m. The worst case for an optical angle of 30330 deg was about 50mrad ~1 part in 10,000!. As seen earlier, the measurement of p is limited by the laser speckle impinging on the position detector, which imposes a lower limit on the range measurement uncertainty. The measurement uncertainty of the LARS is represented graphically in Fig. 8~b!. Table 2 compares
pre-dicted values of LARS measurement uncertainty with mea-sured values obtained after short-range calibration. 3 Intrinsic Advantages of LARS for Space
Applications
Having described the optical arrangement and the signal processing used by the LARS, the techniques used in this laser scanner for increasing the immunity to solar irradi-ance can now be summarized.
3.1 Laser-Spot Peak Detection Algorithm
As mentioned earlier, subpixel interpolation of the laser spot is performed by a digital FIR filter containing a de-rivative stage. This filter provides good attenuation of low-and high-frequency noise low-and especially of the frequency components induced by the clocks used to address and read
Fig. 8 Prediction of spatial resolution and measurement uncertainty
(precision) from the range camera design equations: (a) image reso-lution (x-y), (b) range precision (z).
Table 2 Comparison between predicted and measured precision
after calibration. Measurement uncertainty Z51.5 m Z52.25 m Predicted (mm) Measured (mm) Predicted (mm) Measured (mm) sx 0.200 0.254 0.376 0.282 sy 0.250 0.300 0.424 0.310 sz 0.500 0.510 1.010 0.746
Beraldin et al.: Eye-safe digital 3-D sensing for space applications
each photodiode of the array. Immunity to interfering light sources ~artificial or natural, e.g., the sun! and even to mul-tiple reflections of the laser source itself is critical for achieving robust peak position detection. The method implemented here for a linear array of photodiodes can op-erate even with a partly saturated section, as shown in Fig. 9~a!.
Furthermore, a range camera based on a single-spot scanning mechanism offers the advantage of increased dy-namic range over other projection methods. Through the control of the laser power ~or energy! on a pixel-to-pixel basis according to the amount of light collected, the dy-namic range can be increased beyond the level stated in Table 1. This feature is important, because surfaces in space have high contrasts and generate specular reflections, but should be used with caution when sunlight is imaged on the position sensor.
3.2 Small Instantaneous Field of View
As described in Sec. 2 and depicted in Figs. 4 and 5, the instantaneous field of view of the position detector follows the spot as it scans the scene. The focal length of the lens is therefore related only to the desired depth of field or mea-surement range and not to the total field of view. Therefore, implementation of a synchronized triangulation technique allows a considerable reduction in the instantaneous field of view compared to conventional triangulation methods. And
hence, there is an improvement in immunity to ambient light ~direct sunlight, sunlight reflected by the earth, specu-lar reflections!.
3.3 Better Focusing and Reduced Speckle Noise through the Scheimpflug Condition
As shown in Fig. 5, the position detector is tilted. This optical arrangement is known as the Scheimpflug geometry. Triangulation-based rangefinders can take advantage of this arrangement.27 One of its implications is that any point along the projection axis ~laser beam! is in focus on the position detector. This property provides a considerable im-provement in depth of view. Furthermore, with the Sche-impflug arrangement, the lens aperture can be kept at maxi-mum, thus reducing speckle noise @see denominator of Eq. ~5!# and improving signal strength.
Solar interference rejection is improved by the Sche-impflug condition. Figure 9~b! shows an example of the focusing of the sun on a position detector. Because of this optical arrangement, the sun is always focused at the focal plane of the lens; thereby its image will spread out on the position detector, except perhaps at the intersection of the focal plane and the detector. It can be concluded that, when the sun appears in the instantaneous field of view of the camera, the dynamic range of the detector, along with the peak detector algorithm used, extends the LARS’s robust-ness.
The saturation condition shown in Fig. 9~a! is a worst-case scenario. A good design will prevent complete satura-tion of the posisatura-tion sensor.
3.4 Immunity to Solar Irradiance
In a space environment, a range camera will have to oper-ate under intense solar irradiance, either direct or from re-flections. When the space station is in the shadow of the earth, the vision system will have to operate in near dark-ness. These scenarios call for a camera that can operate over a wide dynamic range of intensities. Therefore, it is imperative that the camera be designed or equipped with sun-blocking capabilities. The use of an interference filter tuned to the laser wavelength will improve the immunity to solar irradiance. Furthermore, if one looks at the solar spec-tral irradiance outside the atmosphere,28 a ratio of 5.8 is found between the solar spectral irradiance at 0.63mm and at 1.54mm ~less solar irradiance at 1.54mm!. An interfer-ence filter combined with a laser wavelength of 1.54mm is an effective means to increase a range camera’s immunity to solar irradiance.
4 Random-Access Mode
Trackers are systems designed to follow the position of a
selected remote object. Most optical trackers contain the following: a sensor that collects the target radiation, tracker electronics that collect and process the sensor signal and produce correction signals, and pointing mechanisms to al-low the sensor to folal-low the target motion. There are nu-merous applications for optical trackers in the military and aerospace fields. Optical communication systems often em-ploy semiactive trackers to maintain alignment between transmitters and receivers.
To illustrate the concept of optical trackers, one can con-sider the task where a space vision system is used during
Fig. 9 Position detection: (a) detection of laser spot even with partly
satellite retrieval, as depicted in Fig. 2~b!. The satellite is first located when it is a few kilometers from the range sensor, using a TOF ranging technique. The search proce-dure ~for target or feature location! can be made in a slow-raster-scan mode or using fast-expanding Lissajous figures. When a target is found, its trajectory is monitored using a fast refresh rate (.100 frames/s) over a small field of view. When the satellite is close enough to the sensor, the ranging technique is changed to triangulation in order to reduce the measurement uncertainty. The search and/or track proce-dures are repeated to provide the satellite position and ori-entation.
Five basic strategies have been used, to date, to scan the scene and to read the information available. These five strategies are point, vector, raster, Lissajous, and rosettes. The point mode is a random-access approach where indi-vidual pixels are addressed and their range measured. In this mode, a simple geometrical feature-extraction algo-rithm can be used to drive the scanner. The second strategy is a random orientation line scan ~vector! where a profile is read at a desired orientation. Length and position of the line are fully programmable. The third mode is the conventional
raster approach, similar to that in conventional TV
cam-eras, where each line of the whole image is read sequen-tially. The fourth mode, Lissajous patterns, is our preferred mode of operation for tracking and will be further dis-cussed. The last mode uses rosettes.
In the current version of the LARS, a digital signal-processing ~DSP! board is used to generate the Lissajous patterns. A general-purpose CPU board supervises the op-erations, performs the processing of the range data, detects the position of the target on the object, and feeds back the tracking correction signals to the DSP board. Provisions are made to transfer the range information and the attitude of the object to a host computer. Search is implemented using a fast-expanding 4 : 5 Lissajous pattern @Fig. 10~a!#. The amplitude of the pattern is continuously increased or re-duced until a valid point is detected on the pattern. The pattern is then centered on the detected point to find the approximate size and position of the target. When a target is found, the system is automatically switched to the track-ing mode @Fig. 10~b!#. The tracktrack-ing mode also uses a Lis-sajous figure. While any pattern can be used, the 2 : 3 pat-tern was chosen, as a first attempt, to track single or multiple retroreflective targets. This pattern, while simple, is sufficient to demonstrate the concept. However, more complex patterns will be required when tracking geometri-cal features of the object. Tracking trajectory corrections for a single target are currently implemented at a refresh rate of 130 Hz. By using range information to validate the measurements, target tracking is kept constant even when a very bright light source is directly behind the object.
The Lissajous scanning patterns give low pointing un-certainty ~high precision! and excellent stability at high re-fresh rates. For a field of view of 30 deg, pointing uncer-tainties of 50mrad ~1 part in 10,000! or less were obtained at distances ranging between 15 and 45 m. A more com-plete study of the effects of temperature variations on the laser scanner is being carried out to fully characterize the exact performance of the LARS. The angular measurement of multiple targets was interfaced and integrated with the
existing SVS that calculates the position and attitude of the object using photogrammetric techniques.
5 Raster Mode
The raster mode is used primarily for the measurement of registered range and intensity information on large station-ary objects. This operating mode allows direct dimensional measurements of the features of an object or an environ-ment. Measurements can be performed in situ, e.g., during docking maneuvers. Or they can be executed during pre-launch preparation in order to create models ~e.g., verifica-tions with CAD drawings! or to document last-minute changes.
5.1 Dimensional Measurements
In this subsection, the accuracy of the LARS is demon-strated for dimensional measurements of targets, natural features, and image differences. Many results come from a laser survey of the Orbiter Docking System ~ODS! located at the Kennedy Space Center ~KSC!, Florida. The ODS has a diameter of about 1.6 m and a height of about 3.9 m. This example is considered a good test case to demonstrate the calibration and the measurement capabilities of the LARS. 5.1.1 Targets
The first part of this section is devoted to the assessment of the combined accuracy of the calibration and the range-image registration process. The range range-image is used to de-termine the shape of the object ~surfaces!, while the inten-Fig. 10 Random access mode: (a) search mode with 1 : 1, 2 : 3,
3 : 4, 4 : 5 Lissajous patterns; (b) tracking of a target with a 2 : 3 Lissajous pattern.
Beraldin et al.: Eye-safe digital 3-D sensing for space applications
sity image serves to extract edges and features such as holes and targets. Targets mounted on the top portion of the ODS were used to assess the accuracy. These targets were measured with a network of theodolites a day prior to the laser survey and used as a reference. There are a total of six targets on the ODS. Not all targets are visible in one image. Figure 11 shows a typical intensity image of two targets as acquired by the LARS.
Figure 12 shows the results after synthetically shading two range images that have been merged together. The
tar-gets were extracted in each image, and a circle was fitted to the range data. This technique yields the diameter and the location of the target center in the image coordinate system. After the extraction, each coordinate of the center must be transformed, with a rigid-body transformation, to a com-mon coordinate system. The parameters of the transforma-tion are obtained from the registratransforma-tion of the multiple im-ages acquired during the laser survey. With the current calibration and range-image registration techniques, an ac-curacy better than 0.25 mm in x and y , and 0.80 mm in z, was achieved.29 These results compare favorably with the single-point accuracy obtained after calibration, i.e., about 0.25 mm in x and y , and 0.50 mm in z ~Table 2!. Hence, these results confirm the high level of accuracy possible with the LARS calibration procedure and image merging process used for the creation of models.
5.1.2 Natural features
With a laser range camera, it makes sense to use structural information to infer positional and orientation information when surveying an object with so many geometrical fea-tures. Currently, three pegs, known as petal plate centering
targets ~PPCT’s!, are installed on the ODS during
pre-launch preparation. These PPCTs are used by a theodolite survey to find the center of the ODS. They are cylindrically shaped objects with two cutouts where theodolite targets are engraved. This technique is fine with this kind of sur-vey, but with a LARS camera, geometrical primitives ~cyl-inder, sphere, circle, plane, etc.! can be fitted to the scanned data. For example, once the intersection points of the cyl-inders’ ~pegs’! axes with the y -shaped alignment plate ~which is flat! are known, the center of the ODS can be computed. With reference to Fig. 13, the intersection of the axis of the cylinder with the planar surface located on top of it gives the location of the peg ~assuming that the peg and the cylindrical portion of the plate are concentric!. This procedure can be extended to other parts of the ODS. Fig-ure 13 shows the 3-D data ~using synthetic shading! of Fig. 11 Typical intensity image acquired by the LARS. This image
shows two Orbiter Space Vision System (OSVS) targets mounted on the ODS.
Fig. 12 Range image of four OSVS targets mounted on the ODS
surface. The range image is displayed using synthetic shading.
Fig. 13 Synthetically shaded range images, showing part of the
y-shaped alignment plate and one of the three pegs, also known as PPCTs. They are mounted on top of the ODS.
a portion of the y -shaped alignment plate with one of the three pegs. The two theodolite targets are not visible from this range-camera viewpoint. Another benefit of a LARS survey can be found in the fact that with all the surface information available, it is possible to observe a defect that would go unnoticed with a theodolite survey. The follow-ing case should exemplify this fact. As seen in Fig. 14~a!, the planar surfaces supporting the theodolite targets on PPCT peg 3 are inclined to one another by about 10 deg. As clearly demonstrated in Fig. 14~b!, they are parallel on PPCT peg 2.
5.1.3 Image-based measurements
Image-based measurements include among other things the inspection of surfaces by differential methods and the com-putation of the physical reflectance properties of a scene. Differential inspection allows the determination of surface deviations from a known reference by simply subtracting an image from a prerecorded reference. This reference shape can be a master object or a scan of the same object at a different time. With this technique and some criterion to determine out-of-tolerance objects, excessive wear, distor-tion due to temperature cycles, or surface defects can be identified ~Fig. 14!. Hence, appropriate action can be taken to correct the situation before any malfunction occurs. Similar tests can be conducted with the reflectance map of the object surface. By resorting to a careful modeling of the geometrical and optical properties of a range camera, it is possible to extract this reflectance map.30
5.2 Imaging and Model Building
In this subsection, the accuracy of the LARS is demon-strated for the creation of models of objects, for virtual environments, and for accurate dimensional measurements.
5.2.1 Human subject
The technology exists to capture the surface shape of the human body.31This information can be used in the design of environments where astronauts are required to work. This will allow the optimization of the workplace without affecting the well-being of the crew. Similar techniques can be used to design space suits. Figure 15 shows two repre-sentations of the same range image of some members of the crew on mission STS-52. Figure 15~a! shows the range image displayed in gray levels, and Fig. 15~b!, using syn-thetic shading. Figure 16~a! shows one of the authors on a TOF-generated range image displayed in gray levels. 5.2.2 Sites and environments
Figures 17~a! and ~b! show respectively an intensity image and a synthetically shaded range image of a quarter-scale Fig. 14 Orthographic views of (a) PPCT peg 3 and (b) PPCT peg 2 displayed as a cloud of points.
This shows the advantage of LARS for prelaunch inspection of cargo payloads.
Fig. 15 Measurement of human subjects: (a) range image coded in
gray levels, (b) same image but displayed with synthetic shading (astronauts: S.G. MacLean, B. Tryggvason, the late L. Veach, J. Wetherbee, and M. Baker).
Beraldin et al.: Eye-safe digital 3-D sensing for space applications
model ~located at the NRC! of the cargo bay of the Space Shuttle Orbiter. The scale model measures 4.33 by 1.42 by 0.6 m. It was digitized to a resolution of 204834096. With a TOF unit, large-scale environments can be digitized @Fig. 16~b!#.
5.2.3 Equipment and cargo
The laser survey at KSC was also required to create a model of the ODS with the most complete dimensional description possible. In order to achieve this task, multiple scans were performed at various locations accessible all around the ODS. Adjacent views with sufficient overlap for registration were merged together. This task enhances the real strength of the laser survey with the creation of multiple-resolution models from surface measurements. As shown in Fig. 18, a number of models ~top of ODS and
complete ODS! were constructed at different resolution levels.
6 Conclusion
This paper has presented a review of the activities at the National Research Council of Canada and the Canadian Space Agency on eye-safe digital 3-D imaging for space applications. In particular, the characteristics and perfor-mance of a prototype laser range scanner ~LARS! with short- and medium-range 3-D sensing capabilities for space applications were given. The LARS combines advanta-geously autosynchronized triangulation and time-of-flight techniques in one camera to achieve a range-measuring ca-pability varying between 0.5 and 2000 m.
The operating principle of the LARS allows it to operate in two basic scan pattern modes: ~1! scan-resolution mode and ~2! raster-scan mode. In the variable-resolution mode, the LARS can search and track targets and geometrical features on objects located within a field of view of 30330 deg. These characteristics allow implemen-tations of practical search and track strategies based on the use of Lissajous patterns for multiple targets. The tracking mode can reach a refresh rate of up to 130 Hz. The raster mode is used primarily for the measurement of registered range and intensity information of large stationary objects. It allows, among other things, target-based measurements, feature-based measurements, and image-based measure-ments such as differential inspection and surface reflec-Fig. 16 Range images acquired with TOF coded in gray levels: (a)
one of the authors located at about 12 m from the camera; (b) high bay at CSA.
Fig. 17 Scaled model of the Space Shuttle cargo bay as measured
by LARS: (a) intensity image, (b) synthetically shaded range image.
Fig. 18 An illustration showing the integration of the digitized views
into a 3-D model: (a) shaded view of the integrated data for the top portion of the ODS, (b) compressed model of the same file, and (c) compressed model of the full structure shown in wire mesh.
tance monitoring. The digitizing and modeling of human subjects, cargo payloads, and environments are also pos-sible with the LARS. A number of examples illustrating the many capabilities of the LARS are presented in this paper. Furthermore, design aspects covering the laser source, im-munity to sunlight, and eye-safety considerations are dis-cussed. Three-dimensional imaging at an eye-safe wave-length is demonstrated with a pulsed laser source emitting at 1.54mm.
This versatile LARS is intended to complement the cur-rent Canadian Space Vision System ~SVS!. Integration of the LARS in the SVS will allow 3-D surveying of a robotic work site, identification of known objects from registered range and intensity images, and object detection and track-ing ~based on shape or cooperative targets! relative to the Orbiter and Space Station. The data supplied by the im-proved SVS will be invaluable in Orbiter rendezvous and in assisting the Orbiter Remote Manipulator System operator. The advantages of the LARS over conventional video-based imaging allow it to operate with sunlight shining di-rectly into the scanner and with immunity to specular re-flections and shadows. Hence, continuous operation of the vision system during complete orbits is possible. Plans are being made for the development of a space-qualified sys-tem where these capabilities can benefit space exploration.
Acknowledgments
Jacques Domey from NRC and Fernand Rheault from CSA made many contributions through discussions the authors had with them. We would like to thank the people at Neptec Design Group ~Canada! and NASA for their logis-tical support throughout the work on the ODS at KSC. We are indebted to Pierre Gariepy for his much-appreciated help in maintaining our computers and network in a state of readiness. Thanks also are due to P. Amirault and D. Gamache, who contributed many of the line drawings and photographs used in this paper.
References
1. D. Doetsch and R.C. Hughes, ‘‘Space station: an application for com-puter vision,’’ presented at Vision Interface 88, June 1988. 2. S.G. MacLean and H.F.L. Pinkney, ‘‘Machine vision in space,’’ Can.
Aeronaut. and Space J. 39~2!, 63–77 ~1993!.
3. S.G. MacLean, M. Rioux, F. Blais, J. Grodski, P. Milgram, H.F.L. Pinkney, and B.A. Aikenhead, ‘‘Vision system development in a space simulation laboratory,’’ in Close-Range Photogrammetry Meets Machine Vision, Proc. SPIE 1394, 8–15 ~1990!.
4. F. Blais, M. Rioux, and S.G. MacLean, ‘‘Intelligent, variable resolu-tion laser scanner for the space vision system,’’ in Acquisiresolu-tion, Track-ing, and Pointing V, Proc. SPIE 1482, 473–479 ~1991!.
5. F. Blais, J.-A. Beraldin, M. Rioux, R.A. Couvillon, and S.G. MacLean, ‘‘Development of a real-time tracking laser range scanner for space application,’’ in Proc. Workshop on Computer Vision for Space Applications, Antibes, France, September 22–24, pp. 161–171 ~1993!.
6. D.G. Laurin, F. Blais, J.-A. Beraldin, and L. Cournoyer, ‘‘An eye-safe imaging and tracking laser scanner system for space applications,’’ Proc. SPIE 2748, 168–177 ~1996!.
7. F.R. Livingstone, L. King, J.-A. Beraldin, and M. Rioux, ‘‘Develop-ment of a real-time laser scanner system for object recognition, in-spection, and robot control,’’ Proc. SPIE 2057, 454–461 ~1993!. 8. R.J.P. deFigueiredo, A. Maccato, P. Wlczek, D. Denny, J. Scheerer,
M. Massimino, and L. Kesler, ‘‘Vision-based robotic system for space applications,’’ Proc. SPIE 2057, 397–408 ~1993!.
9. T.D. Cole, ‘‘Laser range finder for the near-earth asteroid rendezvous ~NEAR! mission,’’ Proc. SPIE 2581, 2–26 ~1995!.
10. J. Bufton, ‘‘Shuttle laser altimeter ~SLA!,’’ in Shuttle Small Payloads Symposium, pp. 83–90, NASA Goddard Space Flight Center, ~1995!. 11. F. Blais, M. Rioux, and J.-A. Beraldin, ‘‘Practical considerations for a design of a high precision 3-D laser scanner system,’’ Proc. SPIE
959, 225–246 ~1988!.
12. M. Rioux, ‘‘Laser range finder based on synchronized scanners,’’ Appl. Opt. 23, 3837–3844 ~1984!.
13. J.-A. Beraldin, M. Rioux, F. Blais, and R.A. Couvillon, ‘‘Digital three-dimensional imaging in the infrared at the National Research Council of Canada,’’ in Infrared Technology XX, Proc. SPIE 2269, 208–225 ~1994!.
14. J.-A. Beraldin, S.F. El-Hakim, and L. Cournoyer, ‘‘Practical range camera calibration,’’ Proc. SPIE 2067, 21–31 ~1993!.
15. G.H. Olsen, ‘‘InGaAs fills the near-IR detector-array vacuum,’’ Laser Focus World, pp. A21–A30 ~Mar. 1991!.
16. A.M. Joshi, V.S. Ban, S. Mason, and M.J. Lange, ‘‘512 and 1024 element linear InGaAs detector arrays for near-infrared (1mm–3mm) environmental sensing,’’ Proc. SPIE 1735, 287–295 ~1992!. 17. F. Blais and M. Rioux, ‘‘Real-time numerical peak detector,’’ Signal
Process. 11~2!, 145–155 ~1986!.
18. R. Baribeau and M. Rioux, ‘‘Influence of speckle on laser range find-ers,’’ Appl. Opt. 30, 2873–2878 ~1991!.
19. R. Baribeau and M. Rioux, ‘‘Centroid fluctuations of speckled tar-gets,’’ Appl. Opt. 30, 3752–3755 ~1991!.
20. W. Dremel, G. Hausler, and M. Maul, ‘‘Triangulation with large dy-namical range,’’ in Optical Techniques for Industrial Inspection, P.G. Cielo, Ed., Proc. SPIE 665, 182–187 ~1986!.
21. G.M. Borsuk, ‘‘Photodetectors for acousto-optic signal processors,’’ Proc. IEEE 69~1!, 100–118 ~1981!.
22. R.W. Simpson, ‘‘Noise in large-aperture self-scanned diode arrays,’’ Rev. Sci. Instrum. 50~6!, 730–732 ~1979!.
23. E.R. Fossum and B. Pain, ‘‘Infrared readout electronics for space science sensors: state of the art and future directions,’’ in Infrared Technology XIX, Proc. SPIE 2020, 262–285 ~1993!.
24. A.M. Joshi, G.H. Olsen, V.S. Ban, and E. Mykietyn, ‘‘Popcorn noise in linear InGaAs detector arrays,’’ Infrared Focal Plane Array Pro-ducibility and Related Materials, Proc. SPIE 1683, 200–208 ~1992!. 25. American national standard for safe use of lasers, ANSI Z136.1-1993,
American National Standards Institute, New York ~1993!.
26. M. Rioux, G. Bechthold, D. Taylor, and M. Duggan, ‘‘Design of a large depth of view three-dimensional camera for robot vision,’’ Opt. Eng. 26~12!, 1245–1250 ~1987!.
27. G. Bickel, G. Hausler, and M. Maul, ‘‘Triangulation with expanded range of depth,’’ Opt. Eng. 24~6!, 975-977 ~1985!.
28. G.H. Suits, ‘‘Natural sources,’’ in The Infrared Handbook, W.L. Wolfe and G.J. Zissis, Eds., ERIM ~1989!.
29. J-A Beraldin, L. Cournoyer, M. Rioux, F. Blais, S.F.El-Hakim, and G. Godin, ‘‘Object model creation from multiple range images: acquisi-tion, calibraacquisi-tion, model building and verificaacquisi-tion,’’ in Int. Conf. on Recent Advances in 3-D Digital Imaging and Modeling, Ottawa, pp. 326–333, IEEE Computer Society Press ~1997!.
30. R. Baribeau, M. Rioux, and G. Godin, ‘‘Color reflectance modeling using a polychromatic laser range sensor,’’ IEEE Trans. Pattern. Anal. Mach. Intell. 14~2!, 263–269 ~1992!.
31. M. Rioux, ‘‘Color 3-D electronic imaging of the surface of the human body,’’ in Automatic Systems for the Identification and Inspection of Humans, Proc. SPIE 2277, 42–54 ~1994!.
J. A. Beraldin is a senior research officer
at the National Research Council Canada. He received a BEng from the Universite´ de Sherbrooke, Quebec, Canada, and a MASc from the University of Ottawa, On-tario, Canada, in 1984 and 1986, respec-tively, both in electrical engineering. In 1986, he joined the National Research Council Canada. His current research in-terests include sensor systems engineer-ing and signal processengineer-ing hardware and software for 3-D vision systems. He has developed expertise in op-toelectronic aspects of range sensors as well as in the intrinsic/ extrinsic calibration of them. He has more than 50 papers and pub-lications, one patent, and has licensed technology (both hardware and software) to many Canadian companies. Mr. Beraldin is a reg-istered professional engineer with the province of Ontairo. Beraldin et al.: Eye-safe digital 3-D sensing for space applications
F. Blais is a senior research officer at the
National Research Council of Canada. Since 1984, he has been involved in the development of many of the different 3-D technologies at NRC, especially their range sensing systems, and their applications. He has also been acting as director of R&D for Vitana Corp. to supervise the compa-ny’s R&D efforts in 3-D. Since April 1999, he returned to the NRC to continue his re-search. His topics of interest cover various fields in digital and image processing, control, 3-D vision systems and their applications. He has more than 70 papers and publica-tions, and 8 patents of which several have been licensed to different Canadian industries. Mr. Blais is a registered professional engineer of Ontario.
M. Rioux is a principal research officer of
the Institute for Information Technology at the National Research Council. His present interests are in the development of three-dimensional digitizing, modeling and dis-play for machine vision, optical dimen-sional inspection and visual communication in the Visual Information Technology Group. He received his bach-elor’s degree in engineering physics in 1971 and a master’s degree in physics in 1976, both from Laval University. He worked five years on CO2laser
development and applications and two years in infrared holography and joined the National Research Council in 1978 to work on optical sensor research.
L. Cournoyer is a physics technologist
who has been with the National Research Council of Canada since 1982. He has worked on the development of various la-ser range sensors, mainly on the opto-mechanical design, their integration and on various demonstrations for many applica-tions. He has also developed software for data processing and manipulation and for the control of these sensors.
D. Laurin received a BS (honors) in
phys-ics from the University of Waterloo, Canada, in 1984, a Master of Applied Sci-ence in 1986, and a PhD in 1992 at the University of Toronto Institute for Aero-space Studies. His doctoral thesis project involved the development of an optical sys-tem for multiple target tracking on a flexible space structure emulator. He has since then been employed by the Canadian Space Agency, Space Technology Direc-torate, as a researcher in laser applications. He was a guest
re-searcher at the National Research Council Canada for three years. His current activities include the development of a laser scanner for 3-D imaging as well as optical inter-satellite communications and other laser applications for space.
S. G. MacLean received a BS (honors) in
physics in 1977 and a Doctorate in Physics in 1983 from York University in Toronto, Ontario. In 1977, he received the Presi-dent’s Award at York University (Murray G. Ross Award). He is a laser physicist, and his research has included work on electro-optics, laser-induced fluorescence of par-ticles and crystals and multi-photon laser spectroscopy. In 1983, he became a visit-ing scholar at Stanford University under Nobel Laureate A.L. Shalow. In 1993, he received three doctorates (Honoris causa) from Canadian universities. In December 1983, he was one of six astronauts selected by the Canadian Space Agency (CSA). He began astronaut training in February 1984 and, in De-cember 1985, was designated as the Canadian Payload Specialist to fly with the CANEX-2 set of Canadian experiments in space. His mission, STS-52, took place October 22 to November 1, 1992. From 1987 to 1993, he was Program Manager of the Advanced Space Vision System (SVS). In July 1993, he was a science advisor for the International Space Station. In 1993, he became an adjunct profes-sor at the University of Toronto Institute for Aerospace Studies. In April 1994, he was appointed acting director general of the Cana-dian Astronaut Program. In July 1996 he was selected to attend NASA’s Astronaut Canadidate Training at Johnson Space Center, Houston, Texas. Having completed two years of training and evalu-ation, he is qualified for flight assignment as a mission specialist. Currently, Dr. MacLean is assigned technical duties in the Astronaut Office Robotics Branch.