HAL Id: hal-02377353
https://hal.laas.fr/hal-02377353
Submitted on 23 Nov 2019
HAL is a multi-disciplinary open access
archive for the deposit and dissemination of
sci-entific research documents, whether they are
pub-lished or not. The documents may come from
teaching and research institutions in France or
abroad, or from public or private research centers.
L’archive ouverte pluridisciplinaire HAL, est
destinée au dépôt et à la diffusion de documents
scientifiques de niveau recherche, publiés ou non,
émanant des établissements d’enseignement et de
recherche français ou étrangers, des laboratoires
publics ou privés.
Weak- and Moderate-Feedback Regime
Usman Zabit, Olivier Bernal, Saqib Amin, Muhammad Farrukh Qureshi,
Arsalan Habib Khawaja, Thierry Bosch
To cite this version:
Usman Zabit, Olivier Bernal, Saqib Amin, Muhammad Farrukh Qureshi, Arsalan Habib Khawaja, et
al.. Spectral Processing of Self-Mixing Interferometric Signal Phase for Improved Vibration Sensing
Under Weak- and Moderate-Feedback Regime. IEEE Sensors Journal, Institute of Electrical and
Electronics Engineers, 2019, 19 (23), pp.11151-11158. �10.1109/JSEN.2019.2935087�. �hal-02377353�
this work in other works.
DOI: 10.1109/JSEN.2019.2935087
I. INTRODUCTION
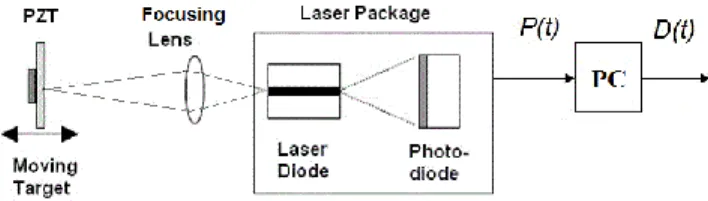
LASER Diode (LD) based Self-Mixing (SM) or optical feedback interferometry (OFI) [1, 2] is an attractive sensing scheme due to the compact, self-aligned, and low-cost nature of the SM sensor. An SM sensor is much simpler than conventional interferometers because many optical elements such as the beam splitter, reference mirror and external photodetector are not required (Fig. 1 shows a typical SM sensor set-up). Thus, with a simply constructed opto-electronic system, smart laser sensors have been developed using SM [1, 2]. However, as opposed to traditional interferometers, recovery of displacement from the SM signal is not straight-forward due to the complex nature of SM signals involving hysteresis and strongly non-linear fringes (see Fig. 2).
Displacement sensing with a resolution of half-wavelength λ0/2 can be easily achieved with a basic SM sensor under
Usman Zabit (corresponding author) was with Riphah International University, Islamabad, Pakistan. He is now with National University of Sciences and Technology (NUST), Islamabad, Pakistan. (e-mail: [email protected])
Olivier. D. Bernal and Thierry Bosch are with LAAS-CNRS, Universite de Toulouse, CNRS, INPT, Toulouse, France.
Saqib Amin and Muhammad Farrukh Qureshi are with Riphah International University, Islamabad, Pakistan.
Arsalan Habib Khawaja is with U.S.-Pakistan Center for Advanced Studies in Energy (USPCAS-E), National University of Sciences and Technology (NUST), Islamabad, Pakistan. (e-mail: [email protected])
moderate optical feedback (OF) regime [3, 4]. The basic resolution can be improved by locking the laser phase to mid-fringe [5] or by mid-fringe duplication [6, 7] or by utilizing phase unwrapping techniques. Different phase unwrapping techniques (based on time-domain SM signal processing) have been proposed in literature [8-14] providing accuracy from λ0/8 to λ0/60. For accuracy exceeding λ0/40, these methods
[8-10] require elaborate time-domain SM signal segmentations and iterative estimations of key OFI parameters. Such time domain based analysis of sequential nature requires iterative computations and the operations cannot be easily parallelized. This then hinders their fast real-time implementations for high bandwidth (BW) applications. Furthermore, their performance is also susceptible to additive noise [9].
So, to avoid these problems, an approach using frequency domain analysis of unwrapped laser feedback phase is proposed so that the above-mentioned iterative estimations can
Spectral Processing of Self-Mixing
Interferometric Signal Phase for Improved
Vibration Sensing under Weak- and
Moderate-Feedback Regime
Usman Zabit, Senior Member, IEEE, Olivier D. Bernal Member, IEEE, Saqib Amin, Muhammad Farrukh Qureshi, Arsalan Habib Khawaja, and Thierry Bosch, Senior
Member, IEEE
DOI: 10.1109/JSEN.2019.2935087
Fig. 1: Block diagram of a typical SM sensing set-up requiring a LD package with its built-in photo-diode and a focusing lens. A piezoelectric transducer (PZT) has been used as target. Variations in the LD optical output power P(t) are processed to retrieve the target motion D(t).
Abstract— In this paper, spectral processing of laser Self-Mixing (SM) interferometric signal phase has been carried out
allowing better measurement accuracy for harmonic and arbitrarily shaped vibrations for an optical feedback-based SM interferometric Laser Diode (LD) sensor. The resulting algorithm not only improves the measurement accuracy but also reduces the processing time (by a factor 3.45) as compared with a previous time-domain based displacement retrieval technique called the Phase Unwrapping Method (PUM). Fourier series-based analysis of laser feedback phase is carried out to determine processing limits. The proposed algorithm has also been found to be robust against variation in optical feedback coupling C as well as additive noise. This use of spectral analysis not only increases the measurement accuracy but also retrieves information about target movement harmonics which can also be used in modal analysis applications of remote mechanical targets. Using an SM vibration sensor based on a LD emitting at 785nm, this technique has provided an average RMS error of 12.5 nm (while that of PUM is 39 nm RMS) for harmonic target vibrations of 5 µm amplitude. For reduced range of 1<C<2, an average RMS error of ~ 8 nm (~λ/100) is obtained.
be removed while guaranteeing the high accuracy associated with these phase unwrapping techniques [8-13].
Spectral analysis within SM is not new and various researchers have applied Fast Fourier Transform (FFT) based methods directly on the SM signals. For displacement measurement, an FFT based algorithm was directly applied on SM signals obtained from a current modulated SM sensor [15]. In this work, the SM signal was piece-wise segmented and FFT was calculated on each SM segment to retrieve fundamental frequency and initial phase, both of which are used to measure displacement. An approach similar to [15] was also reported under the condition that the displacement was < λ/2 [16]. For vibration measurement using SM in a fiber ring laser, FFT was proposed to improve the measurement accuracy of the frequency of vibration (maximum error of about 10%) while the stop order of the harmonic components was proportional to the amplitude of vibration (maximum error of about λ0/8) [17]. Likewise, an FFT based dominant
harmonic order determination was also used for an SM vibration sensor operating over wide optical feedback regimes resulting in an accuracy of λ0/12 [18]. For velocity and flow
sensing using single or multi-channel SM signals, use of FFT is ubiquitous as it enables a straight forward localization of the Doppler frequency in the SM spectra [19, 20]. Recently, period-one oscillation in SMI has been used to measure displacement by using laser relaxation oscillation frequency [21]. Likewise, a frequency analysis performed directly on SM signal led to the measurement of refractive index with high accuracy [22].
To the best of authors’ knowledge, spectral processing of unwrapped SM interferometric signal phase for varying OF strength has not been carried out in the context of target displacement retrieval (except for the work by the authors reported in [23] which has been significantly developed in the present paper). It will be seen in this paper that spectral processing of laser feedback phase within the framework of
1) more robust against variation in optical feedback strength as well as additive noise, 2) is able to deliver at least equivalent or better measurement accuracy (λ0/60) but also 3) replaces
their sequential and iterative signal segmentation and conjoint parameter estimation routines with fast Fourier transforms so that real-time implementations can be realized for high BW applications.
The paper is organized as follows. In section II, an overview of SMI and laser feedback phase unwrapping based displacement retrieval is presented. Section III elaborates the proposed Time Domain - Frequency Domain Signal
Processing (TFSP). Simulated- and experimental-results are
then presented in section IV and section V respectively. These results will indicate that improved measurement accuracy can be achieved by TFSP in the presence of noise even when the optical feedback coupling level varies significantly. A
Discussion about the performance of TFSP is undertaken in
section VI, followed by Conclusion. Let us start with theoretical introduction of SM phenomenon.
II. SELF-MIXING AND DISPLACEMENT SENSING
A. Overview of Theory of Self-Mixing
Laser beam is generated in the optical cavity of LD and a portion of the laser beam is backscattered from target (moving with displacement D(t)) and re-enters the active laser cavity. This causes a mixing of generated and phase-shifted back-scattered beams. This “self-mixing” causes fluctuation in the optical output power (OOP) of the laser, denoted as P(t), given by [2], where
𝑃(𝑡) = 𝑃0[1 + 𝑚cos[𝛷𝐹(𝑡)]] (1)
P0 is the emitted optical power under free-running
conditions, m is the modulation index and ΦF(t) is the laser
output phase in the presence of feedback, given by: 𝛷𝐹(𝑡) = 2𝜋
𝐷(𝑡)
𝜆𝐹(𝑡) 2⁄
(2)
where λF(t) is the emission wavelength subject to feedback.
𝛷𝐹(𝑡) is related to laser output phase in the absence of feedback 𝛷0(𝑡) by [24]:
𝛷0(𝑡) = 𝛷𝐹(𝑡) + 𝐶sin[𝛷𝐹(𝑡) + arctan(𝛼)] (3) where α is the line-width enhancement factor and
𝛷0(𝑡) = 2𝜋 𝐷(𝑡)
𝜆0⁄2 (4) The optical feedback coupling factor C is a fundamental parameter in SM. As C increases from zero, the laser operates into five different regimes [1, 2]. Generally, SM sensing is performed under weak feedback regime (C < 1), moderate feedback regime (1 < C < 4.6), or strong feedback regime (C > 4.6). However, moderate feedback regime is usually preferred over others as the apparently simple saw-tooth shaped SM fringes belonging to such a regime [25] intrinsically provide motion direction indication and require simplified SM fringe detection processing (while both tasks are difficult to achieve for weak feedback regime). It may also be noted that a stabilization of the SM sensor to moderate feedback regime has been demonstrated e.g. by incorporating adaptive optics to the SM sensor in a feedback loop [11].
Fig. 2: (a) Harmonically vibrating target with peak to peak amplitude of 3.24 µm and corresponding different SM signals for α=4, λ=785nm, and (b) C=0.5 (weak feedback regime), (c) C=1.25, (d) C=2.5 (moderate feedback regime) and (e) C=5 (high feedback regime).
this work in other works.
DOI: 10.1109/JSEN.2019.2935087
Let us now summarize the general method of how D(t) can be retrieved from P(t) by unwrapping the underlying laser phase, common to [8-14].
B. Displacement Retrieval using Laser Phase Unwrapping
Displacement retrieval using unwrapping of laser feedback phase [8-14] is essentially based on solution of eq. (1-4). It can be split up into two principal steps: 1) a rough estimation 𝛷̂𝐹(𝑡) of the phase ΦF(t) (see Fig. 3), followed by 2) an
analytical solution of eq. (3) based on estimation of C and α in order to recover Φ0(t).
The first step thus results in the rough estimation 𝛷̂𝐹(𝑡) of the phase ΦF(t). After an Automatic Gain Control (AGC) of
P(t) to get P(t)/P0 ranging over a ±1 interval, an arc-cosine
function is used to get ΦF(t)mod-π (eq. 1). Then, SM fringes
(discontinuities) are detected, where each SM fringe is assumed to correspond to a displacement of λ0/2 of the remote
target (or a phase shift of 2π in Φ0(t)). An integrator then adds
or subtracts 2π to ΦF(t)mod-π, depending on the sign of the
discontinuity associated with an SM fringe. Addition of
ΦF(t)mod-π with the staircase-shaped output 𝛷𝐹𝑠(𝑡) of integrator results in retrieval of 𝛷̂𝐹(𝑡), also denoted as roughly unwrapped phase (RUP).
The second step deals with the solution of the excess phase equation (3), which requires either estimation of C and α parameters (e.g., by applying iterative minimization routines
on (3)) or by using pre-calibrated values of C and α. This then leads to an approximation of free-running laser phase Φ0
proportional to target motion D(t), as per (4).
Let us now focus on our proposed TFSP that improves the accuracy as well as sequential computational aspect of PUMs through spectral analysis of 𝛷̂𝐹(𝑡).
III. TIME DOMAIN -FREQUENCY DOMAIN SIGNAL PROCESSING A closer look into the working of the two principal steps of PUMs indicates that the first step is relatively easy to implement and results in 𝛷̂𝐹(𝑡). The second step, requiring C and α estimations, however, is more complicated to implement. It was then decided to approach this second step in a different manner.
A. Spectral Analysis of the Rough Feedback Phase 𝛷̂𝐹(𝑡) Instead of focusing on temporal properties of 𝛷̂𝐹(𝑡), it was decided to proceed by observing the evolution of 𝛷̂𝐹(𝑡) in frequency domain. Thus, FFT analysis of 𝛷̂𝐹(𝑡) was carried out to evaluate if the seemingly distorted temporal-shape of 𝛷̂𝐹(𝑡) can be better processed in frequency domain so that a better and/or efficient recovery of 𝛷̂0(𝑡) is made possible. The aim here is to identify the relevant information within the SM spectrum (FFT) and to estimate the errors that can be generated by discarding some portion of SM spectrum (FFT peaks).
As it can be expected from the dependence of the SM fringe shape on C value, the spectral properties of RUP signal are strongly dependent on C. More precisely, the richness in the higher frequency content of SM signal spectrum increases as
C increases from C<1 to C>1 because the sinusoidal shaped
fringes of weak feedback regime signals become increasingly asymmetric to take up saw-tooth like shape inclusive of sharp discontinuities (see Fig. 2). As a result, the RUP signal (derived from SM signal) becomes increasingly staircase like in shape and contains sharp discontinuities for higher C value. This then invariably results in higher amplitudes of those harmonics contained in RUP’s spectrum which do not belong to target vibration(s).
This analysis can be corroborated with the results obtained in [11] and [14] where it is shown that the reconstructed error based on the CSU method depends on C. In the same papers, it is also shown that the error also increases for low 𝐶 values and an optimal 𝐶 value approximately equal to 1.5 was found. This can be explained by the error induced by the arc-cosine function as demonstrated in [9]. This error can be reduced if a better unwrapping function can be used instead [9].
To analyze the spectrum of the laser feedback phase, let’s focus on the staircase function 𝛷𝐹𝑠(𝑡) for the sake of simplicity as its analysis can lead to a better identification of the relevant FFT peaks and reconstruction-error estimations. As a result, for a sinusoidal displacement of amplitude A, 𝛷𝐹𝑠(𝑡) can be expressed by summing rectangular function Π as follows: 𝛷𝐹𝑠(𝑡) = 2𝜋 ∑ ∑ ∏ ( 𝑡−(2𝑘+1)𝑇2 𝑇−𝑡𝑖 ) ∞ 𝑘=−∞ 𝑁 𝑖=1 + 𝛷𝑖𝑛𝑖𝑡 (5)
where 𝑡𝑖 corresponds to the time when the 𝑖𝑡ℎ fringe discontinuity occurs, and N corresponds to the number of Fig. 3: Schematic block diagram of proposed Time Domain - Frequency
fringes within half a period (𝑁 = 𝑓𝑙𝑜𝑜𝑟(4𝐴/𝜆0)). 𝛷𝑖𝑛𝑖𝑡 is the initial phase. Note that ti can be expressed as follows:
∀ 𝑖 ≤ 𝑁, 𝑖 > 0, 𝑡𝑖= 𝑇 2πarccos ( 𝑖λ0 2𝐴− 1 + 𝛿0 𝐴) (6) where 𝛿0 depends on the experiment’s initial condition: 0 ≤ 𝛿0 < λ0/2. Here, for the sake of simplicity, 𝛿0 is supposed to be nil and the SM signal hysteresis that occurs for 𝐶 > 1 is not taken into account.
Further, as 𝛷𝐹𝑠(𝑡) is a periodic function, it can be described as a Fourier series: 𝛷𝐹𝑠(𝑡) = 2𝜋 ∑𝑁𝑖=1𝛷𝐹𝑠𝑖 (7) where Φ𝐹𝑠𝑖= 𝑎𝑖,0+ ∑∞𝑛=1𝑎𝑖,𝑛cos ( 2π𝑛 𝑇 𝑡) (8) and 𝛷𝐹𝑠𝑖 is the Fourier series of ∑ Π (
𝑡−(2𝑘+1)𝑇2 𝑇−𝑡𝑖 ) ∞
𝑘=−∞ . Note
that here due to the expression chosen for 𝑡𝑖 in (6), 𝛷𝐹𝑠𝑖 is described as an even function. Fig. 4 shows a possible representation of 𝛷𝐹𝑠 as a sum of the 𝛷𝐹𝑠𝑖 for a better understanding.
The Fourier coefficient of interest can be computed and expressed as follows: ∀𝑖 ≤ 𝑁, 𝑖 > 0 𝑎𝑖,𝑛= − 2 𝑛πsin ( 2𝑛π 𝑇 𝑡𝑖) (9) The 𝑛𝑡ℎ harmonic amplitude 𝐴𝑛 of 𝛷𝐹𝑠 is given then by:
∀𝑛 ∈ 𝑁∗ 𝐴 𝑛= 4 𝑛|∑ sin ( 2𝜋𝑛 𝑇 𝑡𝑖) 𝑁 𝑖=1 | (10)
It can be interesting to compare the amplitude of the displacement 𝐴 to the fundamental 𝐴1 of 𝛷𝐹𝑠. As shown in Fig. 5, the peak/maximum error 𝜀 = |𝐴1− 𝐴| is lower than 80 nm. Thus, even in the case of high 𝐶 value, the information
relative to the amplitude of the vibration is mostly embedded in 𝐴1. It is also interesting to note in Fig. 5 that this error decreases rapidly with an increasing displacement amplitude. More importantly, as this analysis estimates only the maximum error based on the FFT of 𝛷𝐹𝑠(𝑡), so even better results can be expected to be obtained with 𝛷̂𝐹(𝑡).
B. TFSP Algorithm
Based on the previous analysis, the proposed TFSP algorithm identifies only all the fundamental FFT coefficients embedded in the FFT of 𝛷̂𝐹(𝑡) to achieve the target displacement reconstruction.
The block diagram of the ensuing TFSP algorithm is presented in Fig. 3. As already mentioned, it was decided to keep the first step of PUM. This results in recovering 𝛷̂𝐹(𝑡). Then, the second step is replaced with a frequency domain analysis and filtering of 𝛷̂𝐹(𝑡) (see Fig. 3). This is achieved with an FFT based filtering. This filtering uses a threshold, denoted 𝛷𝑡ℎ (next subsection is devoted to 𝛷𝑡ℎ parameter) to Fig. 4: Plot of the staircase approximation 𝜱𝑭𝒔 (red curve) compared to
the plot of the phase 𝜱𝟎(𝒕) induced by the displacement (blue).
Fig. 5: Plot of the error 𝛆 = |𝐀𝟏− 𝐀| vs the displacement amplitude 𝑨.
Fig. 6: Frequency domain processing of TFSP: (a) simulated target vibrating at 63Hz with 5λ amplitude, (b) corresponding SM signal with C = 1.65 and α = 5 (c) roughly estimated phase (d) Raw FFT signal (in blue), threshold (in dashed green) and Filtered FFT signal (in red) (e) Filtered RUP output signal (in red) as compared to roughly estimated phase based output vibration (in blue) , and (f) error between TFSP output and reference target motion.
this work in other works.
DOI: 10.1109/JSEN.2019.2935087
distinguish the frequency component(s) corresponding to the target's vibration(s) from both irrelevant harmonics generated by SM signal (and directly related to C) and noise. Then, the unwanted noise and harmonics contained in the spectrum of 𝛷̂𝐹(𝑡) are filtered and finally, use of Inverse FFT (IFFT) allows retrieval of 𝛷̂0(𝑡).
Fig. 6 demonstrates the filtering of RUP signal in frequency domain along with filtered RUP signal for a simulated SM signal (shown in Fig. 6 (b) whose C value is 1.65) corresponding to remote target vibrating at 63Hz with 5λ amplitude shown in Fig. 6 (a). A portion of time-domain roughly estimated phase 𝛷̂𝐹(𝑡) is seen in Fig. 6 (c) while its FFT is presented in Fig. 6 (d) using blue line. Using a hard thresholding based on 𝛷𝑡ℎ (indicated by the dashed green line in Fig. 6 (d)), frequency domain signal of 𝛷̂𝐹(𝑡) is filtered (shown using red line in Fig. 6 (d)). It can be seen that the TFSP enables retrieval of remote target movement (Fig. 6 (e)) with very small root mean squared (RMS) error (rms value of 2.16 nm and maximum error of 3.06 nm (as seen in Fig. 6 (f)) for SM signal of Fig. 6 (b).
C. Determination of Threshold Level
The determination of appropriate level of threshold 𝛷𝑡ℎused
in the filtering step to separate the signal (frequency components corresponding to actual target vibrations) from noise and secondary harmonics generated by SM signal depends upon the spectral properties of RUP signal which depend on 1) C parameter, 2) peak to peak vibration amplitude, and 3) additive noise.
Note that by using equation (10), the amplitude of the 𝛷𝐹𝑠 harmonics can be easily computed as a function of the amplitude (see Fig. 7). From Fig. 7, it results that a conservative value for 𝛷𝑡ℎ can be π/2 where the worst case
corresponds to a λ0 displacement. However, this approach
does not take into account the smoothing contribution effect of
𝛷̂𝐹−𝑚𝑜𝑑 2𝜋(𝑡) to the 𝛷̂𝐹(𝑡) FFT spectrum. Therefore, it is of most interest to reduce as much as possible the previously estimated threshold value, so as to consider target vibration(s) with amplitude as small as possible.
So, let us characterize how the amplitudes of noise spectrum of RUP vary due to above-mentioned three factors.
Firstly, the higher frequency spectral content of an SM signal increases in BW due to increase in C value. This then invariably results in higher amplitudes of those harmonics contained in RUP’s spectrum which do not belong to target vibration(s). Further, as suggested by Fig. 7, the harmonic amplitudes become of greater importance for small displacements. The same can be observed in Table I (tabulated for a harmonically vibrating target and α = 5) where increase in C results in an increase of the amplitude of the secondary tone 𝐴𝑠𝑒𝑐 (where the term secondary tone signifies that frequency having the highest amplitude in the RUP spectrum after excluding the main tone(s) corresponding to target vibration(s)).
Secondly, amplitudes of main tone denoted as 𝐴𝑚 and 𝐴𝑠𝑒𝑐 are also a function of peak to peak vibration amplitude denoted as 𝐴𝑝−𝑝. This can be noted in Table I for 𝐴𝑝−𝑝 of 8λ, and λ respectively. Understandably, the main tone amplitude directly and significantly changes as a function of vibration amplitude. On the other hand, secondary tone amplitude comparatively increases as 1) main tone amplitude decreases or as 2) C increases. Expectedly, 𝐴𝑠𝑒𝑐 is higher for lower displacement amplitude as the quantization effect on 𝛷̂𝐹(𝑡) becomes more prominent (in a manner similar to digital-to-analog converter’s resolution). Therefore, it can be deduced that, as expected, the worst case is obtained for high C value Fig. 7: Amplitude of the 𝐢𝐭𝐡 harmonics of 𝜱
𝑭𝒔 versus the amplitude of
the displacement.
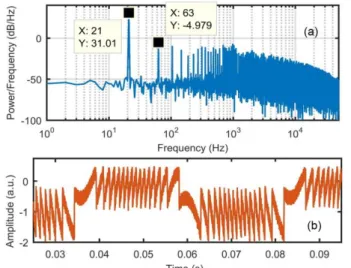
Fig. 8: (a) Spectrum of RUP in the presence of additive noise for (b) SM signal with C=3.75, α=5, D(t)=(8λ)sin(2π21t) and SNR = 6 dB.
Table I
SIMULATIONS REGARDING THE ESTIMATION OF THRESHOLD LEVEL
𝛷𝑡ℎUSED IN TFSP AS A FUNCTION OF C AND VIBRATION AMPLITUDE 𝐶 Am (dB) Asec (dB) Am (dB) Asec (dB) Ap-p = 8λ Ap-p = λ 0.75 31.03 -9.84 13.32 -7.00 1.75 31.04 -8.95 13.48 -4.41 2.75 31.03 -8.10 13.45 -2.77 3.75 31.01 -5.58 13.19 -1.54 Table II
SIMULATIONS REGARDING THE ESTIMATION OF 𝛷𝑡ℎAS A FUNCTION OF ALPHA FOR C=4.00 AND VIBRATION AMPLITUDE = Λ
Am (dB) Asec (dB) Am (dB) (dB) Asec Am (dB) (dB) Asec α = 3 α = 5 α = 7 13.05 -1.31 13.05 -1.33 13.06 -1.34
and small displacement. The same is again seen in the results of Table II based on C = 4.00, and 𝐴𝑝−𝑝 = λ, while α has been varied from 3 to 7. Table II thus also presents the expectedly minor impact of α on 𝛷𝑡ℎ as well.
Thirdly, impact of additive noise on the setting of 𝛷𝑡ℎ has
also been studied. Fig. 8 (a) presents the spectrum of RUP for SM signal (see Fig. 8 (b)) with C = 3.75, SNR = 6 dB and vibration amplitude of 8λ. It is thus seen that spectral processing of RUP remains advantageous as any additive noise affecting the time-domain SM signal is equally distributed in the frequency spectrum of RUP. Thus, the main tone amplitude 𝐴𝑚 is very slightly affected even when SNR decreases from infinity down to 6 dB.
So, based on this complementary analysis, the highest value of secondary tone can be used to set the minimum 𝛷𝑡ℎ which
turns out to be -1.31 dB as per Table I and Table II. 𝛷𝑡ℎ= -1
dB (roughly corresponding to 𝜋/4) has been used to process all simulated SM signals reported in Table III.
IV. SIMULATED RESULTS
A. TFSP Performance as a function of C and α
TFSP performance has been quantified as function of key optical feedback parameters C and α. Numerous SM signals were simulated (e.g. see Fig. 2) for harmonic remote target vibration(s) and processed using the proposed TFSP method.
For weak feedback regime signals (C<1), accurate fringe detection (FD) becomes increasingly difficult as C decreases towards 0, especially in the presence of noise. If FD can be ensured then TFSP provides good measurement performance (Table III) for weak- and moderate- feedback regime signals.
Likewise, α parameter was also varied, by using typical values in the range of [3-7] associated with Fabry-Perot based laser diodes typically used for SM sensing. As opposed to impact of C, the impact of variation in α is secondary on TFSP performance.
As seen in Table III, using λ =785nm, RMS error for these simulated cases was calculated by comparing the retrieved displacement with the simulated harmonic target motion of 10 µm amplitude. These SM signals were of one second duration sampled at the rate of 105 samples per second.
Effect of additive noise has also been evaluated. Table III presents the RMS error results for two specific SNR values of 40 dB and 6dB for different values of C and α parameters. For
C < 1 cases, FD becomes increasingly erroneous for smaller C
values and lower SNR signals leading to improper processing.
However, as correct FD is ensured then an accuracy of about 5 nm RMS (∼ λ/150) can theoretically be obtained by TFSP for weak- and moderate-regime SM signals with realistic noise.
B. Performance in case of variable optical feedback
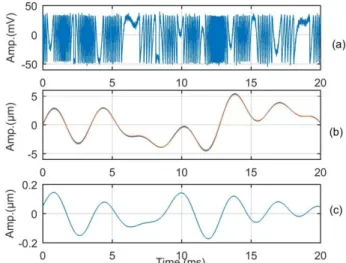
Lastly, the ability of proposed TFSP in correctly processing SM signals affected by continuously varying OF strength has also been simulated and compared against PUM. For this purpose, C factor was continuously varied, as shown in Fig. 9 (b). The corresponding SM signal is shown in Fig. 9 (a) in the presence of additive noise while remote target motion
D(t)=(3.5λ)sin(2π21t) is indicated in Fig. 9 (c). The error
curves of both TFSP and PUM are shown in Fig. 9 (d) using red- and blue- lines respectively. Specifically, the rms error of TFSP is 4.2 nm while that of PUM is 22.1 nm. Likewise maximum error of TFSP is 6.1 nm while that of PUM is 63.4 nm. The optimized C obtained by PUM is 3.34. It thus indicates the inability of PUM for processing SM signals with continuously varying OF. PUM performance is understandably degraded as it assumes a constant OF level for the SM signal under processing. The proposed TFSP, on the other hand, does not suffer in case of variations in C as it does not require parameter estimations.
V. EXPERIMENTAL RESULTS
A. Experimental Set-up
The experimental set-up put in place to validate TFSP has been schematized in Fig. 1. The used SM sensor is based on Hitachi HL7851 laser diode package emitting at λ=785 nm with an output power of 50 mW. The SM signal has been acquired by using the built-in photo-diode, located at the back facet of laser diode package. A commercial PZT (piezoelectric transducer) actuator from Physik Instrumente (P753.2CD) has been used as target. This device has a built-in capacitive
REFERENCE TARGET MEASUREMENT AS A FUNCTION OF C AND ALPHA PARAMETERS FOR SPECIFIC SNR
C Error (nm) for SNR = 40 dB Error (nm) for SNR = 6 dB α = 3 α = 5 α = 7 α = 3 α = 5 α = 7 0.5 6.10 5.89 5.89 695 817 871 0.8 6.65 6.54 6.48 682 643 665 1.1 2.54 2.31 2.19 3.1 2.8 2.7 1.5 2.11 1.79 1.71 3.0 2.9 2.7 2.5 1.85 2.66 2.51 1.3 1.4 1.3 3.5 3.55 1.33 1.22 19.6 19.7 19.7
Fig. 9 (a) Time varying SM signal due to (b) continuous variation in optical feedback factor C, (c) remote target motion D(t)=(3.5λ)sin(2π21t), and (d) error curves of TFSP and PUM shown with red- and blue- lines respectively.
this work in other works.
DOI: 10.1109/JSEN.2019.2935087
feedback sensor with 2nm resolution that was later used as reference sensor to quantify error performances.
B. Vibration Measurements
Firstly, different experimental SM signals for a PZT vibration of 5µm were acquired where each of these had a different C value. Secondly, different experimental SM signals corresponding to multi-tone PZT vibrations were also acquired and processed using TFSP and PUM [8]. Fig. 10 presents a segment of experimental SM signal, its TFSP based processing, and error result as compared with reference commercial PZT sensor for the target vibration signal composed of tones at 45 Hz, 90 Hz, 225 Hz, and 315 Hz. Note that additional tones are 2nd, 5th, and 7th harmonic of 45 Hz
tone. Thus, there is spectral overlap between the harmonics of different tones within RUP’s spectrum, and is a difficult case to process as compared to the processing of unrelated tones. Table IV presents the RMS- and maximum-error between PZT sensor and TFSP based vibration signal for these SM signals. From Table IV, it is seen that error results of TFSP remain consistently better than those of PUM [8], even when spectral overlap exists between the harmonics of different tones. Likewise, error results understandably degrade as more and more tones are added to the vibration of the remote target.
VI. DISCUSSION
As the proposed TFSP is a digital signal processing technique so its maximum operating frequency is limited by the sampling frequency 𝑓𝑠 of the employed analog-to-digital converter and by the number of acquired samples. In turn, maximum 𝑓𝑠 needs to be set as per the maximum analog bandwidth of the SMI sensor, by following the Nyquist criterion. Likewise, when 𝑀 − 𝑝𝑜𝑖𝑛𝑡 𝐹𝐹𝑇 is taken then spectral resolution is 𝑓𝑠/𝑀. For correct processing, TFSP requires high spectral resolution so that all frequency tones making up the actual target motion are correctly resolved (or observed) in RUP’s spectrum.
The superior performance of TFSP may be explained by its judicious use of features of both time- and frequency- domains as it keeps the first time-domain step of the PUM [8] that results in a RUP signal and then utilizes the robustness of frequency-domain analysis (instead of using parametric estimations). This modification has resulted in an improved measurement accuracy of TFSP for weak- and moderate- feedback regime signals with faster computational processing (by a factor of 3.45, based on emulation of TFSP and PUM on FPGA Virtex6 device using VHDL (VHSIC Hardware Description Language) due to the removal of conjoint minimization routines used in PUM [8].
Significantly, for weak- and moderate- feedback regime SM signals, the accuracy performance of TFSP is comparable even with those improved PUMs [9, 10] that have remedied some shortcomings of PUM [8] through incorporation of sub-fringe segmentations leading to local feedback phase inversions [9, 10]. TFSP, however, is able to deliver better or comparable accuracy results while not making use of these additional segmentations and phase inversions.
VII. CONCLUSION
A spectral analysis has been incorporated in the general framework of laser phase unwrapping methodology so that faster and better vibration sensing can be achieved by using a Self-Mixing (SM) interferometric Laser Diode (LD) based sensor for weak- and moderate- optical feedback regimes.
The incorporation of frequency domain filtering in the light of spectral analysis of laser phase under optical feedback allows us to not only improve the measurement accuracy in a faster manner but also recover information about target movement frequency composition that can be used for modal analysis applications. The performance of proposed TFSP is even comparable with those sophisticated unwrapping methods that have made use of additional localized SM signal segmentations and phase inversions [9, 10]. Furthermore, TFSP has been found to be robust in case of variations in the optical feedback coupling factor as well as in case of additive noise. For 1<C<4, TFSP has provided < 20nm RMS error (~λ/45) for noisy experimental SM signals corresponding to micro-metric harmonic vibrations measured by using an SM sensor emitting at 785nm. For reduced range of 1<C<2, TFSP Fig. 10:Multi-tone PZT target vibration signal composed of tones at 45
Hz, 90 Hz, 225 Hz, and 315 Hz. (a) a segment of corresponding experimentally acquired SM signal , (b) retrieved multi-tone vibration using TFSP (in red) and reference PZT sensor based measurement (in blue), and (c) error = difference between the two signals shown in (b).
Table IV
ERROR IN VIBRATION RETRIEVAL BETWEEN REFERENCE COMMERCIAL
PZT SENSOR AND PROCESSED EXPERIMENTAL SM SENSOR SIGNALS
N o 𝐶̂ [8] PZT Frequency (Hz) RMS Error (nm) Max. Error (nm) TFSP PUM TFSP PUM 1 0.76 90 18.5 48.9 25.8 166.5 2 1.26 90 7.3 37.8 10.2 129.4 3 1.35 160 12.2 42.6 17.3 124.2 4 1.86 200 5.2 38.2 7.3 117.9 5 2.07 90 7.1 53.1 10.0 118.4 6 2.83 90 18.1 21.7 25.2 51.9 7 3.49 90 18.9 30.9 26.5 68.3 8 2.39 70, 210 38.8 52.8 80.0 182.9 9 2.57 70, 210 37.6 52.6 78.3 176.0 10 2.02 45, 90, 225, 315 78.9 91.1 145.1 300.6 11 2.21 45, 90, 225, 315 82.5 97.6 151.8 307.1
vibration measurements can be consistently obtained by using TFSP if the SM sensor is robustly stabilized to the specific C range e.g. by using adaptive optics in a feedback loop [11].
REFERENCES
[1] T. Taimre, M. Nikolić, K. Bertling, Y. L. Lim, T. Bosch, and A. D. Rakić, "Laser feedback interferometry: A tutorial on the self-mixing effect for coherent sensing," Advances in Optics and Photonics, vol. 7, pp. 570-631, 2015.
[2] S. Donati, "Developing self‐mixing interferometry for instrumentation and measurements," Laser & Photonics Reviews, vol. 6, pp. 393-417, 2012.
[3] S. Ottonelli, F. De Lucia, M. di Vietro, M. Dabbicco, G. Scamarcio, and F. P. Mezzapesa, "A compact three degrees-of-freedom motion sensor based on the laser-self-mixing effect," IEEE Photonics Technology Letters, vol. 20, pp. 1360-1362, 2008.
[4] A. A. Siddiqui, U. Zabit, O. D. Bernal, G. Raja, and T. Bosch, "All Analog Processing of Speckle Affected Self-Mixing Interferometric Signals," IEEE Sensors Journal, vol. 17, pp. 5892-5899, 2017. [5] G. Giuliani, S. Bozzi-Pietra, and S. Donati, "Self-mixing laser diode
vibrometer," Measurement Science and Technology, vol. 14, p. 24, 2002.
[6] Z. Wei, W. Huang, J. Zhang, X. Wang, H. Zhu, T. An, et al., "Obtaining Scalable Fringe Precision in Self-Mixing Interference Using an Even-Power Fast Algorithm," IEEE Photonics Journal, vol. 9, pp. 1-11, 2017.
[7] C. Jiang, C. Li, S. Yin, and Z. Huang, "Multiple self-mixing interferometry algorithm based on phase modulation for vibration measurement," Optical and Quantum Electronics, vol. 49, p. 111, 2017.
[8] C. Bes, G. Plantier, and T. Bosch, "Displacement measurements using a self-mixing laser diode under moderate feedback," IEEE transactions on instrumentation and measurement, vol. 55, pp. 1101-1105, 2006.
[9] O. D. Bernal, U. Zabit, and T. Bosch, "Study of laser feedback phase under self-mixing leading to improved phase unwrapping for vibration sensing," IEEE Sensors Journal, vol. 13, pp. 4962-4971, 2013.
[10] Y. Fan, Y. Yu, J. Xi, and J. F. Chicharo, "Improving the measurement performance for a self-mixing interferometry-based displacement sensing system," Applied Optics, vol. 50, pp. 5064-5072, 2011.
[11] O. D. Bernal, U. Zabit, and T. M. Bosch, "Robust method of stabilization of optical feedback regime by using adaptive optics for a self-mixing micro-interferometer laser displacement sensor," IEEE Journal of Selected Topics in Quantum Electronics, vol. 21, pp. 336-343, 2015.
[12] A. L. Arriaga, F. Bony, and T. Bosch, "Real-time algorithm for versatile displacement sensors based on self-mixing interferometry," IEEE Sensors Journal, vol. 16, pp. 195-202, 2016.
[13] S. Merlo and S. Donati, "Reconstruction of displacement waveforms with a single-channel laser-diode feedback interferometer," IEEE journal of quantum electronics, vol. 33, pp. 527-531, 1997. [14] A. Ehtesham, U. Zabit, O. Bernal, G. Raja, and T. Bosch, "Analysis
and Implementation of a Direct Phase Unwrapping Method for Displacement Measurement using Self-Mixing Interferometry," IEEE Sensors Journal, vol. 17, pp. 7425-7432, 2017.
[15] M. Wang, "Fourier transform method for self-mixing interference signal analysis," Optics & Laser Technology, vol. 33, pp. 409-416, 2001.
[16] Y. Zhang, Y. Yu, J. Yao, P. Wang, and J. Chen, "Analysis of self-mixing interference signals in LD-pumped solid state laser using fast Fourier transform technique," in Advanced Materials and Devices for Sensing and Imaging, 2002, pp. 488-493.
[17] X. Dai, M. Wang, Y. Zhao, and J. Zhou, "Self-mixing interference in fiber ring laser and its application for vibration measurement," Optics express, vol. 17, pp. 16543-16548, 2009.
[18] Z. Huang, X. Sun, and C. Li, "Self-mixing interference signal analysis based on Fourier transform method for vibration
[19] M. Norgia, A. Pesatori, and L. Rovati, "Self-mixing laser Doppler spectra of extracorporeal blood flow: a theoretical and experimental study," IEEE Sensors Journal, vol. 12, pp. 552-557, 2012.
[20] I. Ohno and S. Shinohara, "A comparative study for the assessment on blood flow measurement using self-mixing laser speckle interferometer," IEEE Transactions on instrumentation and measurement, vol. 57, pp. 355-363, 2008.
[21] B. Liu, Y. Ruan, Y. Yu, Q. Guo, J. Xi, and J. Tong, "Modeling for optical feedback laser diode operating in period-one oscillation and its application," Optics express, vol. 27, pp. 4090-4104, 2019. [22] Y. Zhang, Y. Wei, C. Chen, W. Huang, X. Wang, and H. Xu,
"Self-Mixing Interferometer Based on Frequency Analysis Method for Accurate Refractive Index Measurement," IEEE Photonics Journal, vol. 8, pp. 1-6, 2016.
[23] U. Zabit, O. Bernal, and T. Bosch, "Time-frequency signal processing for a Self-Mixing laser sensor for vibration measurement," in Sensors, 2012 IEEE, 2012, pp. 1-4.
[24] R. Lang and K. Kobayashi, "External optical feedback effects on semiconductor injection laser properties," IEEE Journal of Quantum Electronics, vol. 16, pp. 347-355, 1980.
[25] O. D. Bernal, U. Zabit, and T. Bosch, "Classification of laser self-mixing interferometric signal under moderate feedback," Applied optics, vol. 53, pp. 702-708, 2014.
Usman Zabit (M’12–SM’19) received the Ph.D. degree from Institut
National Polytechnique Toulouse (INPT), France, in 2010. Currently, he is Associate Professor at National University of Sciences and Technology, Islamabad, Pakistan. He is a recipient of the Prix Leopold Escande 2010 and the European Mechatronics Award from INPT and European Mechatronics Meeting 2010, respectively.
Olivier D. Bernal (M’03) received the M.Sc. degree in electrical engineering
and the Ph.D. degree from Institut National Polytechnique Toulouse (INPT), Toulouse, France, in 2003 and 2006, respectively. He joined the Laboratory of Optoelectonics and Embedded Systems, LAAS-CNRS and INPT in 2009, where he is currently an Assistant Professor. His main research interests are in analog circuit design for optoelectronics and space applications.
Saqib Amin completed his MS in electrical engineering from Riphah
International University in 2017. Currently, he is a faculty member at Riphah International University, Islamabad, Pakistan. His research interests include digital design and signal processing for sensing applications.
Muhammad Farrukh Qureshi completed his MS in electrical engineering
from Riphah International University in 2015. Currently, he is a faculty member at Riphah International University, Islamabad, Pakistan. His research interest includes analog and digital signal processing.
Arsalan Habib Khawaja earned his PhD at University of Electronic Science
and Technology of China. He is currently working in U.S. - Pakistan Center for Advanced Studies in Energy at National University of Sciences and Technology of Pakistan. His current research interests include magnetic field based measurement and monitoring for power systems, magnetic energy harvesters and innovative instrumentation problems.
Thierry Bosch (M’93–SM’06) is a Professor with Institut National
Polytechnique Toulouse-ENSEEIHT and member of the Optoelectronics for Embedded Systems Research Group, LAAS-CNRS. His research interests include laser industrial instrumentation development, including range finding techniques, vibration and velocity measurements. He is presently Vice President of IEEE IM France.