HAL Id: hal-01129626
https://hal.archives-ouvertes.fr/hal-01129626
Submitted on 27 Mar 2015HAL is a multi-disciplinary open access archive for the deposit and dissemination of sci-entific research documents, whether they are pub-lished or not. The documents may come from teaching and research institutions in France or abroad, or from public or private research centers.
L’archive ouverte pluridisciplinaire HAL, est destinée au dépôt et à la diffusion de documents scientifiques de niveau recherche, publiés ou non, émanant des établissements d’enseignement et de recherche français ou étrangers, des laboratoires publics ou privés.
Does playing O.zen improve our well-being?
Ana Júlia Moreira, Laurent Sparrow, Yann Coello, Odile Viltart, Sabrina
Hassaini, Mathieu Méquinion, Olivier Janin, Cédric Mondamert, Sebastien
Kochman
To cite this version:
Ana Júlia Moreira, Laurent Sparrow, Yann Coello, Odile Viltart, Sabrina Hassaini, et al.. Does playing O.zen improve our well-being?. [Research Report] SCALab UMR 9193, Université de Lille. 2015. �hal-01129626�
February 2015
O.ZEN STUDY
Does playing O.zen improve our well-being?
Collaborators
Ana Julia Moreira 1, Laurent Sparrow 1, Yann Coello 1, Odile Viltart 2, Sabrina Hassaini 1, Mathieu Méquinion 2, Olivier Janin 3, Cédric Mondamert 4, Sebastien Kochman 4
1Université de Lille, SCALab, CNRS UMR 9193, Lille, France
2Université de Lille, CRM J-P Aubert, INSERM UMR 837, Lille, France 3Neotrope, Lille, France
ii
Abstract
Stress is considered to be an individual’s response to different pressures and demands in a particular environment (Pottier et al., 2011). In an ever more demanding and stressful world, many options for people to learn how to relax and how to deal with a challenging lifestyle are becoming available. O.zen is a great alternative, since it is a ludic and not expensive device, which goal is to help people to relax with the help of breathing games that can easily be accomplished no matter what time of the day or context. The goal of this study was to test O.zen’s efficiency. In order to do so, neuropsychological tests were held throughout the experiment to 28 participants that were divided in experimental (played O.zen) and control (watched videos equivalent to O.zen) groups. Also, cortisol levels and participants’ skin conductance was measured. Both groups showed overall improvements, with participants feeling significantly less anxious after playing O.zen, and showing a lower level of skin conductance. O.zen’s visuals and music seem to be beneficial on their own, with its biofeedback quality emphasizing the gains.
3
Index
Introduction ... 4 Methodology ... 6 Participants ... 6 Measurements ... 6 Cortisol ... 6 Skin Conductance ... 6 Psychological Test ... 7 Neuropsychological Tests... 7 Procedure ... 8 Results ... 8 Cortisol ... 8 Skin Conductance ... 9 Neuropsychological Tests ... 10 Discussion ... 13 Acknowledgments ... 14 Bibliography ... 15 Annex 1 ... xviii Annex 2 ... xix4
Introduction
The goal of this project was to test the efficiency of O.zen. This program uses a biological sensor that allows its user to learn how to control and maintain a constant physiological state, which facilitates cognition’s functioning and creates a state of well-being.
Biofeedback techniques are used to achieve these states (Jung, Yang, & Myung, 2012), with participants learning how to control their cardiac rhythm through their breathing. With the help of a sensor placed on an index finger and of a software with different synchronization ludic exercises of breathing-cardiac rhythm, one should be able to reduce stress level, which improves well-being, leaving people in a more favourable mental state in order to perform in their daily intellectual activities.
When the different neural circuits involved in the regulation of stress response function in harmony, the organism is in a favourable state for learning: memory functioning is more efficient, attention is easily focused while remaining flexible, and emotions are more positive too. When neural circuits are synchronized, there is a certain specific physiological activity that is easily identified (McCraty, 2005). The most commonly used physiological indicator to evaluate this state is the cardiac rhythm variability. Indeed, heartbeats are always different and expressing heart beat frequency with an average value of heartbeat per minute (BPM) does not allow the measurement of heartbeat fluctuations. By using temporal or frequency methodologies of signal treatment, it is possible to measure this variability – heart rate variability (HRV; Malik et al., 1996). The most interesting is that it appears that these rhythmic changes are correlated with some psychological and emotional states.
Cardiac coherence is defined by a harmonious set of variations, i.e. when there is a balance between accelerations and decelerations, while cardiac incoherence refers to some sort of chaos that translates into an unbalanced change between accelerations and decelerations. On one hand, in a state of cardiac coherence, rate variability has a regular and sinusoidal shape, which means that the two branches of the autonomous nervous system, namely the sympathetic and the parasympathetic systems, are synchronized. If an organism is found in such a state, tasks that demand attention, creativity or memory are better performed (Elliot, Payen, Brisswalter, Cury, & Thayer, 2011; Luft, Takase, & Darby, 2009). On the other hand, a stress state disrupts this cardiac coherence, and one can observe a global performance decrease, as well as a higher frequency of negative and unpleasant emotions (Andrews, Ali, & Pruessner, 2013).
Stress is commonly defined as a physiological, endocrinological, and psychological state provoked by a specific event, disrupting homeostasis (Lazarus, 2000), with anxiety being one of its major emotional manifestations (Pottier et al., 2011). The stress response involves the constant interaction of three major systems that include psychological strategies, as well as proper endocrine and physiological responses in order to re-establish a general balance (or homeostasis). These systems are necessary for the organism to cope adequately with the psychological and/or physiological endogenous or exogenous aggressions. Therefore, response to stress can be measured for each one of these dimensions: psychological (through the use of standardised tests), physiological (e.g.: cardiac coherence, as well as electrodermal activity), and hormonal (cortisol measurement; Webb et al., 2011).
5 Given that certain stressful situations disrupt general homeostasis, how should one re-establish the balance, which occurs when the organism is on a state of cardiac coherence? What should one do to restore this coherence? Heartbeats are under the control of the autonomous nervous system, therefore not being directly controlled by the individual. However, indirectly, through breathing, it is possible to change them: heart rate increases during an inhalation (parasympathetic inhibition induced by breathing), and it decreases during an exhalation (parasympathetic activation). These rhythmic modifications produced by breathing are called respiratory sinus arrhythmia (Ben-Tal, Shamailov, & Paton, 2012). Therefore, based on this reflex, it is possible to impose a particular rhythm to the heart, when controlling it by breathing.
Leaning on these principles, many studies have shown that cardiac coherence training allows the improvement of cognitive functioning, inducing individuals into a positive emotional state (Bourne & Yaroush, 2003; Luft et al., 2009). For example, one can reduce the level of stress, anguish and anxiety caused by punctual and specific situations (final exams, an accident…) by controlling cardiac rhythm and its variations through breathing. Thanks to this stress reduction, it becomes easier for individuals to make objective decisions. Stress, as well as other emotional states, has the power to alter thinking and decision making abilities (Andrews et al., 2013; Damasio, 1995). Therefore, reducing stress is beneficial for the organism.
Bradley and colleagues (2010; also see McCraty, 2005; Vitasari, Wahab, Herawan, & Sinnadurai, 2011), with the help of a system capable of controlling cardiac rhythm available to students in various universities in California, have shown that students who used this system controlled anxiety related to academic events (e.g.: exams) more efficiently than the rest. In fact, intelligence tests are better performed when the organism is in a state of cardiac coherence (Elliot et al., 2011). Also, in certain professions, in order to handle some difficult and complex situations, biofeedback, through the control of heart rate variability, also helps to improve work conditions (Chandler, Bodenhamer-Davis, Holden, Evenson, & Bratton, 2001; Cutshall et al., 2011). Various computer programs have proven to be effective in cardiac coherence management (Edwards, 2014; Henriques, Keffer, Abrahamson, & Horst, 2011), but present technical devices tend to be expensive and not easily accessible.
Still regarding stress management and the search of a state of well-being, many studies have also considered the role of sensory modalities, for instance, how scent, vision or hearing can influence one’s stress level and performance. Regarding the auditory modality, for instance, Sokhadze (2007) compared the effects of music and white noise after some stressful visual stimulation, finding out that music (whether subjectively perceived as pleasant or sad) restored baseline levels as in before the stressful event, compared to the white noise. Other studies have also shown how music can decrease anxiety and change physiological activity (e.g.: Andrade & Bhattacharya, 2003; Pelletier, 2004; Sutoo & Akiyama, 2004; Thorgaard, Henriksen, Pedersbæk, & Thomsen, 2004). Regarding vision, it seems that visual aesthetics may improve performance, if mediated by positive affect (Norman, 2004). In a study conducted by Moshagen, Musch, and Göritz (2009), participants used four versions of the same website. The authors manipulated usability (poor and good) and visual aesthetics (high and low), discovering that high visual aesthetics enhanced performance when the website usability was poor. Concerning odors, for instance, when Lehrner and colleagues (2000) arranged two rooms in a dentist’s office, one with an ambient odor of orange, and another one with no odor, they verified that participants going into the room with an odor showed a lower
6 level of state anxiety, a more positive mood, and a higher level of calmness compared to participants in the odourless room. These studies are quite interesting if one considers the rich multisensory environment a videogame provides to its players.
The goal of this study was to evaluate the efficiency of a new ludic and cheap system, O.zen, made for the general public, which promotes cardiac coherence cycles through self-learning based on biofeedback. The impact of this system on the organism functioning shall be measured in different ways: biologically, cortisol measurements in the form of saliva samples will be used in order to evaluate stress level. Psychologically, a questionnaire, such as the State-Trait Anxiety Inventory (STAI; Spielberger, Gorsuch, Lushene, Vagg, & Jacobs, 1983) will be used to measure anxiety as a state. In order to measure general cognitive efficiency (attention and memory), the D2 Test of Attention (Brickenkamp, 1981), as well as some tasks from the Test for Attentional Performance (TAP; Zimmermann & Fimm, 1997) will be used. Finally, physiologically, electrodermal activity will also be measured, through the use of an Affectiva Q Sensor bracelet (Picard, 2011). If this system is indeed efficient, one should observe a cognitive performance improvement, as well as a decrease of global stress level.
Methodology
Participants
Participants were recruited through advertisements mainly in L’Imaginarium, the building where the present study was conducted, being therefore a young (18 – 39 years old) and rather urban population. Twenty-eight healthy subjects participated in this experiment. Participants were randomly assigned either to the experimental or control group. The mean age of the experimental group (6 female and 8 male) was of 26.64 years old (DP = 5.20), whereas the mean age of the control group (4 female and 10 male) was of 26.86 years old (DP = 5.33). There were no significant differences between both groups, with both groups having participants with similar gaming habits (from non-players to players).
Measurements
Cortisol
In order to measure stress level, participants were asked to give three salivary samples during the experiment: after signing the consent form, and before and after playing O.zen. Salivary samples were made through the use of a salivette device (Sarstedt, Nümbrecht, Germany). All participants were asked to keep a piece of dry cotton inside their mouths for about a minute, in order to make it damp. All samples were kept at -20ºC before being analysed.
The dosage of salivary cortisol was performed with an ELISA kit (IBL International GMBH, Hamburg, Germany). All samples were analysed in duplicate. Intra and inter-assay coefficients of variation were < 4.8% and < 8.1%, respectively.
Skin Conductance
Skin conductance refers to electrodermal activity, that is, the electrical changes in the skin. These changes are mainly dependent on the activity of sweat glands innervated by the sympathetic branch of the ANS (Bach, Friston, & Dolan, 2010). Electrodermal activity is largely used to index levels of arousal, attention and emotion associated with environmental
7 conditions or individual differences (Sander & Scherer, 2009), providing a direct and clear representation of sympathetic activity (Dawson, Schell, & Filion, 2007)
Throughout the whole experiment, participants used an Affectiva Q Sensor bracelet (Picard, 2011), in order to measure activation levels in relation to cream application. Due to the lack of cables and light weight, this bracelet allowed participants to move freely. The bracelet was used on the wrist of the participant’s left hand.
Psychological Test
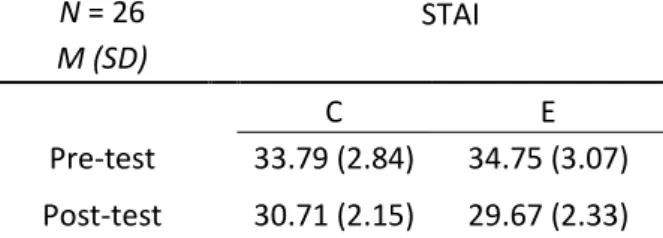
All participants replied to the State-Trait Anxiety Inventory (Spielberger et al., 1983) before and after the test phase. This questionnaire measures anxiety as a state (i.e., anxiety towards an event), and also as a trait (i.e., anxiety as a personal characteristic), through a list of different sentences answered by participants through a 4-point-Likert-scale. Regarding this study, anxiety as a state was the one of interest, with a higher score signifying a higher level of anxiety, and therefore stress.
Neuropsychological Tests
All participants answered these tests twice: before and after the test phase. The goal of using these neuropsychological tests was not only to put participants in a stressful situation, but also to see if participants’ performance changed before and after playing a game, as similar studies have done (e.g.: Boot, Kramer, Simons, Fabiani, & Gratton, 2008; Wolinsky et al., 2006)
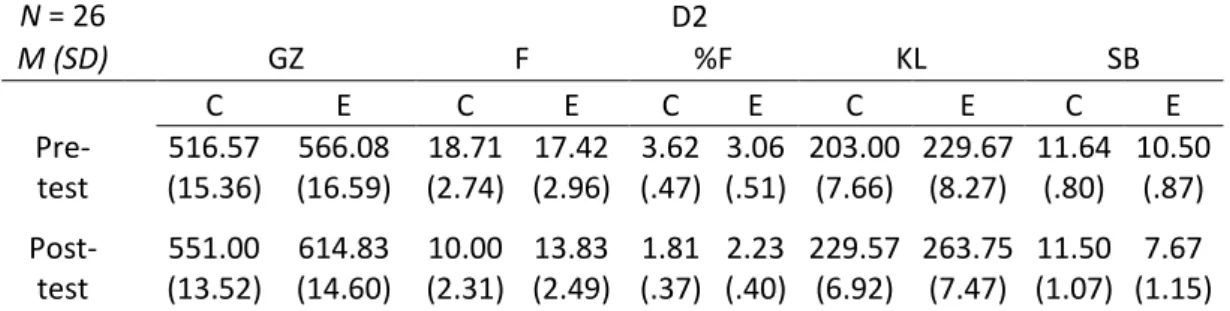
One of the neuropsychological tests used was the D2 Test of Attention (Brickenkamp, 1981), which measures selective and sustained attention, as well as visual scanning speed. Participants’ task is to cross out in a paper any letter “d” with two marks above or below it, in any given order, being these targets surrounded by very similar distractors. This test gives information through various indexes, them being: total efficiency score (GZ – in which the score shows the number of all processed stimuli per participant, being considered a suitable index for determining the speed of information processing); error core (F – error in this test is divided in two types: ignorance error or the error of skipping or committing, with the score including total errors of omission and commitment, working as an index for making attempt); percentage of errors (%F), concentration efficiency score (KL – that is the difference between commitment error and the number of target stimuli correctly marked); and change amplitude (SB – difference between maximum and minimum performance per participant).
Also, the Test for Attentional Performance, version 2.3, translated to French by Michel Leclercq was used (Zimmermann & Fimm, 2010). TAP is a set of fourteen simple different reaction paradigms made to assess attention’s functioning through reaction times and number of mistakes. For the present study, two TAP tasks were used. One of the tasks used was the
covert shift of attention task. This refers to the ability to focus visual attention on a certain part
of the surrounding space without changing gaze direction. This shift may occur due to exogenous stimuli that catch eyes’ attention, or it may occur endogenously, by voluntary re-orientation of attention to an attended or given event in space. In this task, a central cue (an arrow pointing to the left or to the right) indicates the expected side of the target stimulus (a cross), allowing to measure the endogenous control of attentional focus. The cue (arrows’ direction) is correct (valid) 80% of the trials and incorrect (invalid) in 20% of them. The other task used was a flexibility one. Paying attention to specific aspects of our surroundings is an active process, by which we turn our attention away from certain objects in order to effectively deal with other objects. In this task, a letter and a digit are presented
8 simultaneously on the screen, and participants have to press the left or right key depending on which side will the target stimulus (letter-number-letter-number…) appear.
Procedure
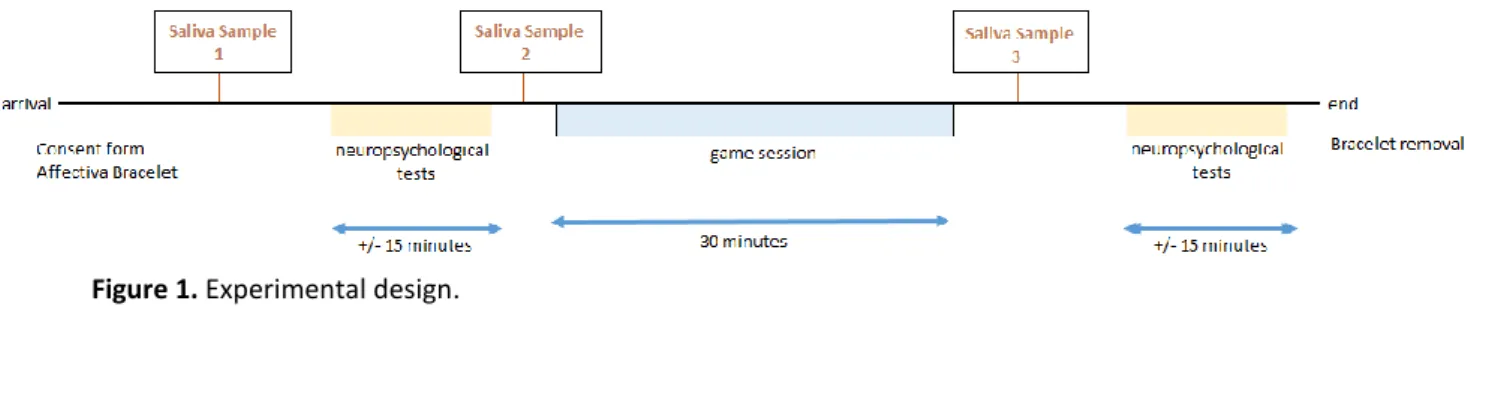
After signing the consent form, participants were given the Affectiva Q sensor bracelet. Following this, participants’ were asked for their first saliva sample (pre-test 1), and answered a questionnaire regarding their gaming habits (see Annex 1). After this, participants replied to the STAI questionnaire (short-form, 20 items), followed by the D2 Test of Attention, and TAP (covert shift of attention task, and flexibility task). This part took about thirty minutes to complete. Once participants’ finished these tests, they were asked for another saliva sample (pre-test 2). This part of the data collection is referred to pre-test.
Until here, all participations did the same, but as the goal was to test a product’s efficiency, while one group actually played O.zen (experimental group; see Annex 2, figure 2), the other one performed another task (control group), with the control group being presented the same visuals and music as the experimental group (i.e. videos), but given other tasks (e.g.: count the number of objects appearing on the screen; see Annex 2, figure 3). This part of the experiment took thirty minutes, being referred to test phase, for both groups.
Following this, participants were asked for a final saliva sample (post-test). Also, they performed the neuropsychological tests again, and in the same order than before. This also took about fifteen minutes, and it is referred as post-test. Each data collection took about one hour and a half to complete (see figure 1).
Figure 1. Experimental design.
Results
Two participants from the experimental group were excluded, as they did not play O.zen correctly. Therefore, all subsequent data analysis were carried out concerning 12 participants on the experimental group and 14 participants on the control group. Only significant results are reported.
Cortisol
A repeated-measures ANOVA was performed, considering the design of 2 (group: control vs. experimental) x 3 (time: pre-test 1 vs. pre-test 2 vs. post-test).
There was a time main effect, F (2, 23) = 7.67, p = .003, ŋ2
p = .40, 1-β = .92. Pairwise
9 .10) to test (M = .48, SD = .06; p = .006) and from pre-test 2 (M = .65, SD = .07) to post-test (M = .48, SD = .06; p = .003; see Table 1).
Skin Conductance
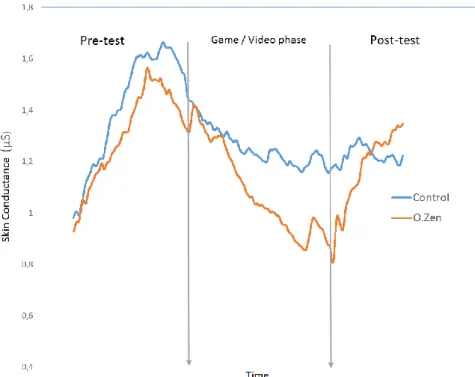
As depicted in Graphic 1, participants showed the same pattern of variation during the pre-test, with the control group showing a slightly higher level of skin conductance (blue line in Graphic 1). Interestingly, the experimental group (orange line in Graphic 1) showed a deep decrease of skin conductance level compared to the control group, during O.zen/video phase. Regarding the post-test, the most remarking thing is the fact that, although participants in the experimental group demonstrated an accentuated decrease of skin conductance level while playing the product, when performing the neuropsychological tests, their skin conductance level arose considerably fast, reaching the one shown by the control group, when performing the same task.
Graphic 1. Skin conductance (in microsiemens), throughout the whole data collection, in both
experimental (O.zen) and control groups.
N = 26 Cortisol M (SD) (µg/dL) C E Pre-test 1 .81 (.14) .67 (.15) Pre-test 2 .66 (.10) .65 (.11) Post-test .47 (.08) .50 (.09)
Table 1. Mean cortisol measurements, regarding the saliva samples asked throughout the experiment:
pre-test 1, when the person arrived; pre-pre-test 2, after performing the neuropsychological pre-tests; and post-pre-test, after performing their given task. Both control (C) and experimental (E) groups are depicted.
10
Neuropsychological Tests
Although STAI is a psychological test, in terms of paper organisation, results for STAI and the neuropsychological tests will be discussed altogether.
Considering the comparison between both groups, repeated-measures ANOVA were made concerning a 2 (group: control vs. experimental) x 2 (time: pre-test vs. post-test) design. Considering STAI (see Table 2), there was a main effect of time, F (1, 24) = 9.59, p = .005, ŋ2
p =
.29, 1-β = .84, with participants feeling significantly less anxious on the post-test (M = 30.19, SD = 30.19) compared to the pre-test (M = 34.27, SD = 2.09).
Considering D2 (see Table 3), regarding the total efficiency score, there was a main effect of time, F (1, 24) = 106.59, p < .001, ŋ2
p = .82, 1-β = 1.00, with participants showing a
higher efficiency score after (M = 582.92, SD = 9.95) playing O.zen/watching the videos compared to before (M = 541.33, SD = 11.31). Concerning error core, there was also a main effect of time, F (1, 24) = 23.79, p < .001, ŋ2
p = .50, 1-β = .99. Participants committed
significantly less errors in the post-test (M = 11.92, SD = 1.70) than in the pre-test (M = 18.07,
SD = 2.01). There was also an interaction effect between time and group regarding error core, F (1, 24) = 4.14, p = .05, ŋ2
p = .15, 1-β = .50, with pairwise comparisons showing the same
tendency as the main effect of time. In percentage of errors, there was also a main effect of time, F (1, 24) = 37.56, p < .001, ŋ2
p = .61, 1-β = 1.00, with participants making less errors with
time (Mpre-test = 3.34, SDpre-test = .34, Mpost-test = 2.02, SDpost-test = .28). There was also an
interaction effect between group and time, F (1, 24) = 5.12, p = .03, ŋ2
p = .18, 1-β = .58, with
pairwise comparisons showing the same tendency as time main effect. Regarding the concentration efficiency score, there was a main effect of time, F (1, 24) = 120.71, p < .001, ŋ2
p
= .83, 1-β = 1.00, with participants showing a significantly higher concentration score with the passing of time (Mpre-test = 216.29, SDpre-test = 7.05, Mpost-test = 246.66, SDpost-test = 5.09). A main
effect of group also appeared, F (1, 24) = 8.59, p = .007, ŋ2
p = .26, 1-β = .80, with participants in
the experimental group showing a higher level of concentration (M = 246.71, SD = 7.62) than the control group (M = 216.29, SD = 7.05). Finally, concerning change amplitude, there was a group main effect, F (1, 24) = 6.32, p = .02, ŋ2
p = .21, 1-β = .68, with the control group showing
a higher change amplitude (M = 11.57, SD = .67) than the experimental group (M = 9.08, SD = .73). N = 26 STAI M (SD) C E Pre-test 33.79 (2.84) 34.75 (3.07) Post-test 30.71 (2.15) 29.67 (2.33)
Table 2. Mean and standard-deviation (in brackets) values of STAI scores, for both control (C) and
11 In regards to the covert shift of attention task (see Table 4), in the target validity factor, there was a time main effect, F (1, 24) = 7.56, p = .01, ŋ2
p = .24, 1-β = .75, with participants
showing a decrease of the factor with time (Mpre-test = 20.90, SDpre-test = 5.04, Mpost-test = 9.34,
SDpost-test = 2.88). There was also an interaction effect between group and time, F (1, 24) = 4.36,
p = .05, ŋ2
p = .15, 1-β = .52. Pairwise comparisons showed how the experimental’s group factor
decreases with time (p =.003; Mpre-test = 28.58, SDpre-test = 7.39, Mpost-test = 8.25, SDpost-test = 4.23).
N = 26 Covert Shift of Attention
M (SD) F (prime validity)
C E
Pre-test 13.21 (6.84) 28.58 (7.39)
Post-test 10.43 (3.91) 8.25 (4.23)
Table 4. Mean and standard deviation values (in brackets), considering covert shift of attention task, for
control (C) and experimental (E) groups, in relation to the prime validity factor.
Regarding the last neuropsychological test considered, the flexibility task (see Table 5), a main effect of time occurred, F (1, 24) = 24.49, p < .001, ŋ2
p = .51, 1-β = .99. Participants
showed a decrease of reaction time over time, hence a higher flexibility ability (Mpre-test =
644.45, SDpre-test = 34.78, Mpost-test = 547.32, SDpost-test = 22.58). There was also an interaction
effect between time and group, F (1, 24) = 4.34, p = .05, ŋ2
p = .16, 1-β = .52. Pairwise
comparisons showed the same tendency as time main effect.
N = 26 Flexibility Median (SD) Median C E Pre-test 712.14 (47.25) 576.75 (51.04) Post-test 574.14 (30.68) 520.50 (33.14)
Table 5. Considering the flexibility task, median and standard deviations values (in brackets), for both
control (C) and experimental (E) groups.
N = 26 D2 M (SD) GZ F %F KL SB C E C E C E C E C E Pre-test 516.57 (15.36) 566.08 (16.59) 18.71 (2.74) 17.42 (2.96) 3.62 (.47) 3.06 (.51) 203.00 (7.66) 229.67 (8.27) 11.64 (.80) 10.50 (.87) Post-test 551.00 (13.52) 614.83 (14.60) 10.00 (2.31) 13.83 (2.49) 1.81 (.37) 2.23 (.40) 229.57 (6.92) 263.75 (7.47) 11.50 (1.07) 7.67 (1.15)
Table 3. Mean and standard deviation values (in brackets, regarding D2, and its indexes, such as the total
efficiency score (GZ), error core (F – ignorance error or by skipping and comitting), percentage of errors (%F), concentration efficiency score (KL), and change amplitude (SB), for both control (C) and
12 After comparing both groups, further analysis were carried away considering each group separately. Therefore, paired-samples t-tests were used, in order to study participants’ performance before and after playing the product.
Regarding the experimental group (see Table 6), a paired-samples t-test was conducted to compare participants’ score in STAI before and after playing O.zen. There was a significant difference of the score before (M = 34.75, SD = 8.67) and after (M = 29.67, SD = 5.09) playing the program, t(11) = 2.33, p = .04,with participants showing a lower level of anxiousness after playing O.zen. Concerning D2, participants showed a significantly higher efficiency score after (M = 614.83, SD = 31.31) compared to before playing it (M = 566.08, SD = 33.19), t(11) = -9.24, p < .001. They also showed a significantly lower error core after playing the product (Mbefore = 566.08, SDbefore = 33.19, Mafter = 566.08, SDafter = 33.19), t(11) = 2.42, p =
.03. The experimental group revealed a significant difference in error percentage, t(11) = 3.67,
p = .004, with percentage of errors being higher before (M = 3.06, SD = 1.63) compared to after
(M = 2.23, SD = 1.55) playing O.zen. Concentration efficiency score also differed significantly,
t(11) = -12.00, p < .001. Concentration was significantly higher after (M = 263.75, SD = 18.00)
compared to before (M = 229.67, SD = 18.27) playing O.zen. Finally, change amplitude also differed significantly, t(11) = 2.46, p = .03, with participants showing a lower amplitude after playing O.zen (Mbefore = 10.50, SDbefore = 2.51, Mafter = 7.67, SDafter = 2.31). Regarding the covert
shift of attention task, participants showed a significant difference regarding the target validity
index, t(11) = 2.50, p = .03, being slower after playing the product (Mbefore = 28.58, SDbefore =
28.85, Mafter = 8.25, SDafter = 8.69). Considering the flexibility task, the experimental group was
significantly faster performing the task after (M = 520.50, SD = 89.58) compared to before (M = 576.75, SD = 133.78) playing the product, showing a higher flexibility ability, t(11) = 2.59, p = .03.
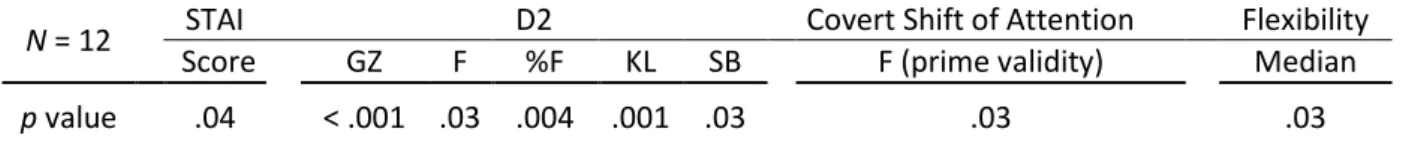
Table 6. P values of paired samples t-tests, regarding tests’ performance before and after playing O.zen.
Different indexes were used concerning D2: total efficiency score (GZ); error core (F); error percentage (%F); concentration efficiency score (KL); and change amplitude (SB). In the covert shift of attention task, F (prime validity) refers to the main validity effect, with an ideal performance at Pc50.
Considering the control group (see Table 7), STAI’s score was marginally significant,
t(13) = 1.96, p = .07. Participants tended to feel less anxious after (M = 30.71, SD = 9.90)
compared to before (M = 33.79, SD = 12.06) watching the videos. Regarding D2, participants showed a significantly higher efficiency score on the post-test (M = 551.00, SD = 62.39) compared to the pre-test (M = 516.57, SD = 71.88), t(13) = -5.81, p < .001. Error core was also significantly lower after compared to before watching the videos (Mbefore = 18.71, SDbefore =
10.77, Mafter = 10.00, SDafter = 7.43), t(13) = 4.45, p = .001. Percentage of errors was also
significantly lower after watching the videos (Mbefore = 3.62, SDbefore = 1.85, Mafter = 1.81, SDafter =
1.25), t(13) = 5.20, p < .001. The concentration efficiency score also differed significantly, t(13) = -5.92, p < .001, with participants showing a lower score on the pre-test (M = 203.00, SD = 35.10) than on the post-test (M = 229.57, SD = 31.03). Finally, the control group did not show any significant differences regarding change amplitude, t(13) = .10, p = .93. Concerning covert
N = 12 STAI D2 Covert Shift of Attention Flexibility Score GZ F %F KL SB F (prime validity) Median
13
shift of attention, there was no significance regarding target validity, t(13) = .79, p = .44. In the flexibility task, the control group was significantly more flexible performing their attentional
task after watching the videos (Mbefore = 712.14, SDbefore = 206.30, Mafter = 574.14, SDafter =
132.41), t(13) = 4.43, p = .001.
Discussion
The goal of this study was to test O.zen and see if it beneficiates people’s well-being. To do so, cortisol and skin conductance measurements, as well as neuropsychological tests were used.
Regarding cortisol measurements, all participants showed a decrease of cortisol level after playing O.zen (experimental group) and after watching the videos (control group). Such decrease of stress level may reflect the involvement of the hypothalamus-pituitary adrenal axis, and thus a better metabolic status. In terms of skin conductance measurements, the experimental group showed a drastic skin conductance level reduction by playing O.zen. However, when answering to the neuropsychological tests after having played the product, the experimental group’s skin conductance level arose quickly, reaching and overcoming the control group’s skin conductance level. Taking into account the obtained skin conductance data, after playing O.zen, participants seem to need less resources from the autonomous nervous system to perform the same tasks as participants who did not play O.zen. Also, one can see that whereas, in the end, the group using biofeedback recovers their electrodermal activity level, the control group’s electrodermal activity level keeps a more or less constant pattern.
In STAI questionnaire, while the experimental group showed a significant decrease in anxiety level after playing the product, the control group only showed a marginal pattern. Considering D2, all participants processed more stimuli (GZ index), made less mistakes (F and %F indexes), and showed a higher concentration level in the post-test (KL index). However, considering the difference of minimum and maximum performance, only the experimental group showed a decrease in the post-test (SB), being more constant in their performance. Concerning the covert shift of attention task, the experimental group was particularly slow in shifting their attention in the post-test. Finally, regarding the flexibility task, all participants were faster to perform the task in the post-test, showing a higher flexibility ability. Finally,
In this study, a first analysis comparing both experimental and control groups was made, as the main goal was to test the efficacy of O.zen. We were expecting to observe a an overall better performance in the post-test from the experimental group compared to the
N = 14 STAI D2 Covert Shift of Attention Flexibility
Score GZ F %F KL SB F (prime validity) Median
p value .07 < .001 .001 < .001 < .001 n.s. n.s. .001
Table 7. P values of paired samples t-tests, regarding tests’ performance for the control group. D2 indexes used were:
total efficiency score (GZ); error core (F); error percentage (%F); concentration efficiency score (KL); and change amplitude (SB). In the covert shift of attention task, F (prime validity) refers to the main validity effect, with an ideal performance at Pc50.
14 control group, as the last one did not play O.zen, nor were instructed to perform any relaxation task. Hence, the first analysis came to a surprise as the control group also showed some improvements. The more explicit difference between groups was regarding skin conductance patterns throughout the experiment. Therefore, we decided to carry out independent analysis for both groups. Even though we can still see changes in the control group regarding pre-test and post-test, different results between both groups are better perceived. For instance, the experimental group clearly felt less anxious after playing O.zen (STAI scores).
In order to better understand these results, one needs to think about the control group’s experiment, especially the task they performed to substitute playing O.zen. Our goal was to show the efficacy of O.zen, but we focused on its biofeedback quality. Hence, we wanted a task for the control group that resembled the product the most. Therefore, our decision was to show videos to the control group corresponding to the actual games from O.zen being played by the experimental group. This meant showing participants from the control group the same visuals and the same music as in O.zen, but asking them how many times some circles passed in front of a determined target, for instance.
As presented in the introduction, sensory modalities are also taken into consideration when trying to develop techniques to avoid or reduce stress and anxiety levels from our organism, especially the auditory modality. Also, O.zen took into deep consideration all its visuals and music, in order to make it a full relaxing and yet fun experience. Therefore, and as the task demanded to the control group was also very monotonous (to count the number of times some circles passed a certain target), we think it is highly probable that the visuals and music of O.zen are enough to already relax people, even when they are not playing the actual product. One thing that helps to prove this possibility is the performance of each group in the covert shift of attention task. In here, participants of the experimental group actually showed a significantly slower ability for shifting attention, which translates into a more relaxed state.
One thing that could be done in the future is to add a third group, in which they are not shown the music. Or find another overall task for the control group. It would also be interesting to use more neuropsychological tests, which was not possible in our case due to time constraints. So even though it seems as both groups beneficiated from the visuals and music of O.zen, it is clear that actually playing the product has its benefits, with participants feeling less anxious and saving some activation from the autonomic nervous system in order to perform the same tasks as the control group.
Acknowledgments
This study received support from the National Research Agency (ANR), within the programme “Investissement d’Avenir” bearing the reference ANR-11-EQPX-0023 and of the European fund FEDER.
15
Bibliography
Andrade, P. E., & Bhattacharya, J. (2003). Brain tuned to music. Journal of the Royal Society of
Medicine, 96(6), 284–287.
Andrews, J., Ali, N., & Pruessner, J. C. (2013). Reflections on the interaction of psychogenic stress systems in humans: The stress coherence/compensation model. Psychoneuroendocrinology,
38(7), 947–961. doi:10.1016/j.psyneuen.2013.02.010
Bach, D. R., Friston, K. J., & Dolan, R. J. (2010). Analytic measures for quantification of arousal from spontaneous skin conductance fluctuations. International Journal of Psychophysiology, 76(1), 52–55. doi:10.1016/j.ijpsycho.2010.01.011
Ben-Tal, A., Shamailov, S. S., & Paton, J. F. R. (2012). Evaluating the physiological significance of respiratory sinus arrhythmia: looking beyond ventilation–perfusion efficiency. The Journal of
Physiology, 590(8), 1989–2008. doi:10.1113/jphysiol.2011.222422
Boot, W. R., Kramer, A. F., Simons, D. J., Fabiani, M., & Gratton, G. (2008). The effects of video game playing on attention, memory, and executive control. Acta Psychologica, 129(3), 387–398. doi:10.1016/j.actpsy.2008.09.005
Bourne, L. E., & Yaroush, R. A. (2003). Stress and Cognition: A Cognitive Psychological Perspective. Retrieved from http://ntrs.nasa.gov/search.jsp?R=20040034070
Bradley, R. T., McCraty, R., Atkinson, M., Tomasino, D., Daugherty, A., & Arguelles, L. (2010). Emotion Self-Regulation, Psychophysiological Coherence, and Test Anxiety: Results from an Experiment Using Electrophysiological Measures. Applied Psychophysiology and Biofeedback, 35(4), 261– 283. doi:10.1007/s10484-010-9134-x
Brickenkamp, R. (1981). Test d2 Aufmerksamkeits-Belastungs-Test. Göttingen (Germany): Hogrefe. Chandler, C., Bodenhamer-Davis, E., Holden, J. M., Evenson, T., & Bratton, S. (2001). Enhancing
Personal Wellness in Counselor Trainees Using Biofeedback: An Exploratory Study. Applied
Psychophysiology and Biofeedback, 26(1), 1–7. doi:10.1023/A:1009548719340
Cutshall, S. M., Wentworth, L. J., Wahner-Roedler, D. L., Vincent, A., Schmidt, J. E., Loehrer, L. L., … Bauer, B. A. (2011). Evaluation of a Biofeedback-Assisted Meditation Program as a Stress Management Tool for Hospital Nurses: A Pilot Study. EXPLORE: The Journal of Science and
Healing, 7(2), 110–112. doi:10.1016/j.explore.2010.12.004
Damasio, A. R. (1995). L’Erreur de Descartes : la raison des émotions. Paris: Editions Odile Jacob. Dawson, M. E., Schell, A. M., & Filion, D. L. (2007). The electrodermal system. In J. T. Cacioppo, L. G.
Tassinary, & G. G. Berntson (Eds.), Handbook of psychophysiology (3rd ed.) (pp. 159–181). New York, NY, US: Cambridge University Press.
Edwards, S. D. (2014). Evaluation of a heartmath workshop for physiological and psychological variables. Retrieved from
http://reference.sabinet.co.za/sa_epublication_article/ajpherd_v20_n1_a21
Elliot, A. J., Payen, V., Brisswalter, J., Cury, F., & Thayer, J. F. (2011). A subtle threat cue, heart rate variability, and cognitive performance. Psychophysiology, 48(10), 1340–1345.
16 Henriques, G., Keffer, S., Abrahamson, C., & Horst, S. J. (2011). Exploring the Effectiveness of a
Computer-Based Heart Rate Variability Biofeedback Program in Reducing Anxiety in College Students. Applied Psychophysiology and Biofeedback, 36(2), 101–112. doi:10.1007/s10484-011-9151-4
Jung, K. W., Yang, D.-H., & Myung, S.-J. (2012). Biofeedback Therapy. In V. S. Ramachandran (Ed.),
Encyclopedia of Human Behavior (Second Edition) (pp. 344–347). San Diego: Academic Press.
Retrieved from http://www.sciencedirect.com/science/article/pii/B9780123750006000628 Lazarus, R. S. (2000). Toward better research on stress and coping. American Psychologist, 55(6), 665–
673. doi:10.1037/0003-066X.55.6.665
Lehrner, J., Eckersberger, C., Walla, P., Pötsch, G., & Deecke, L. (2000). Ambient odor of orange in a dental office reduces anxiety and improves mood in female patients. Physiology & Behavior,
71(1–2), 83–86. doi:10.1016/S0031-9384(00)00308-5
Luft, C. D. B., Takase, E., & Darby, D. (2009). Heart rate variability and cognitive function: Effects of physical effort. Biological Psychology, 82(2), 186–191. doi:10.1016/j.biopsycho.2009.07.007 Malik, M., Bigger, J. T., Camm, A. J., Kleiger, R. E., Malliani, A., Moss, A. J., & Schwartz, P. J. (1996).
Heart rate variability. European Heart Journal, 17(3), 354–381.
McCraty, R. (2005). Enhancing Emotional, Social, and Academic Learning With Heart Rhythm Coherence Feedback. Biofeedback, 33(4), 130–134.
Moshagen, M., Musch, J., & Göritz, A. S. (2009). A blessing, not a curse: Experimental evidence for beneficial effects of visual aesthetics on performance. Ergonomics, 52(10), 1311–1320. doi:10.1080/00140130903061717
Norman, D. A. (2004). Emotional design. New York: Basic Books.
Pelletier, C. L. (2004). The Effect of Music on Decreasing Arousal Due to Stress: A Meta-Analysis.
Journal of Music Therapy, 41(3), 192–214. doi:10.1093/jmt/41.3.192
Picard, R. W. (2011). Measuring Affect in the Wild. In S. D’Mello, A. Graesser, B. Schuller, & J.-C. Martin (Eds.), Affective Computing and Intelligent Interaction (pp. 3–3). Springer Berlin Heidelberg. Retrieved from http://link.springer.com/chapter/10.1007/978-3-642-24600-5_3
Pottier, P., Hardouin, J.-B., Dejoie, T., Bonnaud, A., Le Loupp, A.-G., Planchon, B., & LeBlanc, V. (2011). Stress responses in medical students in ambulatory and in-hospital patient consultations.
Medical Education, 45(7), 678–687. doi:10.1111/j.1365-2923.2011.03935.x
Sander, D., & Scherer, K. (2009). Oxford Companion to Emotion and the Affective Sciences (OUP Catalogue). Oxford University Press. Retrieved from
http://econpapers.repec.org/bookchap/oxpobooks/9780198569633.htm
Sokhadze, E. M. (2007). Effects of Music on the Recovery of Autonomic and Electrocortical Activity After Stress Induced by Aversive Visual Stimuli. Applied Psychophysiology and Biofeedback,
32(1), 31–50. doi:10.1007/s10484-007-9033-y
Spielberger, C. D., Gorsuch, G. M., Lushene, R. E., Vagg, P. R., & Jacobs, G. A. (1983). Manual for the
17 Sutoo, D., & Akiyama, K. (2004). Music improves dopaminergic neurotransmission: demonstration
based on the effect of music on blood pressure regulation. Brain Research, 1016(2), 255–262. doi:10.1016/j.brainres.2004.05.018
Thorgaard, B., Henriksen, B. B., Pedersbæk, G., & Thomsen, I. (2004). Specially Selected Music in the Cardiac Laboratory—an Important Tool for Improvement of the Wellbeing of Patients.
European Journal of Cardiovascular Nursing, 3(1), 21–26. doi:10.1016/j.ejcnurse.2003.10.001
Vitasari, P., Wahab, M. N. A., Herawan, T., & Sinnadurai, S. K. (2011). Psychophysiological treatment in reduced anxiety with biofeedback training for university students. Procedia - Social and
Behavioral Sciences, 30, 629–633. doi:10.1016/j.sbspro.2011.10.122
Webb, H. E., Fabianke-Kadue, E. C., Kraemer, R. R., Kamimori, G. H., Castracane, V. D., & Acevedo, E. O. (2011). Stress Reactivity to Repeated Low-Level Challenges: A Pilot Study. Applied
Psychophysiology and Biofeedback, 36(4), 243–250. doi:10.1007/s10484-011-9164-z
Wolinsky, F. D., Unverzagt, F. W., Smith, D. M., Jones, R., Wright, E., & Tennstedt, S. L. (2006). The Effects of the ACTIVE Cognitive Training Trial on Clinically Relevant Declines in Health-Related Quality of Life. The Journals of Gerontology Series B: Psychological Sciences and Social Sciences,
61(5), S281–S287.
Zimmermann, P., & Fimm, B. (1997). Test for Attentional Performance (TAP). Herzogenrath: Psytest. Zimmermann, P., & Fimm, B. (2010). Test d’Évaluation de l’Attention, Version 2.3. Herzogenrath: Vera
xviii
Annex 1
Questionnaire
Est-ce que vous jouez jeux vidéo d’habitude ? Oui Non Si oui, quel type de jeux vidéo vous jouez plus souvent?
Action Puzzle Sport
Autre(s) _____________________________________
Si oui, combien d’heures par jour normalement ? < 30min
30min - 1h 1h - 2h 3h / +
xix
Annex 2
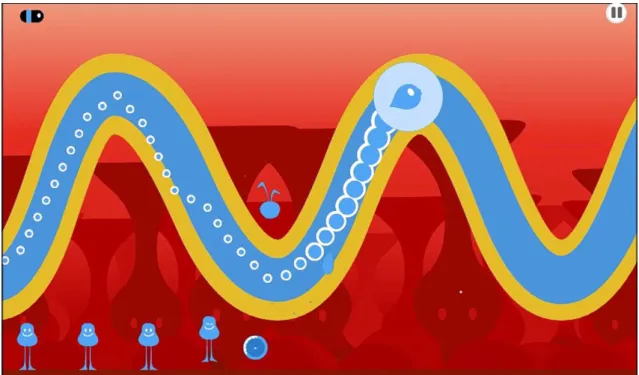
Figure 2. Example of O.zen visuals. Participants’ task was to control their breathing in order to correctly
follow the air bubble. Feedback was given through the smaller bubbles, whilst participants had to try and keep them inside the blue line.
Figure 3. Example of the visuals showed to the control group. Participants were asked to count the