HAL Id: hal-01923807
https://hal.archives-ouvertes.fr/hal-01923807
Submitted on 15 Nov 2018
HAL is a multi-disciplinary open access
archive for the deposit and dissemination of
sci-entific research documents, whether they are
pub-lished or not. The documents may come from
teaching and research institutions in France or
abroad, or from public or private research centers.
L’archive ouverte pluridisciplinaire HAL, est
destinée au dépôt et à la diffusion de documents
scientifiques de niveau recherche, publiés ou non,
émanant des établissements d’enseignement et de
recherche français ou étrangers, des laboratoires
publics ou privés.
Time-resolved protein side-chain motions unraveled by
high-resolution relaxometry and molecular dynamics
simulations
Samuel Cousin, Pavel Kadeřávek, Nicolas Bolik-coulon, Yina Gu, Cyril
Charlier, Ludovic Carlier, Lei Bruschweiler-Li, Thorsten Marquardsen,
Jean-Max Tyburn, Rafael Brüschweiler, et al.
To cite this version:
Samuel Cousin, Pavel Kadeřávek, Nicolas Bolik-coulon, Yina Gu, Cyril Charlier, et al..
Time-resolved protein side-chain motions unraveled by high-resolution relaxometry and molecular
dy-namics simulations. Journal of the American Chemical Society, American Chemical Society, 2019,
�10.1021/jacs.8b09107�. �hal-01923807�
Time-resolved protein side-chain motions unraveled by
high-resolution relaxometry and molecular dynamics simulations
Samuel F. Cousin,
a,‡,†Pavel Kadeřávek,
a,§,†Nicolas Bolik-Coulon,
a,†Yina Gu,
bCyril Charlier,
a,#Ludovic Carlier,
aLei Bruschweiler-Li,
cThorsten Marquardsen,
eJean-Max Tyburn,
fRafael
Brüschweiler,
b,c,d,* Fabien Ferrage
a,*
aLaboratoire des biomolécules, LBM, Département de chimie, École normale supérieure, PSL University, Sorbonne
Univer-sité, CNRS, 75005 Paris, France.
bDepartment of Chemistry and Biochemistry, The Ohio State University, Columbus, Ohio 43210, U.S.A. cCampus Chemical Instrument Center, The Ohio State University, Columbus, Ohio 43210, U.S.A. d
Department of Biological Chemistry and Pharmacology, The Ohio State University, Columbus, Ohio 43210, United States
eBruker BioSpin GmbH, Silberstreifen 4, 76287 Rheinstetten, Germany.
fBruker BioSpin, 34 rue de l’Industrie BP 10002, 67166 Wissembourg Cedex, France.
ABSTRACT: Motions of proteins are essential for the performance of their functions. Aliphatic protein side chains and their
mo-tions play critical roles in protein interacmo-tions: for recognition and binding of partner molecules at the surface or serving as an en-tropy reservoir within the hydrophobic core. Here, we present a new NMR method based on resolution relaxometry and high-field relaxation to determine quantitatively both motional amplitudes and timescales of methyl-bearing side chains in the picose-cond-to-nanosecond range. We detect a wide variety of motions in isoleucine side chains in the protein ubiquitin. We unambiguous-ly identify slow motions in the low nanosecond range, which, in conjunction with molecular dynamics computer simulations, could be assigned to transitions between rotamers. Our approach provides unmatched detailed insight into the motions of aliphatic side chains in proteins and provides a better understanding of the nature and functional role of protein side-chain motions.
INTRODUCTION
Well-folded proteins are described by structural models of high precision obtained by X-ray crystallography, NMR, and cryo-electron microscopy. Yet, at ambient conditions exten-sive internal motions occur throughout all proteins, on time-scales ranging from the picosecond to seconds and beyond.1 Such motions include local librations in the picosecond range, slower rotameric jumps of protein side chains, diffusive mo-tions of loops or entire domains, as well as conformational transitions that involve significant energy barriers and take place on slower timescales of microseconds to seconds. The motions of protein side chains are essential to protein function. For example, the malleability of side chains at the surface of proteins enables them to engage in specific interactions with multiple targets, while the hydrophobic side chains in the core of a protein constitute a fluid-like entropy reservoir,2,3 which decisively contributes to its thermodynamic properties.4
Over the past few decades, site-specific motions of protein side chains have been extensively probed by NMR,5,6 in par-ticular through NMR relaxation studies.7 Motions of hydro-philic side chains have been investigated with nitrogen-158-11 and carbon-13 relaxation.12-14 Aromatic side-chain dynamics have been investigated by carbon-13 NMR.15,16 Yet, most studies of protein side-chain motions focused on aliphatic side chains17 and have used methyl groups as probes. Early studies relied on carbon-13 relaxation.18,19 Subsequently, deuterium relaxation experiments were introduced,20 expanded21,22 and
exploited successfully in a host of studies.4,23-28 Investigations of methyl-group motions have fostered a deeper understanding of their contributions to the entropy of protein interactions.29-32 Molecular dynamics (MD) computer simulations using recent force fields have been shown to often reproduce NMR relaxa-tion derived side-chain order parameters semi-quantitatively.27,33,34 MD simulations have also allowed to ascertain contributions of conformational heterogeneity of side chains to the entropy of proteins.2,10,35
In spite of such spectroscopic innovations and conceptual breakthroughs, decades of investigations20,25,27 have consistent-ly produced limited sampling of the spectral density function, unable to probe the limitations of the simple models of mo-tions employed for quantitative analyses. The quality of the models is critical for quantitative mechanistic interpretations, which rely on the accuracy of fitted parameters: order parame-ters are used to estimate changes in conformational entropy30,31,36 while correlation times for methyl motions have been linked to the local structure.25 The simplicity of the mo-tional models is primarily a consequence of the nature and scarcity of experimental data. Indeed, deuterium relaxation rates measured at high magnetic fields only sample the density of motions at a handful of frequencies. A better method is needed to quantify the motions of methyl-bearing side chains to properly understand the role of hydrophobic cores and surfaces in the function of proteins.
Here, we introduce a novel approach, based on site-specific measurements of carbon-13 relaxation rates in methyl groups
extending over two orders of magnitude of magnetic fields, which allows us to probe motions of methyl groups over a broad range of frequencies. High-frequency motions are sam-pled by nuclear Overhauser effects (NOEs) of carbon-13 nu-clei caused by directly attached protons. On the other end of the scale, slower motions are probed by relaxation measure-ments at magnetic fields as low as 0.33 T combined with high-resolution observation at high field (see Figure 1).37-39 This set of carbon-13 relaxation rates measured between 0.33 and 22.3 T (corresponding to proton resonance frequencies between 14 and 950 MHz) were analyzed with motional models that ex-plicitly account for the rotation of the methyl group.
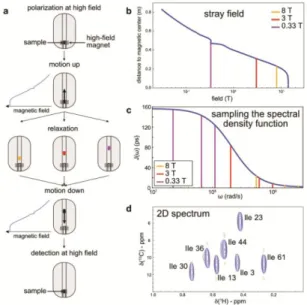
Figure 1. Principle of high-resolution relaxometry. (a) Course of
a typical high-resolution relaxometry experiment: after polariza-tion at high field, the sample is transferred to a specific posipolariza-tion in the stray field for the relaxation delay (note the plateau in the stray field at 0.33 T obtained by ferroshims40,41) and transferred back to the high-field magnetic center for detection. We represent three experiments recorded at different magnetic fields color-coded in purple, red and orange. (b) The three representative magnetic fields along the stray field profile. (c) Frequencies at which the spectral density is probed by measurements at these three fields. (d) Typical 2D [13C,1H] correlation spectrum of ubiquitin with specific 13C1H2H21 labeling of methyl groups in isoleucine residues recorded at high field after the shortest relaxa-tion delay at 0.65 T.
This method is illustrated for the protein ubiquitin, which was fully deuterated except for isolated protons in specifically doubly deuterated 13C1H2H2-labeled isoleucine 1 methyl
groups. Different motions with correlation times spanning three orders of magnitude were characterized, even when chemical exchange contributions to transverse relaxation would preclude an analysis based on high-field measurements alone. Our results offer additional insights with respect to previous studies of side-chain motions in ubiquitin. Motional properties thus identified by NMR were interpreted with a 1 s MD simulation of ubiquitin. Simulations and experiments are in good agreement for a majority of sites, allowing a mecha-nistic interpretation of the motions identified by NMR. Our work opens an unprecedented window on site-specific motions of aliphatic side chains in proteins. We expect this methodolo-gy to improve our mechanistic understanding of transitions between side chain conformers, the molecular origin of protein
entropy and generate experimental data sets to benchmark molecular dynamics force fields and simulation protocols.
THEORY
The 13C1H2H2 isotopomer of a methyl group has previously
been used to extract reliable carbon-13 relaxation rates.42,43 This spin system includes two spin 1/2 (1H, 13C) and two spin 1 nuclei (2H). Here, we have considered relaxation due to the fluctuations of six dipole-dipole interactions, the two quadrupolar coupling interactions of the deuterium nuclei, and the chemical shift anisotropy (CSA) of the carbon-13 nucleus. The transverse (R2) and longitudinal (R1) relaxation rates for
the carbon-13 nucleus are:
(1) (2) where and ; is the permittivity of free space;
is Planck’s constant divided by 2; are the
gyromag-netic ratios of carbon-13, proton, and deuteron, respectively;
rCD ≅ rCH = 111.5 pm is the 13-deuteron and
carbon-13-proton internuclear distance; C is the chemical shift
anisotropy of the carbon-13 nucleus and the Larmor frequen-cies are: for carbon-13, proton, and
deu-teron, respectively, with B0 the magnetic field. The spectral
density functions correspond to the autocorrelation of the methyl symmetry axis, JCC(), the autocorrelation of the
me-thyl CH bond vector, JCH(), and the autocorrelation of the
methyl CD bond vector, JCD(), where the equality JCH() = JCD() is assumed to hold in good approximation.
The dipolar cross-relaxation rate between the carbon-13 nu-cleus and the proton is:
(3) The geometry of the methyl group is shown in Figure S1. The motions of the CH bond are decomposed into three statis-tically independent motions,44 so that the correlation function
may be written as the product of three correlation
(4) is the correlation function for the fast rotation of
the methyl group about its symmetry axis, the subscript i de-fines the orientation of the principal axis of the interaction under consideration, here ;
describes the orientational motions of the “symmetry” axis of the methyl group aligned with the CC bond; and is the correlation function for the global motion due to rotational diffusion of the entire protein or domain. We account for the fast rotation of the methyl group about its symmetry axis using the simple model-free correlation function :27
(5)
This rotation is axially symmetric, but not isotropic, and the order parameter depends on the angle i between the principal
axis of the interaction and the methyl symmetry axis. At equi-librium, all orientations of the methyl group are equally prob-able, which leads to an order parameter
. For the CH dipole-dipole
cou-pling, with an ideal tetrahedral geometry, CH = 109.47º, and
hence . We consider that the carbon-13
chemi-cal shift anisotropy tensor is axially symmetric, with a princi-pal axis aligned with the CC bond, and . Motions
of the CC axis are accounted for by the “extended model free” approach, 44-46 with a correlation function :
(6) Motions in two different windows of correlation times are accounted for in : faster (resp. slower) motions are
represented by the order parameter (resp. ) and the corre-lation time (resp. ). Here, the overall rotational diffusion of the protein is described by an isotropic diffusion tensor defined by a single correlation time c with an associated
cor-relation function . The Fourier
transform of the product of the correlation functions describ-ing isotropic overall isotropic rotational diffusion, motions of the CC vector, and methyl group rotation, provides the spec-tral density function:
(7a) with the Lorentzian functions defined as:
(7b) where and
.
For high-resolution relaxometry measurements, the sample shuttle is moved away from the magnetic center to a chosen position of the stray field of the high-field magnet. After the
relaxation delay, the sample is transferred back to the high-field magnetic center. When the sample shuttle is not in the magnetic center, no radiofrequency pulse can be applied to control cross-relaxation pathways. Thus, measured decays deviate systematically from ideal mono-exponential behavior with a relaxation decay rate R1. We have previously designed a
protocol to obtain R1 from the measured decay rate R1 app
.38,47 This procedure requires that the proper relaxation matrix is taken into account at every step of the shuttle transfers (which covers up to two orders of magnitude of magnetic fields) and during the relaxation delay. Here, we have used the following relaxation matrix in the minimal subspace spanned by the three basis operators :
(8) where, is the longitudinal proton relaxation rate of the proton; RCH is the auto-relaxation rate of the two-spin order
; is the relaxation rate due to the cross-correlation of the carbon-13 CSA and the dipolar interaction with the proton (see Supporting Information).
RESULTS AND DISCUSSION
Site-specific nuclear magnetic relaxation dispersion (NMRD) profiles were obtained for the longitudinal relaxation of the carbon-13 nuclei of all seven isoleucine 1 methyl groups over a broad range of magnetic field strengths, from 0.32 T to 22.3 T (Figure 2). The spectral density function for the dominant dipolar CH interaction is probed over more than two orders of magnitude of frequencies between
C(0.33 T)/2= 3.4 MHz and [C + H](22.3 T)/2 =
1.19 GHz. Relaxation rates at high fields provide complemen-tary information on the spectral density function. In particular, dipolar cross-relaxation rates probe predominantly the spectral density function at the highest accessible frequencies (Figure S3). Transverse relaxation rates (Figure S3) allow one to de-termine the spectral density at zero frequency.
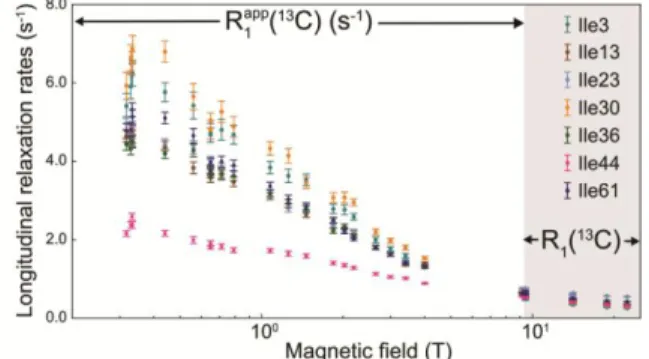
Figure 2. Site-specific longitudinal nuclear magnetic relaxation
dispersion profiles of the seven isoleucine 1 carbon-13 nuclei in human ubiquitin. Longitudinal relaxation rates C were measured with high-resolution relaxometry in fields in the range 0.33 T < B0 < 9.4 T. The apparent rates
C are those of the experimental decay, see text for the determination of the true
R1(13C) rates. The longitudinal relaxation rates R1(13C), in the grey panel to the right, were also measured with conventional spec-trometers operating at 9.4; 14.1; 18.8 and 22.3 T.
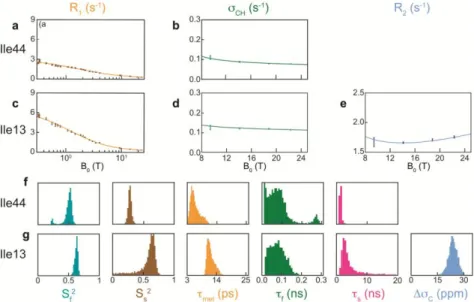
Figure 3. Analysis of field-dependent relaxation rates for residues Ile13 and Ile44 in ubiquitin. (a) Longitudinal relaxation rates R1(13C) and (b) dipolar cross-relaxation rates CH of isoleucine 44. (c) Longitudinal relaxation rates R1(
13
C), (d) dipolar cross-relaxation rate CH, and (e) transverse relaxation rates R2(13C) of isoleucine 13. (f,g) Distributions of fitted order parameters, correlation times and CSA C for (f) isoleucine 44 and (g) isoleucine 13.
NMRD profiles highlight the remarkable diversity of the dynamic properties of isoleucine side chains in ubiquitin. For instance, low relaxation rates at low field for the 1 carbon-13 of Ile44 (13C(Ile44-1)) indicate that this surface-exposed side chain is mobile on ps-ns timescales, in agreement with previ-ous studies.48-50 By contrast, high relaxation rates obtained for
13
C(Ile30-1) give a clear indication that ps-to-ns motions of this side chain located in the hydrophobic core are restricted. A more detailed description of motions of these seven side chains requires a thorough quantitative analysis of relaxation rates.
Experimental decays measured by our high-resolution relaxometry method are dominated by longitudinal auto-relaxation rates but also feature complications due to cross-relaxation. Indeed, no radio-frequency pulse can be applied when the sample is outside of the high-field probe, so that cross-relaxation pathways cannot be suppressed neither during the transfers between high and low magnetic fields, nor during the relaxation delay T in low field. In a previous study,48 we introduced a protocol of iterative correction for the analysis of relaxation under shuttling (ICARUS). The central feature of ICARUS is the simulation of the entire experimental sequence that takes place outside of the homogeneous high-field mag-netic center for each spin system under investigation. Relative deviations of simulated relaxation decay rates from longitudi-nal relaxation rates are then used to derive accurate estimates of longitudinal relaxation rates from experimental rates at each magnetic field.
We have rewritten the entire ICARUS software for the analysis of relaxometry data in Python for public use51 and we have developed a relaxation framework adapted for 13C1H2H2
methyl groups. A flowchart of ICARUS is provided in the Supporting Information. A full description of the approach and its validation with measurements on a two-field NMR spec-trometer40,41 will be published elsewhere. The investigation of relaxation pathways over a broad range of magnetic fields shows that the two main cross-relaxation pathways are (i) cross-relaxation due to the cross-correlation of the carbon-13
CSA and its dipolar interaction with the methyl proton at high and moderate fields (B0 > 4 T) and (ii) dipolar
13
C-1H cross-relaxation at low fields (B0 < 2 T). Thus, relaxation during the
part of the experiment outside of the high-field magnetic cen-ter can be described with good accuracy in the subspace spanned by the three operators (see Eq. 8). Under our sample shuttling conditions, deviations between apparent relaxometry rates and longitudinal relaxation rates were found to be highly field-dependent for each residue, with the smallest corrections of 1.5% - 7.5% at fields around 3 T for most residues and up to 22.5% at the lowest fields for some residues. These corrections of apparent relaxation rates are therefore essential for a rigorous quantitative analysis of high-resolution relaxometry rates (see below).
The ICARUS analysis of our entire ensemble comprising over 30 relaxation rates measured at 21 magnetic fields was carried out to determine up to three internal correlation times to describe the motions of isoleucine 1 methyl groups in ubiquitin. The parameters for the motional model introduced in Equations 4-7 were determined following a Markov Chain Monte Carlo (MCMC) approach.52 The fit of experimental data is excellent (Figures 3a-e and S4 and Table S5). The distributions of parameters demonstrate that all three correla-tion times can be determined for several residues (Figure 3f-g and S5). The correlation times met for the rotation of methyl
groups about their three-fold axes are found to cover a rather narrow range between 5.5 and 22 ps, which corresponds to rotation barriers of 2 to 3 kBT (a simple model for this
obser-vation is discussed in Supporting Information). Variations of
met are correlated with local structure: the shortest value met =
5.5 ps is found for isoleucine 44, which constitutes the only isoleucine side chain at the surface of the protein. The largest value met = 22 ps is found for isoleucine 23 whose rotation
may be slowed down by the close-by H of Ile23.53 These correlation times for methyl rotation are somewhat shorter than those found for methyl groups of the SH3 domain of -spectrin,
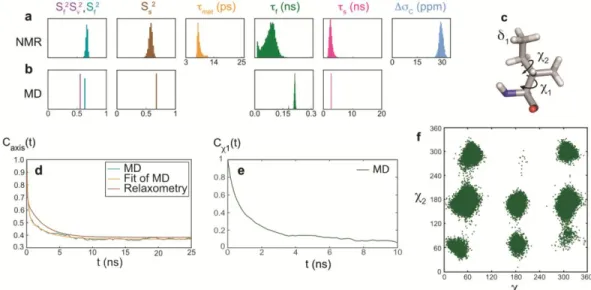
Figure 4. Motions of the 1 methyl group of isoleucine 36 in ubiquitin determined by combining high-resolution relaxometry and molecu-lar dynamics simulations. (a) Probability distributions of order parameters, correlation times and CSA C from the analysis of relaxation rates. (b) Probability distributions of order parameters and correlation times from the analysis of the correlation function Caxis(t) obtained from MD simulations. (c) Representation of an isoleucine side chain. (d) Correlation function from MD simulations and Caxis(t) from the analysis of relaxation. (e) Autocorrelation functions for the side-chain dihedral angle 1 of isoleucine 36. (f) Side-chain Ramachandran plot from the MD trajectory.
which were derived from more limited sampling of the spectral density function based on deuterium relaxation meas-urements interpreted with a simpler model.25 The correlation times of methyl-group rotation found here fall into the typical range (from the low picosecond to low nanoseconds) for ami-no acids derived from solid-state NMR relaxation measure-ments.54
Motions of the methyl group axis, which include librations of the CC bond as well as rotameric jumps of the side chain, can be described with two order parameters. The fast compo-nent of the motions is found in the range between a few tens of ps and a few hundreds of ps. Importantly, slower motions, in the low ns range are unambiguously defined for three out of seven isoleucine side chains. The slow correlation time of the motions of the methyl axis in the solvent-exposed side chain of Ile44 is about 1.3 ns. The longer correlation times for the motions of the side chains of Ile13 and Ile36 are very close, 3.1 ns and 2.5 ns, respectively. Interestingly, these two side chains are spatially close with an average distance between the two 1 carbons of 5.9 Å according to a refined NMR structure (PDB code 2MJB)53 (see below).
Similar results are obtained when high-field relaxation rates are complemented with only relaxation rates at five well-chosen low fields spanning the range 0.33 T – 4 T (Table S11). The correction of apparent low-field relaxation rates is necessary to obtain accurate parameters of the model. In the absence of correction (Figure S6, Table S6) the spectral densi-ty function at low frequency is underestimated. This leads to systematically underestimated order parameters, and conse-quently overestimated CSA values, in order to reproduce transverse relaxation rates at low field. Importantly, correla-tion times for methyl rotacorrela-tion, which are reflected in the spec-tral density at the highest frequencies are not altered by the absence of correction.
High-resolution relaxometry gives access to parameters re-porting about ps-ns motions even in the presence of chemical exchange contributions to line broadening. Chemical exchange contributions to transverse relaxation often hamper the
unam-biguous interpretation of the spectral density function at zero frequency. This causes limitations of the analysis in terms of motional models in the ps-ns range.55,56 For example, if the contribution of fast chemical exchange to transverse relaxation is treated as an additional fitted parameter, statistical tests tend to favor simpler ps-ns motional models57 and thereby adverse-ly affect the accuracy of the resulting dynamics parameters.58 Our analysis of the ensemble of relaxation rates of Ile44 clear-ly identifies a small contribution of chemical exchange to the transverse relaxation rates of the 1 carbon-13 (Fig S6), in agreement with previous studies at lower temperature, where this contribution is larger.59 Note that, at 9.4 T, this contribu-tion is only 0.1 s-1, which would go unnoticed by most (if not all) methods based on the measurement and analysis of trans-verse relaxation rates. Our analysis shows that longitudinal relaxation rates in the range 0.33 < B0 < 22.3 T combined with
dipolar cross-relaxation rates at high field, 9.4 < B0 < 22.3 T,
are sufficient to describe motions in the low picosecond to low nanosecond range. Up to three dominant correlation times along with their probability distributions could be identified for Ile44 by the MCMC procedure (Figure 3f). The only pa-rameter that cannot be properly fitted is the chemical shift anisotropy so that this parameter was fixed to C = 25 ppm
(see flowchart in Supporting Information). The set of relaxa-tion rates employed here allowed us to unambiguously identify motions with a correlation time s = 1.3 ns for the side chain of
Ile44 despite the presence of chemical exchange.
In order to obtain additional insights into the dynamical modes in the context of local protein structure, all-atom mo-lecular dynamics computer simulations can be performed. Since these simulations now routinely extend into the hun-dreds of nanoseconds to microsecond range, all of the relevant timescales monitored by our relaxometry experiments should be covered allowing an increasingly quantitative comparison between simulation and experiment. We performed a 1 s trajectory of ubiquitin in explicit solvent (TIP3P) using the ff99SBnmr1-ILDN force field60 (see Methods Section). For
isoleucine 36, the simulated auto-correlation function
for the methyl axis, defined by the C1C1 vector, compares well with the relaxometry-derived correlation function and the parameters of the function were fitted to (Figure 4d). Note that an additional order parameter
was introduced to account for sub-picosecond motions (vibrations and librations), which are significant in the MD simulations. Relaxometry- and MD-derived microdynamics parameters agree well (Figure 4a,b) suggesting that the MD trajectory allows a quantitative interpretation of the molecular details of Ile36 side chain motions, thereby further enhancing the information gained from experiments alone. A broad sam-pling of the conformational space is found for Ile36 as 7 out of 9 possible rotameric states (3 potential energy minima for 1
and 3 for 2) are populated over the course of the simulated
trajectory (Figure 4f). Interestingly, the auto-correlation func-tion for the dihedral angle 2 decays significantly faster than
the autocorrelation function for 1. Rotameric jumps for the 2
dihedral angle contribute mostly to the fast-decaying compo-nent in Caxis(t), while the slow component corresponds in large
part to 1 rotameric jumps. Similarly, the MD-derived
parame-ters of dynamics are close to relaxation-derived parameparame-ters for the 1 methyl group of Ile44 (Figure S12-16, Tables S5 and S12). Molecular dynamics simulations show that the motions of the Ile44 side chain probed by relaxometry are dominated by 2 rotameric jumps, with limited 1 transitions (Table S13),
in excellent agreement with previous analyses of scalar and residual dipolar couplings.6,49 This time-scale separation of 1
and 2 dynamics is not found for all side chains in the MD
simulation (see Supporting Information). The interpretation of relaxometry datasets may thus require the use of site-specific models. Lattice-jump models61 may be appropriate when only few rotamers are accessible, whereas generalized diffusion on a rugged surface62 may be preferable for those systems that have many rotamers populated at equilibrium.
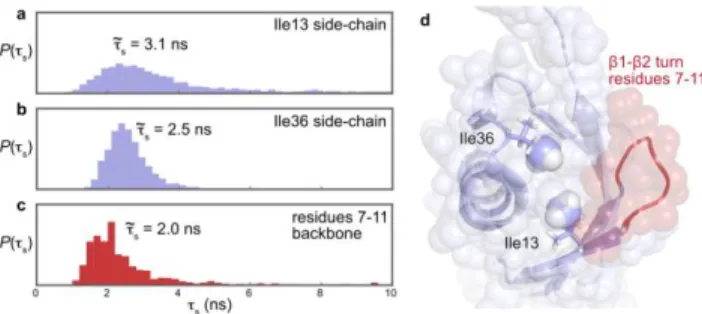
Figure 5. Nanosecond side chains and backbone motions of
ubiq-uitin. (a-c) Distributions of correlation times for slow internal motions obtained from the analysis of relaxometry datasets on: (a) 13
C(Ile13-1); (b) 13C(Ile36-1); (c) backbone nitrogen-15 relaxometry for residues 7-11 in the 1-2 turn, analyzed with an MCMC approach,38,47 the products of the distributions for the backbone nitrogen-15 nuclei of residues 7 to 11 is shown. (d) View of the structure of ubiquitin, showing the proximity of the 1-2 turn to the side chains of residues Ile13 and Ile36.
Taken together, the seven isoleucine side chains of ubiquitin can be grouped into three classes. Ile44 is the only isoleucine residue with a side chain that is fully solvent exposed at the protein surface. We identify motions with a correlation time s
= 1.3 ns that corresponds mostly to 2 rotameric jumps. On the
other hand, we cannot observe any significant motions on the
nanosecond timescale for the side chains of four residues: Ile3, Ile23, Ile30, and Ile61, all four of which are well packed in the hydrophobic core of ubiquitin. Note that the ill-defined slow nanosecond motions of Ile30, which has a rather high order parameter, is most likely due to the fact that we did not ac-count for the small anisotropy of the overall diffusion tensor of ubiquitin. For Ile3, Ile23, and Ile30, a single 1 and 2 rotamer
is predominantly populated over the course of the entire MD trajectory. Finally, nanosecond motions are defined for the neighboring side chains of the last pair comprising Ile13 and Ile36, which are located at the edge of the hydrophobic core of ubiquitin.
The correlation times of nanosecond motions also spatially coincide for Ile13 and Ile36. The Markov Chain Monte Carlo analysis provides distributions of probabilities for the parame-ters of the model. These distributions are narrow for the corre-lation times s of both Ile13 and Ile36. The median correlation
times for slower side chain motions are (13) = 3.1 ns for Ile13 and (36) = 2.5 ns for Ile36 (Figure 5a,b). Interestingly, the 1 methyl groups of Ile13 and Ile36 are spatially close (Figure 5d): the distance between the two C1 nuclei of Ile13 and Ile36 is only 5.9 Å in the NMR structure of ubiquitin (PDB code 2MJB).53 MD simulations have shown that jumps between rotamers in nearby aliphatic side chains can be signif-icantly correlated,33 although the correlation strengths are generally weak and fall off with dihedral angle distance.63 In addition, Ile13 flanks the mobile 1-2 turn (residues 7-11), while Ile36 belongs to the 1-3 loop (residues 34-40). These two regions were shown to undergo substantial motions in the main conformational mode detected by the analysis of residual dipolar couplings (RDCs) and MD simulations.64 In order to better evaluate the correlation time of nanosecond motions in the 1-2 turn, we re-analyzed the backbone nitrogen-15 high-resolution relaxometry dataset recorded for ubiquitin38 with the new version of our ICARUS software.47 Making the as-sumption that a single correlation time can account for slow motions in residues 7 to 11, we derived a probability distribu-tion of correladistribu-tion times , where
is the probability distribution of parameter s for residue i. The resulting probability distribution significantly
overlaps with the distributions found for the side chains of Ile13 and Ile36, with a median (7-11) = 2.0 ns (Figure 5c). Whether such an overlap of correlation times is coincidental or indicative of correlated motions is still open, but the presence of some degree of correlation between the side chains of Ile13 and Ile36 and the 1-2 turn (Figure 5d) would not be a sur-prise. Previous NMR ensemble analysis found correlated dynamics between different segments of ubiquitin, the 1-2 turn and the 1-3 loop64 as well as across the sheet,65 alt-hough without timescale information. Molecular dynamics simulations estimated that the concerted motion of the 1-2 turn and the 1-3 loop66 could be mostly described by two correlation times MD1 = 0.4 ns and MD2 = 13 ns, in good
agreement with the correlation times obtained here. Although an unambiguous identification of correlation effects remains challenging, this work demonstrates how the combination of high-resolution relaxometry and MD simulations can provide novel insights on such fundamental questions.
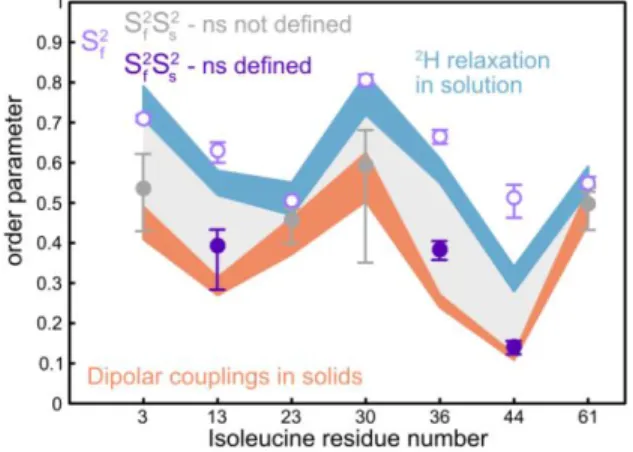
Order parameters obtained with high-resolution relaxometry are not only consistent with previous studies but provide addi-tional insights. We have compared order parameters for iso-leucine 1 methyl groups obtained with several methods:
high-field deuterium relaxation in solution,48 dipolar couplings in microcrystalline ubiquitin50 (Figure 6), residual dipolar cou-plings in solution,49 as well as molecular dynamics simulations (Figures S9, S10). Dipolar coupling measurements in solids and residual dipolar couplings in solution cover motions from picoseconds to milliseconds. Motions of proteins in crystals have been shown to depend on the crystal lattice.67 Provided that side chain motions are not significantly altered in the crystal, order parameters derived from dipolar coupling meas-urements define a lower bound for relaxation-based order parameters, which are insensitive to motions that are signifi-cantly slower than the overall tumbling of the protein (i.e. slower than a few tens of nanoseconds).68 Indeed, all order parameters (we define total order parameters as the product , see Equation 6) derived from high-resolution relaxometry are larger than or comparable to those derived from dipolar coupling measurements in solids and RDCs in solution. However, dipolar coupling measurements do not contain information about correlation times and relaxation-based approaches are necessary to learn about the timescales of motions.
Order parameters determined by high-resolution relaxometry are similar to or lower than those obtained from the analysis of high-field deuterium relaxation. This is ex-pected as high-field deuterium relaxation does not probe the spectral density function over a sufficiently broad range of frequencies to characterize the more complex models of mo-tions described here. The latter usually lead to lower total order parameters.55,69 So far, with few exceptions, the use of a single effective correlation time to account for methyl group motions25,48,70 has also led to poor evaluation of the effective internal correlation times, which is expected when simple models are used to fit complex motions from a limited da-taset.58
Figure 6. Comparison of order parameters for the motions of the
1 methyl symmetry axis obtained from high-resolution relaxometry and other approaches. Open purple symbols show order parameters for fast motions from high-resolution relaxometry. Solid purple symbols represent full order parameters from high-resolution relaxometry. Solid grey symbols represent full order parameters for residues for which the parameters of slow motion ( and ) are poorly defined so that the values of are not reliable. The vertical width of the blue band represents confidence intervals for order parameters ob-tained from deuterium relaxation.48 The width of the orange band represents confidence intervals for order parameters derived from the analysis of dipolar couplings in solids.50
Interestingly, the order parameters for fast motions ob-tained from our analysis agree remarkably well with order parameters derived from analyses that use simple models to interpret high-field deuterium relaxation48 or our relaxometry dataset for residues, Ile3, Ile23, Ile30, and Ile61 (Figure 6 and S8), suggesting that potential slow nanosecond motions cannot be captured by relaxation in solution. Deuterium relaxation measurements below 9.4 T would be necessary to define nano-second motions of the methyl axis (Tables S7-10). On the other hand, relaxometry-derived order parameters for fast motions are significantly higher than those obtained from deuterium relaxation for residues with well-defined nanosec-ond motions (Ile13, Ile36, and Ile44). This suggests that order parameters derived from deuterium relaxation data character-ize motions in a somewhat convoluted way, while the descrip-tion of modescrip-tions provided by relaxometry is more comprehen-sive as it reveals more detail by covering a wider range.
The overestimation of the order parameter obtained by deuterium relaxation analyses can, in some cases, have delete-rious consequences for the estimation of conformational en-tropy, which is a powerful application of these studies.23,30,31,36 Indeed, a systematic overestimation of order parameters di-rectly translates to a systematic underestimation of individual contributions to conformational entropy. Since relaxometry identifies motions in the nanosecond range better than conven-tional deuterium relaxation, relaxometry is expected to better estimate conformational entropy if additional microstates are explored on these timescales. When considering entropy
dif-ferences between two macrostates (e.g. free vs. bound
pro-tein), this enhanced sensitivity would have no effect if the amplitude of nanosecond motions were to be the same in the two macrostates. However, if the amplitude of nanosecond motions in the two macrostates differed, relaxometry would provide a more accurate estimation of the variation of entropy. The approach presented here allows the investigation of con-tributions to the conformational side-chain entropy on a broader range of timescales.
Carbon-13 relaxometry data provide potentially important benchmarks for the refinement of molecular dynamics force fields, which are complementary to benchmarks currently used, such as order parameters S2 alone determined by conven-tional methods. MD simulations offer a mechanistic descrip-tion of modescrip-tions identified by relaxometry, as shown here for Ile36 and Ile44. Yet, the agreement between experiments and simulations is poor for a set of residues (Figure S10), as was observed in other studies,27,35,71 reflecting the need for further improvements of MD force fields, conformational sampling, or both. Recent refinements of molecular dynamics force fields for proteins have focused on the accurate reproduction of equilibrium properties obtained by ab initio quantum chem-ical calculations,72 as well as experimental information, such as chemical shifts and residual dipolar couplings,60,73 deuteri-um relaxation,74 vicinal scalar coupling, and side-chain con-formations in large structural biology datasets.75,76 Faithfully computed equilibrium properties ensure that the local minima of the conformational energy surface have accurate relative energies. The analysis of relaxometry datasets yields effective correlation times that provide estimates of the energy barriers associated with conformational transitions. The information content of correlation times is unique, representing a sensitive target for further improvements of molecular dynamics force fields.
CONCLUSION
We have introduced a novel method, based on the combina-tion of high-resolucombina-tion relaxometry with high-field relaxacombina-tion measurements, to obtain an unprecedented detailed view of protein side-chain motions on picosecond-to-nanosecond timescales. We have quantitatively characterized motions of the isoleucine side chains of the protein ubiquitin with correla-tion times covering three orders of magnitude. Importantly, we have identified motions in the low-nanosecond range for three out of seven isoleucine side chains. The nature of these mo-tions was investigated with molecular dynamics simulamo-tions. Depending on the side chain, these nanosecond motions corre-spond to transitions between either 1 or 2 rotamers. Our
results are compatible with the presence of weakly correlated motions in the low-nanosecond regime between aliphatic side chains and the flexible 1-2 turn of ubiquitin. The applica-tion of high-resoluapplica-tion relaxometry to protein side chains opens the way to an experimental investigation of the mecha-nistic details of nanosecond motional modes in protein do-mains, which are essential for the assessment of conforma-tional entropy, their potential interplay with slower motions,59,77 as well as protein recognition and certain alloster-ic processes. In addition, the characterization of the correlation times of aliphatic side-chain motions provides valuable infor-mation to test and further refine force fields that underlie mo-lecular dynamics simulations.
EXPERIMENTAL SECTION
Sample Preparation. Specifically labelled [2H, 15 N]-ubiquitin Ile-1 (
13
C1H2H2) was produced by overexpression in E. coli BL21-(DE3)pLysS in fully deuterated M9 minimal
medium, containing 2 g/L of uniformly labeled [12C, 2 H]-glucose as the sole carbon source and 1 g/L of [15N, 2H] am-monium chloride (both products from Cortecnet). All salts used for the preparation of M9 medium have been dissolved in D2O (Cortecnet) and lyophilized to reduce the source of
exter-nal protons. After a slow adaptation in 50% deuterated M9, specific labelling has been performed by adding specifically labelled [13C1H2H2] -ketobutyrate (NMR-BIO)
78
for isoleu-cine one hour before induction.79 After lysis, ubiquitin was obtained using a cation exchange FPLC (Ammonium Acetate, 50-500 mM, pH 5.1) followed by gel filtration (50 mM am-monium acetate, 150 mM NaCl, pH 5). All columns were purchased from GE Healthcare. The prepared NMR samples contained 1.2 mM ubiquitin in D2O with 50 mM of deuterated
acetic acid at pH 4.6.
NMR Spectroscopy. Standard NMR relaxation experiments
(R1, R2, NOE) 80
were carried out on 4 high-field spectrome-ters: a Bruker Avance III 950 MHz equipped with a 5 mm TCI (1H, 13C, 15N, 2H) cryoprobe, with a z-axis gradient, a wide-bore Bruker Avance 800 spectrometer, operating at 18.8 T, using a 5 mm TXI (1H, 13C, 15N) probe with xyz-gradients, a Bruker Avance 600 spectrometer operating at 14.1 T, using a 5 mm TXI (1H, 13C, 15N) probe with xyz gradients and finally, a 400 MHz wide-bore Bruker Avance III equipped with a 5 mm TXI (1H, 13C, 15N) probe with a z-axis gradient. High-resolution relaxometry experiments were performed with the same 600 MHz spectrometer equipped with a shuttle apparatus and a 3.2 mm triple-resonance probe with a z-axis gradient.38 The experimental temperature was set to 298.0 +/- 0.2 K, and
calibrated prior to every experiment using the chemical shift difference between the deuterated acetic acid and residual water signals.47
Assignment of the amide and Ile- methyl groups have been taken from the BMRB (entry 6457). The high deuteration level was confirmed by the absence of cross-peaks in a NOESY spectrum. Additional details about pulse sequences and parameters used for the measurements of relaxation rates are available in Supplementary Information.
NMR data analysis. NMR spectra were processed and
ana-lyzed using NMRPipe.81 The decay of the peak intensities was analyzed using NMRPipe.81 The fit of relaxation rates to signal decays was performed with Curvefit.82
High Resolution Relaxometry Data Analysis. The
esti-mate of longitudinal relaxation rates from apparent high-resolution relaxometry rates has been obtained using ICARUS,38,47 adapted for 13C2H2
1
H methyl groups. The spin system was extended to include an additional deuterium nu-cleus, to account for dipolar interactions with deuterons in the protein.83 The effective position of the remote deuteron is determined using proton auto-relaxation rates measured at three fields (0.33 T, 14.1 T and 18.8 T). The ICARUS analysis starts with high-field data only to generate a first set of mo-tional parameters (and value of the CSA when relevant). The relaxometry experiments are then simulated to correct the relaxometry rates iteratively. After each iteration, high field and relaxometry rates are fitted together to determine motional parameters used in the next iteration. Two iterations were sufficient to reach convergence of the correction factors.
The parameters of local dynamics are obtained with a min-imization procedure that uses 50 iterations of basin-hopping (implemented in the scipy Python library) to minimize 2. Pre-defined derivatives were used during the minimization. 10,000 random sets of motional parameters were then generated around the solution. If one of these sets leads to a lower 2, it becomes the starting point for another basin-hopping minimi-zation. This ensures that gradients do not trap the system in a local minimum.
Determination of the Motional Parameters and Error Estimation. The high-field and corrected relaxometry data
were then used in a Markov Chain Monte Carlo (MCMC) procedure. We used the emcee library52 for the sampling. 20 chains were generated, each chain including 10,000 steps. The mean parameters and corresponding errors were then deter-mined.
Molecular dynamics simulations. A 1 s MD simulation of ubiquitin was performed with the ff99SBnmr1-ILDN force field60 using the Gromacs 4 package.84 For this purpose, the protein was solvated in a cubic box with explicit TIP3P water extending at least 8 Å from the protein to the edges of the box. The protonation state of the protein was adjusted to neutral pH, and the net charge of the system was set to zero by adding counter ions. Long-range electrostatic interactions were treat-ed using the PME algorithm with 1.2 Å spacing at an 8 Å cutoff distance. van der Waals interactions had a cutoff dis-tance of 10 Å. All bond lengths involving hydrogen atoms were constrained using the SETTLE algorithm. After applica-tion of a standard energy-minimizaapplica-tion and equilibraapplica-tion pro-tocol, a 1 μs production MD run was performed with a 2 fs integration time step at a constant temperature of 300 K and 1 atm pressure (NPT ensemble). A frame was stored every 1 ps, which yielded a total of 1 million snapshots for subsequent analysis.
ASSOCIATED CONTENT
Supporting Information
The Supporting Information is available free of charge on the ACS Publications website.
Detailed materials and methods; details on the correction of relaxometry rates; tables of high-field relaxation rates; fit of re-laxation rates; distributions of parameters of local dynamics and chemical shift anisotropy; a simple model for the classical limit for methyl group rotation; analysis of non-corrected low-field relaxation rates; analysis of synthetic deuterium relaxation da-tasets; analysis of a subset of low-field relaxation rates; contribu-tion of chemical exchange to transverse relaxacontribu-tion; comparison of order parameters determined with different approaches; fit of the correlation functions from molecular dynamics simulations; spec-tral density function for the CH internuclear vector; side-chain Ramachandran plots from molecular dynamics simulations; side-chain dihedral angle correlation functions from molecular dynam-ics simulations; tables of high-field and relaxometry relaxation rates.
AUTHOR INFORMATION
Corresponding Author
* [email protected] and [email protected]
Present Addresses
‡ Université de Lyon, CNRS, Université Claude Bernard Lyon 1, ENS de Lyon, Institut des Sciences Analytiques, UMR 5280, 69100 Villeurbanne, France.
§
Central European Institute of Technology, Masaryk University, Kamenice 5, 625 00 Brno, Czech Republic.
#
Laboratory of Chemical Physics, NIDDK, NIH, Bethesda, MD, 20892, USA.
Funding Sources
This research has received funding from the European Research Council (ERC) under the European Community’s Seventh Framework Programme (FP7/2007-2013), ERC Grant agreement 279519 (2F4BIODYN) (to F.F.), the Equipex contract ANR-10-EQPX-09, and the National Science Foundation (grant NSF MCB 1715505 to R.B.). Financial support from the TGIR-RMN-THC FR 3050 CNRS is gratefully acknowledged.
Notes
†
These authors contributed equally to this work.
J.-M. T. and T. M. are employees of Bruker Biospin. The authors declare no other conflict of interest.
ACKNOWLEDGMENT
The authors would like to thank Shahid Khan (Ecole Normale Supérieure, Paris) for assistance with sample preparation, Philippe Pelupessy, Diego Carnevale, Daniel Abergel, Guillaume Bouvignies, Geoffrey Bodenhausen, Rodolphe Vuilleumier (Ecole Normale Supérieure, Paris), Jean-Nicolas Dumez (Institut de Chimie des Substances Naturelles, Gif-sur-Yvette), and Dawei Li (CCIC NMR, OSU) for fruitful discussions, Kaushik Dutta (New York Structural Biology Center) for the ubiquitin plasmid, Donghan Lee (University of Louisville) for sharing data on chem-ical exchange, as well as Jérôme Boisbouvier and Adrien Favier (Institut de Biologie Structurale, Grenoble) for assistance with protein expression protocols and NMR experiments respectively. REFERENCES
(1) Frauenfelder, H.; Sligar, S. G.; Wolynes, P. G. The energy landscapes and motions of proteins; Science 1991, 254, 1598.
(2) DuBay, K. H.; Bowman, G. R.; Geissler, P. L. Fluctuations within Folded Proteins: Implications for Thermodynamic and Allosteric Regulation; Acc. Chem. Res. 2015, 48, 1098.
(3) Kasinath, V.; Fu, Y.; Sharp, K. A.; Wand, A. J. A Sharp Thermal Transition of Fast Aromatic-Ring Dynamics in Ubiquitin;
Angewandte Chemie International Edition 2015, 54, 102.
(4) Frederick, K. K.; Marlow, M. S.; Valentine, K. G.; Wand, A. J. Conformational entropy in molecular recognition by proteins; Nature
2007, 448, 325.
(5) Wagner, G.; Demarco, A.; Wuthrich, K. Dynamics of aromatic amino-acid residues in globular conformation of basic pancreatic trypsin-inhibitor (BPTI) .1. H-1 NMR-studies; Biophysics of Structure
and Mechanism 1976, 2, 139.
(6) Chou, J. J.; Case, D. A.; Bax, A. Insights into the Mobility of Methyl-Bearing Side Chains in Proteins from 3JCC and 3JCN Couplings; J. Am. Chem. Soc. 2003, 125, 8959.
(7) Igumenova, T. I.; Frederick, K. K.; Wand, A. J. Characterization of the Fast Dynamics of Protein Amino Acid Side Chains Using NMR Relaxation in Solution; Chem. Rev. 2006, 106, 1672.
(8) Esadze, A.; Li, D. W.; Wang, T. Z.; Bruschweiler, R.; Iwahara, J. Dynamics of Lysine Side-Chain Amino Groups in a Protein Studied by Heteronuclear (1)H-(15)N NMR Spectroscopy; J. Am. Chem. Soc.
2011, 133, 909.
(9) Buck, M.; Boyd, J.; Redfield, C.; Mackenzie, D. A.; Jeenes, D. J.; Archer, D. B.; Dobson, C. M. Structural Determinants of Protein Dynamics - Analysis of N-15 Nmr Relaxation Measurements for Main-Chain and Side-Chain Nuclei of Hen Egg-White Lysozyme;
Biochemistry 1995, 34, 4041.
(10) Trbovic, N.; Cho, J. H.; Abel, R.; Friesner, R. A.; Rance, M.; Palmer, A. G. Protein Side-Chain Dynamics and Residual Conformational Entropy; J. Am. Chem. Soc. 2009, 131, 615.
(11) Werbeck, N. D.; Kirkpatrick, J.; Hansen, D. F. Probing Arginine Side-Chains and Their Dynamics with Carbon-Detected NMR Spectroscopy: Application to the 42 kDa Human Histone Deacetylase 8 at High pH; Angew. Chem.-Int. Edit. 2013, 52, 3145.
(12) Paquin, R.; Ferrage, F.; Mulder, F. A. A.; Akke, M.; Bodenhausen, G. Multiple-Timescale Dynamics of Side-Chain Carboxyl and Carbonyl Groups in Proteins by 13C Nuclear Spin Relaxation; J. Am. Chem. Soc. 2008, 130, 15805.
(13) Stafford, K. A.; Ferrage, F.; Cho, J.-H.; Palmer, A. G. Side Chain Dynamics of Carboxyl and Carbonyl Groups in the Catalytic Function of Escherichia coli Ribonuclease H; J. Am. Chem. Soc.
2013, 135, 18024.
(14) Pasat, G.; Zintsmaster, J. S.; Peng, J. W. Direct 13C Detection for Carbonyl Relaxation Studies of Protein Dynamics; J. Magn.
Reson. 2008, 193, 226.
(15) LeMaster, D. M.; Kushlan, D. M. Dynamical mapping of E-coli thioredoxin via C-13 NMR relaxation analysis; J. Am. Chem. Soc.
1996, 118, 9255.
(16) Weininger, U.; Respondek, M.; Akke, M. Conformational exchange of aromatic side chains characterized by L-optimized TROSY-selected C-13 CPMG relaxation dispersion; J. Biomol. NMR
2012, 54, 9.
(17) LeMaster, D. M. NMR Relaxation Order Parameter Analysis of the Dynamics of Protein Side Chains; J. Am. Chem. Soc. 1999,
121, 1726.
(18) Nicholson, L. K.; Kay, L. E.; Baldisseri, D. M.; Arango, J.; Young, P. E.; Bax, A.; Torchia, D. A. Dynamics of methyl-groups in proteins as studied by proton-detected C-13 NMR-spectroscopy - application to the leucine residues of staphylococcal nuclease;
Biochemistry 1992, 31, 5253.
(19) Palmer, A. G.; Hochstrasser, R.; Millar, D. P.; Rance, M.; Wright, P. E. Side chain dynamics of a zinc finger peptide characterized by 13C NMR relaxation measurements and fluorescence anisotropy decay; J. Am. Chem. Soc. 1993, 115, 6333.
(20) Muhandiram, D. R.; Yamazaki, T.; Sykes, B. D.; Kay, L. E. Measurement of 2H T1ro Relaxation Times in Uniformly
13C-Labeled and Fractionally 2H-13C-Labeled Proteins in Solution; J. Am.
Chem. Soc. 1995, 117, 11536.
(21) Millet, O.; Muhandiram, D. R.; Skrynnikov, N. R.; Kay, L. E. Deuterium Spin Probes of Side-Chain Dynamics in Proteins. 1. Measurement of Five Relaxation Rates per Deuteron in 13C-Labeled and Fractionally 2H-Enriched Proteins in Solution; J. Am. Chem. Soc.
2002, 124, 6439.
(22) Liao, X.; Long, D.; Li, D.-W.; Brueschweiler, R.; Tugarinov, V. Probing Side-Chain Dynamics in Proteins by the Measurement of Nine Deuterium Relaxation Rates Per Methyl Group; J. Phys. Chem.
B 2012, 116, 606.
(23) Tzeng, S. R.; Kalodimos, C. G. Protein activity regulation by conformational entropy; Nature 2012, 488, 236.
(24) Johnson, E.; Chazin, W. J.; Rance, M. Effects of calcium binding on the side-chain methyl dynamics of calbindin D-9k: A H-2 NMR relaxation study; J. Mol. Biol. 2006, 357, 1237.
(25) Xue, Y.; Pavlova, M. S.; Ryabov, Y. E.; Reif, B.; Skrynnikov, N. R. Methyl rotation barriers in proteins from H-2 relaxation data. Implications for protein structure; J. Am. Chem. Soc. 2007, 129, 6827. (26) Reif, B.; Xue, Y.; Agarwal, V.; Pavlova, M. S.; Hologne, M.; Diehl, A.; Ryabov, Y. E.; Skrynnikov, N. R. Protein side-chain dynamics observed by solution- and solid-state NMR: Comparative analysis of methyl H-2 relaxation data; J. Am. Chem. Soc. 2006, 128, 12354.
(27) Showalter, S. A.; Johnson, E.; Rance, M.; Bruschweiler, R. Toward quantitative interpretation of methyl side-chain dynamics from NMR by molecular dynamics simulations; J. Am. Chem. Soc.
2007, 129, 14146.
(28) Ishima, R.; Petkova, A. P.; Louis, J. M.; Torchia, D. A. Comparison of methyl rotation axis order parameters derived from model-free analyses of H-2 and C-13 longitudinal and transverse relaxation rates measured in the same protein sample; J. Am. Chem.
Soc. 2001, 123, 6164.
(29) Caro, J. A.; Harpole, K. W.; Kasinath, V.; Lim, J.; Granja, J.; Valentine, K. G.; Sharp, K. A.; Wand, A. J. Entropy in molecular recognition by proteins; Proc. Natl. Acad. Sci. U. S. A. 2017, 114, 6563.
(30) Kasinath, V.; Sharp, K. A.; Wand, A. J. Microscopic Insights into the NMR Relaxation-Based Protein Conformational Entropy Meter; J. Am. Chem. Soc. 2013, 135, 15092.
(31) Akke, M.; Brüschweiler, R.; Palmer III, A. G. NMR Order Parameters and Free Energy: An Analytical Approach and Its Application to Cooperative Ca2+ Binding by Calbindin Dgk; J. Am.
Chem. Soc. 1993, 115, 9832.
(32) Yang, D. W.; Kay, L. E. Contributions to conformational entropy arising from bond vector fluctuations measured from NMR-derived order parameters: Application to protein folding; J. Mol. Biol.
1996, 263, 369.
(33) Best, R. B.; Clarke, J.; Karplus, M. What Contributions to Protein Side-chain Dynamics are Probed by NMR Experiments? A Molecular Dynamics Simulation Analysis; J. Mol. Biol. 2005, 349, 185.
(34) O'Brien, E. S.; Wand, A. J.; Sharp, K. A. On the ability of molecular dynamics force fields to recapitulate NMR derived protein side chain order parameters; Protein Sci. 2016, 25, 1156.
(35) Bowman, G. R.; Geissler, P. L. Extensive Conformational Heterogeneity within Protein Cores; J. Phys. Chem. B 2014, 118, 6417.
(36) Yang, D.; Kay, L. E. Contributions to Conformational Entropy Arising from Bond Vector Fluctuations Measured from NMR-Derived Order Parameters : Application to Protein Folding; J. Mol.
Biol. 1996, 263, 369.
(37) Redfield, A. G. Shuttling device for high-resolution measurements of relaxation and related phenomena in solution at low field, using a shared commercial 500 MHz NMR instrument; Magn.
Reson. Chem. 2003, 41, 753.
(38) Charlier, C.; Khan, S. N.; Marquardsen, T.; Pelupessy, P.; Reiss, V.; Sakellariou, D.; Bodenhausen, G.; Engelke, F.; Ferrage, F. Nanosecond Time Scale Motions in Proteins Revealed by High-Resolution NMR Relaxometry; J. Am. Chem. Soc. 2013, 135, 18665.
(39) Clarkson, M. W.; Lei, M.; Eisenmesser, E. Z.; Labeikovsky, W.; Redfield, A.; Kern, D. Mesodynamics in the SARS nucleocapsid measured by NMR field cycling; J. Biomol. NMR 2009, 45, 217.
(40) Cousin, S. F.; Charlier, C.; Kaderavek, P.; Marquardsen, T.; Tyburn, J.-M.; Bovier, P.-A.; Ulzega, S.; Speck, T.; Wilhelm, D.; Engelke, F.; Maas, W.; Sakellariou, D.; Bodenhausen, G.; Pelupessy, P.; Ferrage, F. High-resolution two-field nuclear magnetic resonance spectroscopy; PCCP 2016, 18, 33187.
(41) Cousin, S. F.; Kadeřávek, P.; Haddou, B.; Charlier, C.; Marquardsen, T.; Tyburn, J.-M.; Bovier, P.-A.; Engelke, F.; Maas, W.; Bodenhausen, G.; Pelupessy, P.; Ferrage, F. Recovering Invisible Signals by Two-Field NMR Spectroscopy; Angew. Chem. Int. Ed.
2016, 55, 9886.
(42) Ishima, R.; Louis, J. M.; Torchia, D. A. Transverse 13C Relaxation of CHD2 Methyl Isotopmers To Detect Slow Conformational Changes of Protein Side Chains; J. Am. Chem. Soc.
1999, 121, 11589.
(43) Tugarinov, V.; Kay, L. E. Quantitative C-13 and H-2 NMR relaxation studies of the 723-residue enzyme malate synthase g reveal a dynamic binding lnterface; Biochemistry 2005, 44, 15970.
(44) Lipari, G.; Szabo, A. Model-Free Approach to the Interpretation of Nuclear Magnetic Resonance Relaxation In Macromolecules 1. Theory and Range of Validity; J. Am. Chem. Soc.
1982, 104, 4546.
(45) Halle, B. The physical basis of model-free analysis of NMR relaxation data from proteins and complex fluids; J. Chem. Phys.
2009, 131.
(46) Clore, G. M.; Szabo, A.; Bax, A.; Kay, L. E.; Driscoll, P. C.; Gronenborn, A. M. Deviations from the Simple 2-Parameter Model-Free Approach to the Interpretation of N-15 Nuclear Magnetic-Relaxation of Proteins; J. Am. Chem. Soc. 1990, 112, 4989.
(47) Cousin, S. F.; Kaderavek, P.; Bolik-Coulon, N.; Ferrage, F. Determination of Protein ps-ns Motions by High-Resolution Relaxometry; Methods Mol. Biol. 2018, 1688, 169.
(48) Lee, A. L.; Flynn, P. F.; Wand, A. J. Comparison of 2H and 13C NMR Relaxation Techniques for the Study of Protein Methyl Group Dynamics in Solution; J. Am. Chem. Soc. 1999, 121, 2891.
(49) Fares, C.; Lakomek, N. A.; Walter, K. F. A.; Frank, B. T. C.; Meiler, J.; Becker, S.; Griesinger, C. Accessing ns-mu s side chain dynamics in ubiquitin with methyl RDCs; J. Biomol. NMR 2009, 45, 23.
(50) Schanda, P.; Huber, M.; Boisbouvier, J.; Meier, B. H.; Ernst, M. Solid-State NMR Measurements of Asymmetric Dipolar Couplings Provide Insight into Protein Side-Chain Motion; Angew.
Chem.-Int. Edit. 2011, 50, 11005.
(51) Bolik-Coulon, N.; Cousin, S. F.; Ferrage, F. ICARUS, http://www.paris-en-resonance.fr/code/code_samples.php
(52) Foreman-Mackey, D.; Hogg, D. W.; Lang, D.; Goodman, J. emcee: The MCMC Hammer; arXiv 2012, arXiv:1202.3665.
(53) Maltsev, A. S.; Grishaev, A.; Roche, J.; Zasloff, M.; Bax, A. Improved Cross Validation of a Static Ubiquitin Structure Derived from High Precision Residual Dipolar Couplings Measured in a Drug-Based Liquid Crystalline Phase; J. Am. Chem. Soc. 2014, 136, 3752.
(54) Batchelder, L. S.; Niu, C. H.; Torchia, D. A. Methyl reorientation in polycrystalline amino acids and peptides: a deuteron NMR spin-lattice relaxation study; J. Am. Chem. Soc. 1983, 105, 2228.
(55) Mandel, A. M.; Akke, M.; Palmer III, A. G. Backbone Dynamics of Escherichia coliRibonuclease HI : Correlations with Structure and Function in an Active Enzyme; J. Mol. Biol. 1995, 246, 144.
(56) Fushman, D.; Cahill, S.; Cowburn, D. The main chain dynamics of the dynamin pleckstrin homology (PH) domain in solution: analysis of 15N relaxation with monomer/dimer equilibration; J. Mol. Biol. 1997, 266, 173.
(57) d'Auvergne, E. J.; Gooley, P. R. Optimisation of NMR dynamic models II. A new methodology for the dual optimisation of the model-free parameters and the Brownian rotational diffusion tensor; J. Biomol. NMR 2008, 40, 121.
(58) Smith, A. A.; Ernst, M.; Meier, B. H. Because the Light is Better Here: Correlation-Time Analysis by NMR Spectroscopy;
Angew. Chem. Int. Ed. 2017, 56, 13590.
(59) Smith, C. A.; Ban, D.; Pratihar, S.; Giller, K.; Schwiegk, C.; de Groot, B. L.; Becker, S.; Griesinger, C.; Lee, D. Population Shuffling of Protein Conformations; Angew. Chem.-Int. Edit. 2015,
54, 207.
(60) Li, D. W.; Bruschweiler, R. NMR-Based Protein Potentials;
Angew. Chem.-Int. Edit. 2010, 49, 6778.
(61) Xia, J.; Deng, N.-j.; Levy, R. M. NMR Relaxation in Proteins with Fast Internal Motions and Slow Conformational Exchange: Model-Free Framework and Markov State Simulations; The Journal
of Physical Chemistry B 2013, 117, 6625.
(62) Calandrini, V.; Abergel, D.; Kneller, G. R. Fractional protein dynamics seen by nuclear magnetic resonance spectroscopy: Relating molecular dynamics simulation and experiment; J. Chem. Phys. 2010,
133.
(63) Li, D.-W.; Meng, D.; Brüschweiler, R. Short-Range Coherence of Internal Protein Dynamics Revealed by High-Precision in Silico Study; J. Am. Chem. Soc. 2009, 131, 14610.
(64) Lange, O. F.; Lakomek, N. A.; Fares, C.; Schroder, G. F.; Walter, K. F. A.; Becker, S.; Meiler, J.; Grubmuller, H.; Griesinger, C.; de Groot, B. L. Recognition dynamics up to microseconds revealed from an RDC-derived ubiquitin ensemble in solution;
Science 2008, 320, 1471.
(65) Fenwick, R. B.; Esteban-Martin, S.; Richter, B.; Lee, D.; Walter, K. F. A.; Milovanovic, D.; Becker, S.; Lakomek, N. A.; Griesinger, C.; Salvatella, X. Weak Long-Range Correlated Motions in a Surface Patch of Ubiquitin Involved in Molecular Recognition; J.
Am. Chem. Soc. 2011, 133, 10336.
(66) Long, D.; Brüschweiler, R. In Silico Elucidation of the Recognition Dynamics of Ubiquitin; PLoS Comput Biol 2011, 7, e1002035.
(67) Ma, P. X.; Xue, Y.; Coquelle, N.; Haller, J. D.; Yuwen, T. R.; Ayala, I.; Mikhailovskii, O.; Willbold, D.; Colletier, J. P.; Skrynnikov, N. R.; Schanda, P. Observing the overall rocking motion of a protein in a crystal; Nature Communications 2015, 6.
(68) Gu, Y.; Li, D. W.; Bruschweiler, R. NMR Order Parameter Determination from Long Molecular Dynamics Trajectories for Objective Comparison with Experiment; Journal of Chemical Theory
and Computation 2014, 10, 2599.
(69) Butterwick, J. A.; Loria, J. P.; Astrof, N. S.; Kroenke, C. D.; Cole, R.; Rance, M.; Palmer, A. G. Multiple time scale backbone dynamics of homologous thermophilic and mesophilic ribonuclease HI enzymes; J. Mol. Biol. 2004, 339, 855.
(70) Skrynnikov, N. R.; Millet, O.; Kay, L. E. Deuterium spin probes of side-chain dynamics in proteins. 2. Spectral density mapping and identification of nanosecond time-scale side-chain motions; J. Am. Chem. Soc. 2002, 124, 6449.
(71) Anderson, J. S.; Hernández, G.; LeMaster, D. M. Prediction of Bond Vector Autocorrelation Functions from Larmor Frequency-Selective Order Parameter Analysis of NMR Relaxation Data;
Journal of Chemical Theory and Computation 2017, 13, 3276.
(72) Hornak, V.; Abel, R.; Okur, A.; Strockbine, B.; Roitberg, A.; Simmerling, C. Comparison of multiple Amber force fields and development of improved protein backbone parameters; Proteins:
Structure, Function, and Bioinformatics 2006, 65, 712.
(73) Li, D. W.; Bruschweiler, R. Iterative Optimization of Molecular Mechanics Force Fields from NMR Data of Full-Length Proteins; Journal of Chemical Theory and Computation 2011, 7, 1773.
(74) Hoffmann, F.; Mulder, F. A. A.; Schäfer, L. V. Accurate Methyl Group Dynamics in Protein Simulations with AMBER Force Fields; The Journal of Physical Chemistry B 2018, 122, 5038.
(75) Lindorff-Larsen, K.; Piana, S.; Palmo, K.; Maragakis, P.; Klepeis, J. L.; Dror, R. O.; Shaw, D. E. Improved side-chain torsion potentials for the Amber ff99SB protein force field; Proteins:
Structure, Function, and Bioinformatics 2010, 78, 1950.
(76) Maier, J. A.; Martinez, C.; Kasavajhala, K.; Wickstrom, L.; Hauser, K. E.; Simmerling, C. ff14SB: Improving the Accuracy of Protein Side Chain and Backbone Parameters from ff99SB; Journal of
Chemical Theory and Computation 2015, 11, 3696.
(77) Hansen, D. F.; Neudecker, P.; Kay, L. E. Determination of Isoleucine Side-Chain Conformations in Ground and Excited States of Proteins from Chemical Shifts; J. Am. Chem. Soc. 2010, 132, 7589.
(78) Gardner, K. H.; Kay, L. E. The use of H-2, C-13, N-15 multidimensional NMR to study the structure and dynamics of proteins; Annu. Rev. Biopys. Biomol. Struct. 1998, 27, 357.
(79) Kerfah, R.; Plevin, M. J.; Sounier, R.; Gans, P.; Boisbouvier, J. Methyl-specific isotopic labeling: a molecular tool box for solution NMR studies of large proteins; Curr. Opin. Struct. Biol. 2015, 32, 113.
(80) Ferrage, F. Protein Dynamics by 15N Nuclear Magnetic Relaxation; Methods Mol. Biol. 2012, 831, 141.
(81) Delaglio, F.; Grzesiek, S.; Vuister, G. W.; Zhu, G.; Pfeifer, J.; Bax, A. NMRPipe: a Multidimensional Spectral Processing System Based on UNIX Pipes; J. Biomol. NMR 1995, 6, 277.
(82) Palmer III, A. G. CURVEFIT, http://www.palmer.hs.columbia.edu
(83) Tugarinov, V.; Sprangers, R.; Kay, L. E. Line narrowing in methyl-TROSY using zero-quantum H-1-C-13 NMR spectroscopy; J.
Am. Chem. Soc. 2004, 126, 4921.
(84) Hess, B.; Kutzner, C.; van der Spoel, D.; Lindahl, E. GROMACS 4: Algorithms for Highly Efficient, Load-Balanced, and Scalable Molecular Simulation; Journal of Chemical Theory and