Appl. Magn. Reson. 28, 147-163 (2005)
Applled
Magnetlc Resonance
9 Springer-Verlag 2005 Printed in AustriaTemperature-Dependent Protein Backbone Dynamics
from Auto- and Cross-Correlated NMR Relaxation Rates
L. V u g m e y s t e r I and G. B o d e n h a u s e n 1'2
t Institut des Sciences et Ing› Chimiques, Ecole Polytechnique F›233 de Lausanne, Lausanne, Switzerland
2D› de Chimie, Associ› au Centre National de la Recherche Scientifique, Ecole Normale Sup› Paris, France
Received July 13, 2004
Abstract. The temperature dependence of nuclear magnetic resonance relaxation rates was investi- gated for the backbone of tSN/~3C labeled human ubiquitin in the temperature range of 20-50 ~ The ~SN autorelaxation rates give evidente that the potential energy functions for ~SN-HN bonds ate not quadratic, in agreement with results for other proteins. Cross-correlation rates arising from corre- lated fluctuations of two ~SN-HN dipole~iipole interactions involving successive residues were ob- tained by the method of Petupessy et al. (E Pelupessy, S. Ravindranathan, G. Bodenhausen: J. Biomol. NMR 25, 265-280, 2003). The results suggest the presente of slow internal motions at 50 ~
1 I n t r o d u c t i o n
Dynamics of proteins occur on a wide range of time scales and many techniques have been devised to characterize intemal motions [1-4]. Both correlated and uncorrelated motions are possible [4, 5]. Corretated motions have been recently investigated with a variety of nuclear magnetic resonance (NMR) techniques [5- 10]. It is interesting to study the change in intemal dynamics under the influ- ence o f various perturbations. Temperature is one o f the important factors, since it can provide a probe o f many aspects such as protein stability, protein fold- ing, and ligand binding [11-14], as well as ah experimental means for investi- gating the energy landscape [15]. The temperature dependence o f iSN auto- relaxation rates in the backbone have been studied for a number o f proteins [13, 14, 16-25]. The longitudinal and transverse relaxation rates and heteronuclear Overhauser effects [26] are often analyzed by the model-free formalism o f Lipari and Szabo [27] and its extension by Clore and co-workers [28]. On the basis o f the temperature dependence o f the autorelaxation rates, it has been suggested that backbone dynamics play little rote in heat capacity differences between folded
148 L. Vugmeyster and G. Bodenhausen
and unfolded states of proteins [14, 16, 17]. Zuiderweg and co-workers [24] have compared the temperature dependence of ~SN-1H and 13Ct-13C ct reorientational
dynamics for binase and ubiquitin. Their results give a strong indication that some backbone motions activated at room temperature are not sensed by the ~SN- IH vectors. This is in agreement with recent multiple quantum experiments at room temperature involving 13C' and 15N nuctei [29].
In this work we analyze the temperature dependence of cross-correlated re- laxation rates arising from correlated fluctuations of two N - H N dipole-dipole interactions involving successive residues in a ~5N/~3C labeled sample of human ubiquitin in the temperature range of 20-50 ~ For the determination of the cross-correlated relaxation rates we used the method developed by Pelupessy et al. [10]. The 15N autorelaxation rates were obtained under the same conditions. Ubiquitin is an extremely thermostable protein, the midpoint of temperature-in- duced unfolding being at 91 ~ [30]. Zuiderweg and co-workers [24] obtained autorelaxation rates for ubiquitin in the range of 5--45 ~ The temperature de- pendence of hydrogen bond strengths have been analysed for
~SN/~3C/ZD
ubiquitin at pH 6.5 in the range of 25-55 ~ [18].2 Cross-Correlation Spectral Densities
In this section we give a brief outline of the model that is used to derive cross- correlated spectral density functions. The details of the theory have been pre- sented elsewhere [31]. We consider correlated fluctuations of two interactions u and v. The model is valid for dipole-dipole interactions between nuclei that are at a fixed distance from each other, and for chemical shift anisotropy interac- tions described by tensors that are axially symmetric with components which are independent of internal motions. The dynamics of each interaction u will be f and s corre- described by three parameters, i.e., two local correlation times r u tu sponding to fast and slow internal motions, in addition to the isotropic global correlation time re, which characterizes the global tumbling of the molecule. In this work we consider cases for which r f << r c << r~. In an earlier work [31] more general cases have been considered.
The overall cross-correlation function
Cuv(t)
can be decomposed into contri- butions due to overall and internal motions [27]:C~v
(t) = C gl~ (t)Cª (t).A two-step model is presented for the cross-correlation function of the internal motions
C~~'(t).
In a first step, the cross-correlation function reaches a quasi-equi- lib¡ stateC~nt'q(t),
corresponding to the equilibrium with respect to the fast fluctuations with a characteristic time-constant r f. In a second step, the quasi- equilibrium state converges to the true equilibrium, characterized by the cross- correlated order parameter $2~ = C~~ xq with a characteristic time-constant r~Slow Motions by Cross-Correlated Relaxation 149 dC~~t(t) _ 1 (Cª (t) - Cª '.q (t)), f dt r, int, q
dC~v
(t) 1 int, q inteq - (C~v(t)-c;;).
dt r~Fast internal motions will be considered to be independent and axially symmet- ric for the two interactions u and v. Since r~ << r~, the system rapidly converges to the quasi-equilibrium state. Slow motions can be described in terms o f mo- bility of the quasi-equilibrium vectors uq and vq.
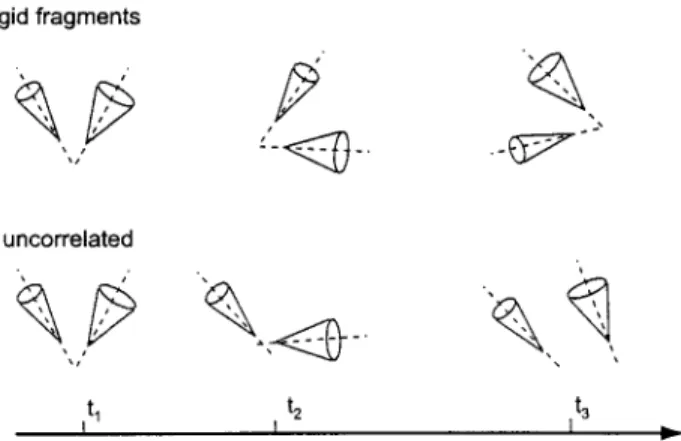
Three scenarios are considered for slow internal motions: (i) uncorrelated fluc- tuations of uq and vq; (ii) a "rigid-fragment" case corresponding to synchronous fluctuations o f uq and vq with a constant angle Oqv between them; (iii) partial correlation o f the motions of uq and vq. Figure 1 depicts the rigid-fragment (top) and uncorrelated cases (bottom). Fast motions of the two vectors u and v are represented by cones. The slow motions of uq and vq are represented by re- orientations of the axes of the cones. Using the two-step model described above, expressions for the spectral densities can be derived for cases i-iii.
(i) For uncorrelated fluctuations,
_ 2S2 Z'c
J,~(co) - ~ .~ 1 + 0.)291 2 . (4)
If we assume that the slow fluctuations are axially symmetric [31], the cross- correlated order parameter can be decomposed into a product of autocorrelated
rigid fragments
uncorrelated
t z t3
it~ t I
Fig. 1. Illustration of two extremes of slow intemal motions. Fast axially symmetric uncorrelated mo- tions of the vectors u and v are represented by two cones. Time is represented along the horizontal axis with three different time points marked as q, t2, and t 3. The axes of the cones, which are depicted by dashed lines, represent the quasi-equilibrium vectors u q and vq. The top figure represents the rigid- fragment case, where the angle ~v between the axes is fixed, and the bottom figure represents the
150 L. Vugmeyster and G. Bodenhausen
order parameters S~. and S~~ due to fast motions, and order parameters S~. and S~ due to slow motions
S~ = SLS~SLS~~ (cos02), (5)
where 0~e~ q is the angle between the equilibrium vectors u ~q and v ~q and P2 is the Legendre polynomial. This results in the following expression for the spectral density function:
J~v(CO) = 2 sf s~s~~s~P2(cost~~~) r~
(ii) For a rigid fragment,
2 f f re
J2v vd (ro) = ~S.~SuvP 2 (cos ~~) 1
1 +co2r 2 " (6)
2 2 ~
+O.) Z" c (7)
where Oq vis the angle between uq and vq, which is a constant in this case, so that (0q v ) = 0q~. Equation (7) can be compared with Eq. (6), which is valid in the absence of correlations. A remarkable feature of the spectral density in these two distinct regimes is the proportionality of J~v(co) to either P2(cos02q) for the uncorrelated case or to
P2(cosOqu)
for a rigid fragment. Neither of these proportionalities will however apply to the case of partial correlations. Note that in general the average angle (0q v) between the two vectors uq and vq is not equal to the angle Oª The angle 0ª can be estimated from X-ray or NMR structures.(iii) For partial correlations,
2<:
~~
v2 , ,(~(cose,))
~~
(8)
L , ( a , ) = t'q(O)l+ z z - a $2=S~ 1+ 2 2"
cor~ cor1
As can be seen from the above equations, slow motions enter into the cross- correlation spectral density only if they are partly or totally uncorrelated. For the rigid-fragment case there is neither distribution nor time dependence of Oq v. The case of autocorrelation may be treated a s a special case of a rigid fragment with ~v = 0. Motions that are slower than the global tumbling of the molecule do not enter into the autocorrelation spectral densities [28]. Using the two-step model described above, the spectrat density for the autocorrelation case can be wfitten as
where
2 x i - - f 2 re § r f' 1
J~v(CO) = --~-I(S2.) 1 + co2r~ - 1 + coar~ J' (9)
(t¨ = (t¨ + (re)-' (10)
using the extended Lipari-Szabo order parameter (~f)2 (which we call -f 2 (S~.) to avoid ambiguities of notation) descfibing the fast dynamics of the rector u. This
Slow Motions by Cross-Correlated Relaxation 151 relates to our definition based on the two-step model for the correlation func- tion of the internal motions in the following manner:
(S¨ 2 = a(SSu) z + (1 - a)(S~u) z (11) with
a - rs ~ , (12)
u -- 91
where (Suu) 2 is the total autocorrelation order parameter including both slow and fast motions. Thus, the approach of Clore and coworkers [28] gives a higher estimate of the order parameter corresponding to fast fluctuations than our model. The cause of this discrepancy is that Clore et al. considered slow and fast mo- tions as two independent processes. However, the correction is very small, since a is close to unity for r~ << r~.
3 Results and Discussion
3.1 Autocorrelation
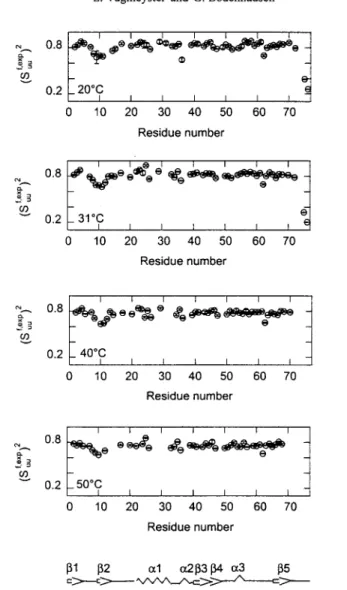
Figure 2 displays the generalized order parameters for fast intemal motions, which were obtained from R~, R 2, and heteronuclear 15N{XH} NOE data assuming axi- ally symmetric diffusion tensors. Table 1 shows the values of r c a n d ratios of
D,/Da of the components of the diffusion tensor at each temperature. The val- ues of Table 1 at 31.1 ~ agree well with the previously reported values for ubiquitin under similar conditions [32]. The values of (S[ª / do not vary strongly along the protein backbone with the exception of the C terminus. Residues that belong to the loop between the first two fl sheets and the beginning of the sec- ond fl sheet (T7, L8, T9, G10, K l l , T12) as well as I36 and Q62, which are also located in loop regions, tend to have lower values of (Sufª z.
The temperamre dependence of the autorelaxation rates can be characterized by the slopes of the plots of ln(1 - S J ª p) versus lnT.
S~u ) (13)
A = dln(1- f.ew
dlnT '
where T is the temperature. The parameter A is closely related to the character- istic temperature, 7-* = 3T/[2(1 -S~ª which has been used for similar pur- poses [14, 17, 19, 20]. Values of A > 1 imply that the potential energy function for the bond vector is not quadratic [16]. Values of A > 1 were observed for villin headpiece helical subdomain [16], B1 domain of streptococcal protein G [ 14], and ribonuclease H [ 17].
The parameters A were determined only for residues where data at all four temperatures could be obtained. Residues with errors in excess of 50% were dis- carded. The values of A are listed in Table 2. The large errors are the result of
152
0.8
0.2
G9 v
L. Vugmeyster and G. Bodenhausen
~20 I I I I I I I !
ol G i i I I I P /
0 10 20 30 40 50 60 70
Residue number
0.8
~'~,,,,~,, ~~~
O.2 I "~ I-- ";IOY t'~ I I I I I 1 "1 0 10 20 30 40 50 60 70 Residue number O.2 t- 40~ i , I I I I 0 10 20 30 40 50 60 70 Residue number i I I I I I ~ 0,2 I i i I I I 0 10 20 30 40 50 60 70 Residue number 131 132 (xl m2133 134 ct3 135 =~>----c~> ~,',,,',A...~,,.=~~ ---,~ = ~ - - - -
Fig. 2. Experimentally determined ~SN autocorrelated order parameters (S~~,cxP) 2 associated with fast motions of amide bonds in ubiquitin determined at four temperatures by the Lipari-Szabo procedure
explained in the text.
Table 1. Parameters characterizing anisotropic overall motion.
T (~ D , / D l rr (ns)
20.0 1.28+_0.04 4.74+_0.03
31.1 1.18_-+-0.04 3.81_+0.02
40.5 1.05+_0.06 3.43___0.02
Slow Motions by Cross-Correlated Relaxation Table 2. Values of A.
153
Residue A Error Residue A Error
I3 5+6 2.3 G47 2.8 0.8 T7 3.1 1.4 L50 5.8 1.4 G10 1.8 0.7 E51 4.4 1.7 V17 5.7 2.3 R54 3.0 1.8 T22 5.1 1.7 T55 4.9 2.3 V26 2.5 1.2 $57 6.5 2.3 E34 3.6 1.2 Y59 5.4 1.6 D39 4.4 1.8 N60 5.0 1.8 Q40 6.0 2.0 I61 6.1 3.2 Q41 7.6 2.1 Q62 1.6 0.7 L43 4.8 1.9 $65 5.9 1.8 I44 5.1 2.4 H68 4.0 1.9 F45 6.4 2.7
the fact that the majority of the residues had to be fitted with different motional models at the four temperatures. The temperamre dependence of the autocorrelation rates shows that A > 1 for all residues where it could be determined. The average value of A in Table 2 is 4.7 with a standard deviation of 1.5. This indicates that the potential function for the fast motions of the N - H N bonds is not quadratic, in agreement with data for other proteins.
3.2 Cross-correlation
To simplify the analysis o f the cross-correlation rates, the assumption o f iso- tropic overall tumbling was used [32-36], although Table 1 shows that the diffusion anisotropy can be as large as D+I/D ~ = 1.28___0.04 at 20 ~ It has been shown that the generalized L i p a r i - S z a b o order parameters for fast mo- tions obtained with axial or isotropic diffusion tensors ate very similar, pro- vided that the same motional models are used [32]. For the analysis o f the cross-correlation rates we used the fast generalized order parameters described in the previous section.
For the determination of NH/NH dipole-dipole cross-correlation rates, the DQ version o f the experiment described by Pelupessy and coworkers [10] was per- formed. This avoids the effects o f cross-relaxation involving the two amide pro- tons, in contrast to the experiments where both DQ and ZQ signals are recorded. The experiment is designed to detect the interconversion between (2N~N~) and (8N+H~N~H~) operators. The main mechanism of interconversion is due to cor- related fluctuations of the dipolar interactions NUH ~ and N~H ~ were u and v de- note adjacent residues. The rate is obtained from the ratio of the intensities I+ .... and Ir+f, which are proportional to the expectation values (8N+H~NYH~) and (2N+N.;) operators, respectively:
154 L. Vugmeyster and G. Bodenhausen
I ... (T) = tanh(R2PT)" (14)
Irof (T)
Hence, one can obtain experimental relaxation rates
Ru~p = ltanh-~ I ... (T). (15)
T I~f(T)
At 31 ~ there is good agreement with the rates previously reported for ubiquitin at 30 ~ [I0].
We assume that the slow motions are uncorrelated, which corresponds to the spectral density of Eq. (6). Even though on general grounds there is no reason to believe that slow motions are uncorrelated and axially symmetric for all residues in a protein, nevertheless we will use this simple assumption since it allows us to make an estimate of the order parameters of slow motions. We shall also discuss deviations from this assumption. From the relationship between the rates and the spectral densities (retaining only the main contribution at zero frequency, J(co = 0)) the theoretical rate is given by
Rt~r176 /'t0hTHTN J ( 0 ) = /~0hTH?'N/
S¨ S~S~uS~Pz(cosOª
(16)"" 4rcr3H ~ 4=r~H ) 3
where all symbols have their usual meaning. If there is neither fast nor slow local motion, i.e., if S¨ = Srw = Su~, = ~v = 1, the cross-correlated rate is
Runv gid = ( ]'/0hYHTN ) 2 2re (17)
~. 4Ÿ P2(c~ 5
This function is represented by curves in Fig. 3. The corretation times r c that were obtained at different temperatures are given in Table 1.
Pelupessy et al. [10] defined a "heuristic" order parameter:
s2(heur) = R ª xp (18)
uv Rª "
By contrast, we shall consider the ratio of experimentally determined parameters
~¨ = /~xp (19)
S2x~S~ex~ "
"exp
The values of R~~ are shown in Fig. 3. These can be compared with a ratio that follows from Eq. (16):
~theor
Rthfor _ (fl0hYHy N lZ , , ~q 2re~~ - S,,S f
~. 4Ÿ
') Su"Sv~P2(c~
5
(20)-exp ¡ (given
There is a number of residues that exhibit deviations of R~, from
R,v
Slow Motions by Cross-Correlated Relaxation 155 30 20 "T 1O ~QŸ 0 -10 20 -'" 1O x> -10 -20 20 E--- 10 r ~~ 0 -10 -20 O* 9'0 ~ 180 ~
Ouv
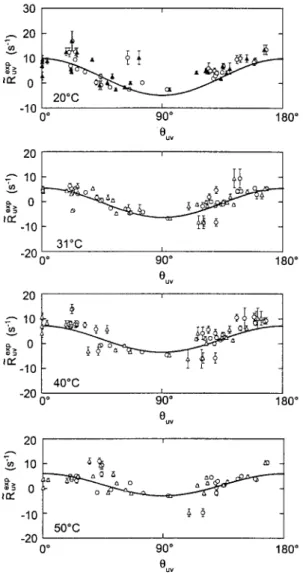
i 31~ O* 90 ~ 180" Ouv i 40~ 0 o 90 ~ euv 180 ~ 20 1 '~ 10~- 91162 ~ - -10 ]- 91 ~} / 50"C -20 ~ 0 ~ 90 ~ 180" OuvFig. 3. Ratios /~~xp of the cross-correlation rate R~ xp determined from the relaxation of double quan- tum coherences involving two ~SN nuclei in consecutive amino acids divided by the square root of the product of the fast autorelaxation order parameters shown in Fig. 2, as defined in Eq. (19). The rates /~Sxp are plotted versus 0,v at four temperatures. The angles O,v are taken either from the NMR
structure (O) or X-ray structure (Zk). The curves depict the function R~~ gid of Eq. (17).
where the protein is at least 99% in a folded conformation so that we m a y as- sume that it has the same structure at all temperatures. Both N M R and X-ray struc- tures were originally determined at 30 ~ [37, 38]. If the angles ~q are correctly given by the N M R structure, the deviations from the R, rgid curve are indicative o f the presence o f slow motions. These m o t i o n s must have at least partially un- correlated character, otherwise they would not be detectable, as shown above.
156 L. Vugmeyster and G. Bodenhausen
The results depend on whether NMR or X-ray structures have been used to determine
O,v.
The values of/~~ª tend to be lower when the X-ray structure is used.Clearly, both R~P and ~~~o~ depend on a structural factor embodied by the Le- gendre polynomial in Eq. (20). To separate this structural contribution, we define
o. 1,5-- 1.0 0.5" 0.0 I J_
~T
_L I 1O 20 I 30 I .1_ T -r_L z '1- 2~176 .J_ I I I I 40 50 60 70 Residue number 1.5 T ~- T T "I- 9 A i. I~o t~
~~ "T~'~
~~~~o~
0.5 0.0 0 10 20 30 40 50 60 70 Residue number 1.5-- 1.0 0.5- 0.0 0 T T ~ ~- - - I -L -L 9 T .~, - -Ir .L 2. 9 4 0 " C J_ • I I I I I I I 10 20 30 40 50 60 70 Residue number 1.5-- 1.0 ~JŸ 0.5- 0.0 i 0 10 T 9 A..u x2tlr
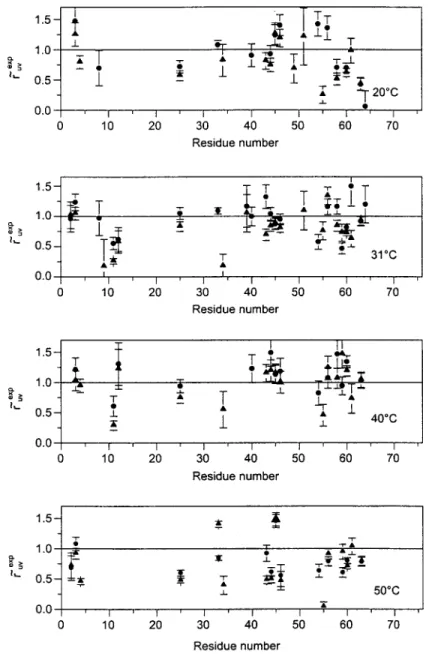
2 ~- - _t. 50~ i f I J I I i 20 30 40 50 60 70 Residue numberFig. 4. Plots of e~xp defined in Eq. (22) versus residue number at four temperatures with angles taken from either NMR structure (O) or X-ray structure (A).
Slow Motions by Cross-Correlated Relaxation 157
[ 4nr3N" )2
~~tu~eOr
~theor = 5
r"v
\/~0hrHrN
2r~ P:(cos~ q) =S~,S~,
(21) which is equal to 1 in the absence of slow motions. The angles 0ª can be taken either from NMR or X-ray structures [37, 38]. Likewise, one can normalize the experimentally determined ratios"~215 =( 4nr3"
) 2 5 /~u~XP (22)ruv
~/~0hr.r~ 2ro ~(cos~q)
Comparison of Eq. (21) and Eq. (22) shows that -~xp ruv can be interpreted a s a measure of slow internal motions
~~xp = S,~oxp S~v;OXp"
(23)These normalized experimental rates are plotted in Fig. 4. Residues for which there were no fast autocorrelation order parameters available for either u or v vectors had to be discarded from the analysis. The horizontal lines represent the case of r~v-~xP = 1, i.e., the absence of slow motions.
The expression for slow motions of Eq. (21) must obey the inequality
exp
0 < r, v-th~or < 1. When the experimental ratios r,v are not contained in the inter- val 0 < ru v-"xp < 1, this can be due to deviations from the assumptions of un- correlated axially symmetric motions and/or poor estimates of 0ª from either NMR or X-ray structures. Order parameters smaller than one indicate the pres- ence of slow motions. At 50.2 ~ there are many more residues that are below the horizontal line, which indicates that slow motions are more pronounced at this temperature.
4 Experimental
The experiments were performed on 15N/13C labeled human ubiquitin obtained commercially (VLI). The protein was dissotved in 200 gl of 90% H20-10% D20 to a concentration of 1.4 mM with phosphate buffer and the pH was adjusted to 4.5. A Shigemi tube made of susceptibility-matched glass was used.
4.1 Autocorrelation Data
The NMR autocorrelation rates were measured at 20.0, 31.1, 40.5 and 50.2 ~ on a Bruker DRX spectrometer operating at a Larmor frequency of 400.11 MHz, equipped with a triple resonance TBI probe with triple axes gradients. The sample temperature was calibrated using 100% methanol and 100% ethylene glycol stand- ards. I5N RI, R2, and heteronuclear NOE experiments were collected by previously described protocols [26, 39]. R 2 experiments used CPMG pulse trains with a spac-
158 L. Vugmeyster and G. Bodenhausen
ing of 1 ms and the States-TPPI quadrature detection scheme [40]. R 1 and NOE experiments used the sensitivity enhancement scheme [41, 42]. The experimental points were recorded for t = 0.01, 0.08, 1.3, 0.14, 1.17, 0.25, 1.0, 0.38, 0.70, 0.55, 0.85, 0.01 s for R t and t = 0.0086, 0.0172, 0.2414, 0.0345, 0.2069, 0.0604, 0.1811, 0.0948, 0.1724, 0.1207, 0.1466, 0.0172, 0.20692 s for R z. T h e NOE experiments
were obtained from pairs of spectra with and without proton saturation during the recycle delay. The saturation period was 4 s in the NOE and 5 s in non-NOE experiments. Each NOE experiment was repeated three times. 1024x100 complex points were cotlected with spectral widths of 13 and 25 ppm in the ~H and ~SN dimensions, respectively. The spectra were processed using NMRPipe software [43] with sc¡ available at www.palmer.hs.columbia.edu. A sinebell window function was used in both dimensions. Signal intensities were taken for nonoverlapping peaks only. R~ and Rz values were determined by nonlinear least-square fitting of the experimental data to a two-parameter monoexponential fit. Uncertainties were ob- tained using jack-knife simulations [44] for R~ and R 2 experiments. For the he- teronuclear NOE, the uncertainties were obtained from three measurements. R~ and R 2 data were used to obtain axially symmetric diffusion tensors at four tempera- tures. The C-terminal residues were not included in this analysis as well as the residues that do not lie within two standard deviations of the average values of
F = ((7"2) - T2)/(T2) - ( ( T t ) - Tt)/(Tt), where T 1 = 1/R 1 and T 2 = 1/R 2 [32]. The val-
ues of the diffusion tensors where used along with Rt, R2, and NOE data to ob- tain model-free Lipari-Szabo parameters. This was performed using ModelFree and Quadratic diffusion programs available at the web page indicated above. The se- lection of the motional model for each residue was done using the procedure de- scfibed by Mandel et al. [45]. Most residues were fitted with model 1 at 20 and 31.1 ~ and with model 2 at 40.5 and 50.2 ~ The following residues required model 3: N25, T55 at 20 ~ D52, G53 at 40.5 ~ A46, G53 at 50.2 ~ The following residues could not be fitted with any motional model: T12, I13 at 20 ~ T9, L15, K33, R72, G75, G76 at 40.5 ~ and K l l , N25, K29, D58, V70, G75, G76 at 50.2 ~
4 . 2 C r o s s - c o r r e l a t e d D a t a
The NMR cross-correlation rates were measured on a Bruker DMX spectrometer operating at 600.13 MHz and equipped with a triple resonance TBI probe with triple axes gradients. The measurements were perfomed at the same tempera- tures as the autocorrelation data. The double quantum dipole-dipole/dipole-di- pole NH/NH cross-correlated experiments were performed as described by Pelu- pessy et al. [10]. The experiments were performed with a single relaxation delay T = 43 ms. Two-dimensional spectra were acquired in an interleaved manner with 256 scans for the reference and 1024 for the cross-peak experiments at 20.0, 31.1 and 40.5 ~ At 50.2 ~ 256 and 1258 scans were used for the reference and cross-peak experiments, respectively. In addition, at 31.1 ~ the experiments were repeated with 256 and 718 scans for the reference and cross-peak experi- ments, respectively. The data reported for this temperature represent the average
Slow Motions by Cross-Correlated Relaxation 159 of the two data sets. The total acquisition time was 3.5-5 days at each tempera- ture. 512x50 complex points were collected with a spectral width of 14 and 25 ppm in the IH and ~SN dimensions, respectively. The data were processed using the NMRpipe program [43]. The signal intensities were obtained as peak heights using the nlinLS procedure of the NMRpipe package with Gaussian line shapes and peak half-widths constrained to 2 Hz in each dimension. The errors were obtained from the noise in the reference and cross-peak experiments using the error propagation method. The comparison of the two data sets at 31.1 ~ indi- cated that the experimental errors fell within the range obtained from the noise levels. The angles were taken from either NMR or X-ray structures [37, 38].
4.3 Statistical Analysis
4.3.1 Statistical Analysis of r,v-~~ Values
Because of the low sensitivity of the experiments, the data have large uncer- tainties. Below we present various statistical tests intended to check the signifi- cance of the data.
The values of ~~v ~p obtained at 50 ~ were compared to Y,~~P values obtained at 20, 31, and 40 ~
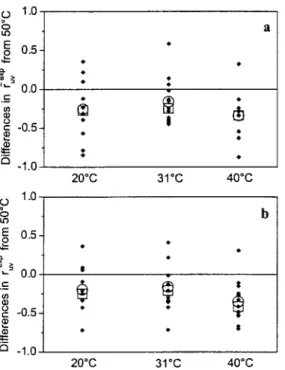
z x ; 2 . ( r ) = ; 3 P ( T = 50 ~ - ; 2 P ( T ) . (24) Data sets with angles obtained from NMR structure were analyzed separately from those that used X-ray angles. Paired statistical tests that analyze the differ- ences in Y~~P values ( f o r a given residue) between each set of pairs were per- formed. The goal was to see whether the data at 50 ~ ate significantly differ- ent from the data at the other temperatures. The distribution of the differences including the means and medians are shown in Fig. 5. The p values, i.e., the probabilities that the data are observed by chance, based on the null hypothesis that the mean or median differences are zero, are shown in Table 3. As all p values for both parametric t-test and nonparamet¡ Wilcoxon test are smaller than 0.05, we conclude that the mean and median of Arª are both significantly negative. Several statistical tests (one-way ANOVA test, Dunnett's test) showed that only
rª
= 50 ~ is significantly different from the others. The statisti- cal analysis clearly indicates that the order parameters for slow motions at 50 ~ are significantly lower than one.4.3.2 Exclusion of Outliers
The goal is to see whether the procedure of excluding outliers is legitimate. The values of 7~~P that were greater than 1.5, lower than zero, or had experimental errors greater than 0.5 were excluded from the analysis. The median value for each data set (four data sets for the X-ray angles and four for NMR angles) was compared to the median value for the data set with the outliers removed
160 L. Vugmeyster and G. Bodenhausen 1.0 ~ 0.5 • ,,2 0.0 '- -0.5 o -1.0 1.0 E~ t~ o E 0.5- ~',.-~ 0.0 C: =o -0.5 o _1.0 9 ! t 9 20"C 31"C 40"C @ 9 9 $ 20~ 31"C 40~ a exp
Fig. 5. Distributions of the A,~,v (T) values obtained at 20, 31, and 40 ~ f o r a given residue ob- tained using either the angles from the NMR structure (a) or X-ray structure (b). Means and medi-
ans of 91 are shown as O and n , respectively.
using a nonparametric Mann-Whitney test. The p values ranged from 0.3 to 0.9. This test allows one to reject the hypothesis that the exclusion of the outliers introduced a bias into median values for each of the eight data sets tested.
4.3.3 Paired Tests
Analyses were performed on the data sets with the outliers removed. The values of AFª were compared for T = 20, 31, and 40 ~ Data sets with angles ob-
cxp o
Table 3. Thep values from the statistical analysis ofF~~ values obtained at 50 C relative to F~~P obtained at comparison temperatures and calculated either for angles obtained from NMR or X-ray structures. Test Value ofp for difference off,v at 50 C from that at: exp o
20 ~ 31 ~ 40 ~
NMR X-ray NMR X-ray NMR X-ray
t-Test 0.036 0.025 0.037 0.040 0.008 0.0002
Slow Motions by Cross-Correlated Relaxation 161 tained from the NMR structure were analyzed separately from those that used X-ray angles. Prism4 statistical software was used (www.graphpad.com/prisrn/Prism.htm). Two statistical tests were performed. A one-sided paired t-test calculates the differ- ence between each set of pairs and analyzes the list of differences based on the assumption that the differences in the entire population follow a Gaussian distribu- tion. Note that while the assumption of the normal dist¡ for the
ruv~eXp
values themselves is not valid, it is reasonable to assume the normal distribution for the Af~Xp(T) values. This test compares the means of two populations. The one-sided test is appropriate since we expect the mean at 50 ~ to be the same or lower and the differences to be equal or less than zero. The reason for this is that we are testing the hypothesis whether or not slow motions are more pronounced at higher temperatures. The p value answers the question: ir the change in tempera- ture really had no effect, what is the chance that a random sampling would result in an average effect as far from zero (or lower) as observed in this experiment? A nonparametric Wilcoxon test calculates the difference between each set of pairs and analyzes that list of differences, without invoking any assumptions on the distribu- tional properties of these differences. The paired Wilcoxon test ranks the absolute values of the differences between the paired data in two samples and calculates statistics on the number of negative and positive differences. This test compares the medians of two populations. The p value answers the question: if the median of the differences taken in the entire population is zero, what is the chance that a random sampling would result in a median as lar from zero (or lower) as observed in this experiment?4.3.40ne-Way ANOVA and Dunnett's Test
The distributions of the differences A~ª obtained with T = 20, 31, 40 ~ were analyzed by a one-way ANOVA test using JMP software (www.jmp.com0. The one-way ANOVA test compares the means of three or more groups, assum- ing that data are sampled from Gaussian populations. The overall p value an- swers the question: if the populations really have the same mean, what is the chance that a random sampling would result in means at least as far apart from
- - c x p
one another as one observes in this experiment? The distribution of Aruv (T) values obtained with T = 20, 31, 40 ~ were compared.
Dunnett's test, which is a modification of the t-test, accounts for multiple com- parisons, as well as for the fact that the comparisons are interrelated. Dunnett's test compares groups relative to a chosen control group. For this analysis,
Arª
values for T = 40 ~ were used as control group.5 Conclusions
We investigated the temperature dependence of NMR relaxation rates for back- bone ~SN-~H interactions in
ISN/13C
labeled human ubiquitin in the temperature range of 20-50 ~ The ~SN autorelaxation data give evidence that the potential162 L. Vugmeyster and G. Bodenhausen
energy functions for the N - H N bonds are not quadratic, in agreement with re- sults for other proteins. Cross-correlation rates arising from correlated fluctua- tions of two N - H N dipole-dipole interactions involving successive residues were obtained at four temperatures. The theory of spectral densities was reviewed for independent axially symmetric fast internal motions combined with internal mo- tions that are slower than the overall global tumbling of the molecule. The cross- correlated rates were analyzed using the assumption of uncorrelated axially sym- metric fluctuations for the slow motions. The results suggest the presence of slow internat motions at 50 ~ Deviations from the assumptions of uncorrelated and axially symmetric slow internal motions are discussed, as well as the use of NMR or X-ray structures for the determination of the angles between various interac- tions that enter into the spectral densities. More sensitive cross-correlation ex- periments could provide useful constraints on the form of the potentials of cor- retated fluctuations.
Acknowledgements
We are grateful to Sapna Ravindranathan for help with the cross-correlation experiments and to Daniel Abergel for helpful discussions. This work has been supported by the Centre National de la Recherche Scientifique of France and the Fonds National de la Recherche Scientifique of Switzerland.
Referenr
1. Palmer A.G.: Annu. Rev. Biophys. Biomol. Struct. 30, 129-155 (2001) 2. lshima R., Torchia D.A.: Nat. Struct. Biol. 7, 740-743 (2000) 3. Palmer A.G., McDermott A.J.: Phys. Chem. 199, 13293-13310 (1996)
4. Daragan V.A., Mayo K.H.: Prog. Nucl. Magn. Reson. Spectrosc. 32, 63105 (1997) 5. Frueh D.: Prog. Nucl. Magn. Reson. Spectrosc. 41, 305-324 (2003)
6. Brutscher B.: Concepts Magn. Reson. 12, 207-234 (2000)
7. Daragan V.A., Mayo K.H.: J. Magn. Reson. 100, 8378-8388 (1996) 8. Daragan V.A., Mayo K.H.: J. Phys. Chem. B 103, 6829-6834 (1999) 9. Felli I.C., Desvaux H., Bodenhausen G.: J. Biomol. NMR 12, 509-521 (1998) 10. Pelupessy P., Ravindranathan S., Bodenhausen G.: J. Biomol. NMR 25, 265-280 (2003) 11. Jaenicke R.: Proc. Natl. Acad. Sci. USA 96, 13674-13678 (1999)
12. Detschman W.A., Dahlquist F.W.: Biochemistry 40, 13107-13113 (2001)
13. Bracken C., Can- P.A., Cavanagh J., Palmer A.G.: J. Mol. Biol. 285, 2133-2146 (1999) 14. Seewald M.J., Pichumani K., Stowell C., Tibbals B.V., Regan L., Stone M.J.: Protein Sci. 9, 1177-
1193 (2000)
15. Ornuchin J.N., Luthey-Schulten Z., Wolyness P.G.: Annu. Rev. Phys. Chem. 48, 545-600 (1997) 16. Vugmeyster L., Trott O., McKnight C.J., Raleigh D.P., Palmer A.G.: J. Mol. Biol. 320, 841-854
(2002)
17. Mandel A.M., Akke M., Palmer A.G.: Biochemistry 35, 16009-16023 (1996) 18. Cordier F., Grzesiek S.: J. Mol. Biol. 715, 739-752 (2002)
19. Yang D., Kay L.E.: J. Mol. Biol. 263, 369-382 (1996)
20. Yang D., Mok Y.K., Forman-Kay J.D., Fan.ow N.A., Kay L.E.: J. Mol. Biol. 272, 790-804 (1996) 21. Idiyatulin D., Nesmelova I., Daragan V.A., Mayo K.H.: J. Mol. Biol. 325, 149-162 (2003) 22. Evenas J., Forseen S., Malmendal A., Akke M.: J. Mol. Biol. 289, 603-617 (1999) 23. Akke M., Bruschweiler R., Palmer A.G.: J. Aro. Chem. Soc. 115, 9832-9833 (1993)
Slow Motions by Cross-Correlated Relaxation 163 24. Wang T., Cai S., Zuiderweg E.R.P.: J. Am. Chem. Soc. 125, 8639-8643 (2003)
25. Krizova H., Zidek L., Stone M.J., Novotny M.V., Sklenar V.: J. Biomol. NMR 28, 369-384 (2004) 26. Farrow N.A., Muhandiram R., Singer A.U., Kay C.M., Gish G., Shoelson S.E., Pawson T., Forman-
Kay J.D., Kay L.E.: Biochemistry 33, 5984-6003 (1994) 27. Lipari G., Szabo A.J.: J. Aro. Chem. Soc. 104, 4546-4559 (1982)
28. Clore M.G., Szabo A., Bax A., Kay L.E., Driscoll P.C., Gronenborn A.M.: J. Am. Chem. Soc. 112, 4989--4991 (1990)
29. Wist J., Frueh D., Tolman J.R., Bodenhausen G.: J. Biomol. NMR 28, 263-272 (2004) 30. Wintrode P.L., Makhatadze G.I., Privalov P.L.: Proteins 18, 246-253 (1994)
31. Vugmeyster L., Pelupessy P., Vugmeister B.E., Abergel D., Bodenhausen G.: C. R. Phys. 5, 377- 386 (2004)
32. Tjandra N., Feller S.E., Pastor R.W., Bax A.: J. Am. Chem. Soc. 117, 12562-12566 (1995) 33. Fushman D., Tjandra N., Cowburn D.: J. Ana. Chem. Soc. 121, 8577-8582 (1999) 34. Lee A.L., Wand A.J.: J. Biomol. NMR 13, 101-112 (1999)
35. Lee L.K., Rance M., Chazin W.J., Palmer A.G.: J. Biomol. NMR 9, 287-298 (1997)
36. Peti W., Meller J., Bruschweiler R., Griesinger C.: J. Am. Chem. Soc. 124, 5822-5833 (2002) 37. Vijay-Kumar S., Bugg C.E., Cook C.J.: J. Mol. Biol. 194, 531-534 (1987)
38. Cornilescu G., Marquardt J.L., Ottiger M., Bax A.: J. Am. Chem. Soc. 120, 6836-6837 (1998) 39. Kroenke C.D., Rance M., Palmer A.G.: J. Am. Chem. Soc. 121, 10119-10125 (1999) 40. Marion D., Ikura M., Tschudin T., Bax A.: J. Magn. Reson. 48, 286-292 (1989) 41. Cavanagh J., Palmer A.G., Wright P.E., Rance M.: J. Magn. Reson. 91, 429--436 (1991) 42. Kay L.E., Keifer P., Saarinen T.: J. Am. Chem. Soc. 114, 10663-10665 (1992)
43. Delaglio F., Grzesiek S., Vuister G.W., Zhu G., Pfeifer J., Bax A.: J. Biomol. NMR 6, 277-293 (1995)
44. Mosteller F., Tukey J.W.: Data Analysis and Regression: A Second Course in Statistics. Read- ing: Addison-Wesley 1977.
45. Mandel A.M., Akke M., Palmer A.G.: J. Mol. Biol. 246, 144-163 (1995)
Authors' address: Geoffrey Bodenhausen, D› de Chimie, Associ› au CNRS, Ecole Normale Sup› 24 rue Lhomond, 75231 Paris cedex 05, France