CHARACTERIZATION AND MODELING OF STRESS EVOLUTION DURING
NICKEL SILICIDES FORMATION
K. P. LIEW1, Y. LI2, M. YEADON3, R. BERNSTEIN4, C. V. THOMPSON4 1Singapore-MIT Alliance, Advanced Materials for Micro- and Nano- Systems
2 Department of Materials Science, National University of Singapore 3 Institute of Materials Research and Engineering, National University of Singapore 4 Department of Materials Science and Engineering, Massachusetts Institute of Technology
ABSTRACT
An curvature measurement technique was used to characterize the stress evolution during reaction of a Ni film and a silicon substrate to form nickel silicide. Stress changes were measured at each stage of the silicide growth. When the nickel films were subjected to long-time isothermal annealing, stresses that developed during silicide formation gradually relaxed. Fitting the experimental results with a kinetic model provides insight into the volumetric strain and relaxation behavior of the reacting film and the reaction product.
1. INTRODUCTION
The stresses observed during silicide formation show an overall trend of compressive stress [1]. All formation of refractory metal silicides causes compressive intrinsic stress. For transition metal silicides, some literatures [2-4] show that the formation of Pd2Si, Pt2Si, Co2Si
and CoSi2 causes compressive stress, while there
are some contradicting reports [5-6] showing that the formation of Ni2Si, Co2Si and Pt2Si causes
tensile stress. The reason for this inconsistency is not fully understood though it is commonly attributed to the different experimental conditions. Thus, more experiments are needed for each material system to confirm the type of stress generated by the reactions. The experimental system used in this study is the binary Ni and Si system. Koos et. al. [5] conducted the earliest experiment on the silicides of evaporated nickel films. Tensile stress was observed by Koos et. al. during the formation of Ni2Si. This was opposite to the compressive
stress observed by Tsai et. al. [9] during the formation of Ni2Si.
A model for the stress evolution during the formation of silicides was also developed. Zhang and d’Heurle [7] proposed a model that took into account the simultaneous stress formation due to the reaction and the relaxation of stresses. The model also included an important parameter, which was the stress induced by the reaction at
the instant of reaction, which would help in understanding the origin of stress generated during the reaction. The model provided a satisfying qualitative picture of stress evolution during the formation of Pd2Si and TiSi2. No
work was done to compare the stress changes during nickel silicides formation and the model before. Buad et. al. [8] tested his experimental data for Pd/Si system with the model. However, the intrinsic stress at the instant of silicide formation was not reported in his paper.
In the present work, stress development and relaxation during the formation nickel silicides was studied using the curvature measurement technique. The experimental data was fitted with the Zhang and d’Heurle’s model.
2. EXPERIMENTS
The nickel film was deposited on HF cleaned Si (100) substrate using magnetron sputtering at the vacuum level of 5x10⁻⁷ torr.
Sputtered sample was then annealed in-situ in FSM thin film stress gauge in which curvature changes during reaction was measured. The annealing ambient was forming gas consisting of 96% N2 and 4% H2. The force per unit width
(F/W) in the film could be calculated from the measured curvature changes using the Stoney equation [10]:
(
o)
s s f ft E t K K W F − − = = 2 ) 1 ( 6 ν σwhere σf is the stress in the film, tf is the film
thickness, F is the force in the film, W is the width of the sample, Es is the Young’s modulus
of the substrate, νs is the poisson ratio of the
substrate, ts is the substrate thickness, K is the
measured curvature, and Ko is the initial
curvature.
The first experiment involved annealing the sample at a constant heating rate of 5oC/min
-40 -20 0 20 40 60 0 200 400 600 temp (oC) F/W (N/m) 1st heating 2nd heating
experiment, the sample was annealed isothermally at temperature ranging from 230oC
to 250oC for 4 hours. After the stress
measurement, the samples were analyzed using XRD, SEM and TEM to identify phases and structural changes in the film.
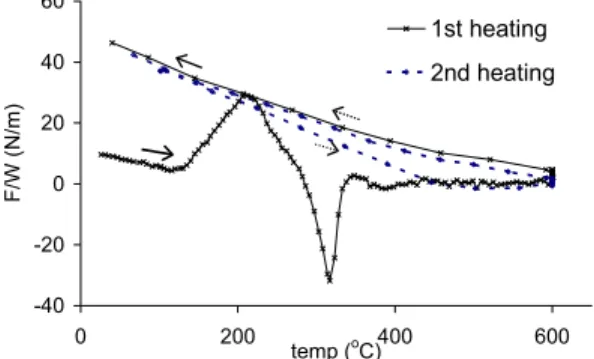
Figure 1 Plot of the total force per unit width verse temperature for 30 nm Ni/Si annealed at 5oC/min to 600oC
3. RESULTS AND DISCUSSIONS (A) Characterization of total force per unit width changes during silicidation process
Fig. 1 shows the changes in F/W in nickel film on Si as a function of temperature during the heating cycle with a constant ramping rate. The curve for the first heating cycle shows a maxima at 210oC and two minimas at 317oC and
388oC respectively. The results agree with the
result Tsai et. al. reported [9]. The two minimas were proven to be related to the formation of Ni2Si and NiSi at 317oC and 388oC respectively.
Tsai et. al. [9] also reported that no nickel silicide was formed after the film was heated to 234oC. Thus the first maxima can only be attributed to morphological changes in nickel film. From the literature, Knauth et. al. [11] reported that nickel film experienced grain growth after being annealed at the temperature range between 150-300oC. In the present work,
four point probe measurement showed a drop in sheet resistance of the film from 11.6 to 9 mohmcm after being annealed from room temperature to 200oC. It is known that the grain
growth in thin film will give a drop in the sheet resistance of the film [12]. Therefore, the initial increment of tensile stress should be due to grain growth in nickel film.
During the second heating cycle, the forces in the film changed linearly with increasing temperature. The features observed in the curve for first heating cycle were absent, indicating that the film had fully transformed into NiSi, as shown by Tsai et. al.
To understand the origin of the force changes in the film, we need to look at the volume changes caused by the reaction, which the literature [1] had extensively discussed. In Table 1, the volume changes during the formation of Ni2Si are listed. Two sets of
numbers are presented in this table. The first of these is the fraction of the final volume to the initial volume of the reactants (nickel plus silicon), which shows a considerable reduction. The second number shows the relative volume expansion undergone by silicon upon alloying with nickel to form Ni2Si. This volume change is
quite huge and can be used to explain the compressive stress caused by Ni2Si formation.
The analysis for the formation of NiSi is more complicated as two reaction interfaces are involved. Firstly, one Ni is released from Ni2Si,
which causes 35% volume decrease in the Ni2Si
layer. Following that, the released Ni atom would diffuse into Si to form NiSi, which causes 11% volume increment at the NiSi/Si interface. The net result of these two steps would lead to an increase in free volume in the Ni2Si and in turn
should generate a tensile stress. However, this is in contradiction with what is shown in Fig. 1. This result shows that the current understanding on the volumetric changes that causes stresses at reaction interface is not sufficient in explaining reaction that involves multi-interface. Relaxation process at different interface may need to be taken into account.
Table 1 Volume changes during the formation of Ni2Si Molar volume of reactants Volume fraction of reaction product to reactants Ni Si Ni2Si/
(Ni+Si) Ni(Si)2Si/
-40 -20 0 20 40 0 50 100 150 200 time (min) F/W (N/m) 230 250 240
Figure 2 Plot of total force per unit width verse time for 30 nm Ni/Si annealed at 230-250oC for
240 min
Figure 3 XRD spectrum of nickel film annealed at 250oC for 240 min
Fig. 2 shows the force changes during the formation of Ni2Si while 30 nm sputtered nickel
film on Si (100) substrate was heated isothermally at 230oC, 240oC and 250oC.
Compressive stress in the film increased at the beginning of the isothermal hold. After 20-50 minutes of annealing, the value of the compressive stress relaxed.
Fig. 3 shows the XRD spectrum for the film after annealing for 240 minutes at 230oC. The
spectrum showed that nickel and Ni2Si were the
only two phases in the film after the annealing. The morphology of the film after the annealing was investigated using SEM and TEM. Fig. 4 shows SEM micrograph of the sample annealed at 230oC. Discontinuities appeared on the films
after extensive annealing. The cross section of the sample observed using TEM (as shown in
Fig. 5) showed that two phases coexisted after the nickel film was annealed at 230oC for
240minutes. The upper layer was un-reacted nickel while the bottom layer was Ni2Si. The
un-reacted nickel film became discontinuous after being annealed for 240 minutes. The discontinuities could be a result of agglomeration of the un-reacted nickel film. The nickel film could agglomerate, as it became thinner while reaction proceeded. As the nickel film became discontinuous, the stress in the nickel film could be negligible. The forces change observed in Fig.1 could be predominated by the forces induced by the formation of Ni2Si.
Figure 4 SEM image for 30 nm nickel film annealed at 230oC for 240 min
Figure 5 TEM micrograph for nickel film annealed at 230oC for 240 min
Si
Ni2Si
Ni
1.E+03 1.E+04 1.E+05 40 42 44 46 48 50 2 thetaintensity (a. u.)
Ni (111) Ni2Si (013)
Ni2Si (020)
0 50 100 150 200 250 -30 -20 -10 0 10 20 30 F (exp) Fs Fm Fm+Fs F/ W (N/ m ) time (min)
(B) Modeling the stress evolution during the reaction
Result shown in Fig. 2 was fitted with Zhang and d’Heurle’s model. Major assumptions in the model are as follow:
(1) stress builds up through layer silicide growth,
(2) stress relaxes in growing silicide layer through Coble creep
In this model, two forces are considered. They are forces due to compound formation, Fs and
forces in the un-reacted film film, Fm. The total
forces measured during silicidation, F is the sum of these two. These two forces are briefly explained as follow:
(i) Forces due to compound formation, Fs:
The silicide is divided into n sublayers of thickness ∆l, each with an instantaneous stress σis. σis is equal to the intrinsic stress induced by
the reaction, σin subtracted by the relaxed stress,
σrel. The overall force in the growing layer, Fs at
any time t is the sum of forces over all layers, as given by the following expression. By assuming coble creep, and diffusion controlled growth, Fs
is given by the following expression:
− =
∫
τ τ σ dl t k l t F t l in s ' exp ' exp ) ( ) ( 0 2 (1)where k is the parabolic constant and τ is the relaxation time for the silicide.
(ii) Forces in the un-reacted film, Fm:
As the reaction proceeds, forces in the remaining un-reacted film will decrease not only as a function of its specific relaxation but also the decreasing film thickness. At zero time, when the reaction just begins, the metal film is under a uniform stress, σm. The force in the film will be
equal to σmβlo. Here β is the ratio of the metal
thickness to the corresponding silicide thickness, βlo is the initial thickness of the metal film. At
the temperature of reaction the stress in the metal film relaxes with a relaxation time τm. The force
in the film decreases as a function of the film consumption rate as well. Combining these two effects, Fm is given by
[
(
)
1/2]
exp
t
l
kt
F
o m m m
−
−
=
β
τ
σ
(2)Finally, the total force developed during the silicidation process is given by this expression:
m
s F
F
F = + (3)
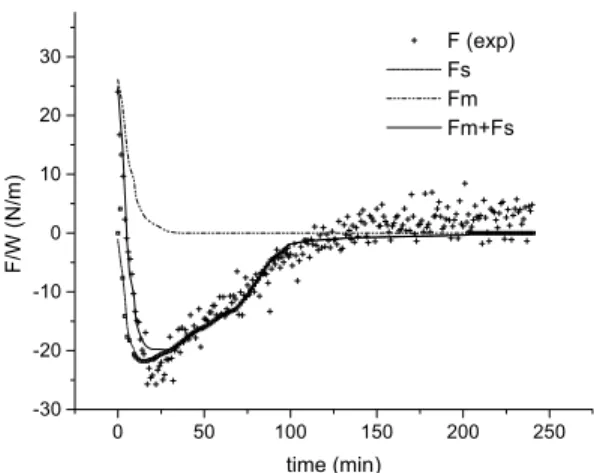
Figure 6 shows the fitting curves for nickel film annealed at 250oC. It illustrates how the
force in the unreacted metal films, Fm and the
force in the silicide Fs evolve during the
annealing cycle.
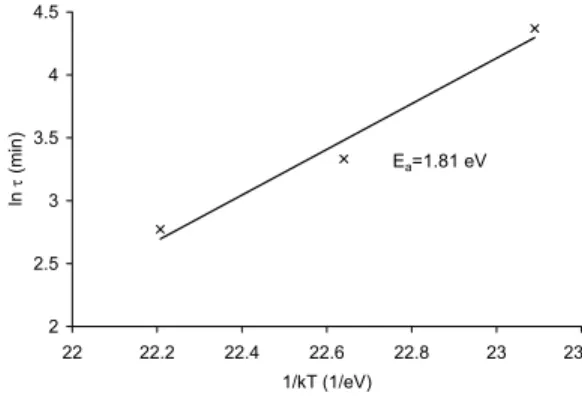
Data obtained from the fitting of the experimental result with the model is shown in Table 2. Relaxation time, τ of Ni2Si is found to
follow the Arrhenius behaviour. Activation energy calculated from this data is 1.81±0.29 eV (shown in Figure 7). This is close to the activation energy for Ni diffusion through Ni2Si
(1.71eV) [13]. Hence Ni diffusion could be the limiting phenomenon controlling the relaxation of this compound. This verifies the assumption of Coble creep in this model.
Figure 6 Force changes (experimental and theoretical) in nickel film (30 nm) annealed at 250oC for 240 min.
Table 2 Curve fitting result for 30 nm nickel film annealed at different temperatures
Temperature
(oC) σ(GPa)in τ(min)
230 -2.86 79
240 -1.5 28
From Table 2, we also find the compressive stress caused by the reaction, σin to be 2.1±0.54 GPa. The stress changes in the plane of the film is related to the volumetric strain in the film by this equation: 3 ) 1 ( ∆ − − = ∆ γ σ E
where ∆ is the volumetric strain, E/(1-γ) is the biaxial modulus of Ni2Si. Taking E of Ni2Si from
the literature as 161 GPa and assuming that γ is 0.33, when the stress is 2.1GPa, the volumetric strain is 1.29%. This value is much smaller than 62% as shown in Table 1. Such a large difference shows that the current way of estimating the volumetric strain caused by reaction is not correct, or it is also possible that there is a huge stress generated before it can be measured by the current experimental method.
Figure 7 Arrhenius plot of relaxation time, τ of Ni2Si
4. CONCLUSIONS
Formation of Ni2Si causes a compressive
intrinsic stress. This agrees with the expectation of a volumetric expansion at the Ni2Si/Si
interface. Forces caused by the formation of NiSi are difficult to understand due to the presence of two reaction interfaces. The force changes during the formation of Ni2Si were well fit using a
model proposed by Zhang and d’Heurle. The relaxation data obtained from the fitting data
indicates an activation energy close to the activation for the diffusion of nickel through Ni2Si. Thus, Coble creep is a plausible
mechanism controlling the relaxation of stresses developed during the formation of Ni2Si. The
volumetric strain caused by the reaction calculated from the fitting result is very low compared to the molar volume change during the reaction. The reason for this is not yet understood.
REFERENCE
1. F. M. d’Heurle, O. Thomas, Defect and Diffusion Forum, v 129-130, 137-150 (1996)
2. S. Yanagisawa, T. Fukuyama, J. Electrochem. Soc, 127, 1150 (1980)
3. J. T. Pan, I. Blech, J. Appl. Phys. 55, 2874 (1984)
4. V. Svilan, J. M. E. Harper, C. Cabral, L. Clevenger, Mater. Res. Soc. Symp. Proc., 356, 167 (1995)
5. V. Koos, U. Beck, H. G. Neumann, Phys. Stat. Sol. (a) 37, 194 (1976)
6. J. Angilello, J. E. Baglin, F. M. d’Heurle, C. S. Petersson, A. Segmüller, in Thin Film Interfaces and interactions, edited by J. E. Baglin, J. Poate (The Electrochemical Society, Pennington, NJ, 1980) p369 7. S.L. Zhang, F.M. d’Heurle, Thin Solid Films
213, 34-39 (1992)
8. P. P. Buad, F. M. d’Heurle, S. Chevacharoenkul, E. A. Irene, J. Vac, Sci. Technol, B 11 (2), 304-310 (1993)
9. C. J. Tsai, K. H. Yu, Thin Solid Films 350, 91-95 (1999)
10. R. W. Hoffman, in G. Hass, R. E. Thun (Eds.), Physics of Thin Films, vol 3, Academic Press, New York, 1966, p. 211. 11. P. Knauth, A. Charai, P. Gas, Grain Growth,
28 (3), 325-330 (1992)
12. P. S. Lee, D. Mangelinck, K. L. Pey, J. Ding, J. Y. Dai, C. S. Ho, A. See, Microelectronic Engineering, 51-52, 583-594 (2000)
13. P. Gas, F. M. d’Heurle, Mater. Res. Soc. Symp. Proc., 402, 39-49 (1996) 2 2.5 3 3.5 4 4.5 22 22.2 22.4 22.6 22.8 23 23.2 1/kT (1/eV) ln τ (min) Ea=1.81 eV