LIBRARY OF THE
MASSACHUSETTS INSTITUTE OF
TECHNOLOGY
CHARACTERISTICS OF OWNERS OF THRIFT DEPOSITS IN
COMMERCIAL BANKS AND SAVINGS & LOAN ASSOCIATIONS
67 -64
Henry J. Claycamp
July 1964
MASS. INST. TECH.
OCT
30
1964i
Characteristics of
Owners
of Thrift Depositsin
Commercial Banks
and Savings& Loan
Associations1 .
INTRODUCTION
Commercial banks
and savings and loan associations offer quite similarproducts to
consumers
seeking a safe, liquid, yield bearingmeans
of holding sav-ings. Both institutions offer safety of principal (nearly allcommercial
banks
and savings and loan associationsnow
have
federal deposit insurance),comparable
liquidity, and convenient
means
of depositing large or small amounts; yet therehave been
marked
shifts in the relative importance of thetwo
institutions asrepositories for
consumer
thrift funds.The recent spectacular growth of savings and loan associations and the decline in the relative importance of
commercial banks
as repositories forthrift funds has prompted major studies of the strengths and
weaknesses
of9
the
two
institutions. Results of these studies indicate thatcommercial banks
are at a competitive disadvantage
because
ofsome
of theirown
operatingcon-ventions and certain policies of regulatory bodies. In addition,
some
of thestudies suggest that aggressive marketing on the part of savings and loan associ-ations and important
changes
inconsumer
preferences and perceptionshave
been
instrumental factors in the shift of importance of the
two
institutions.However,
executives ofcommercial banks
and savings and loan associationsinterested in improving the efficiency of their marketing activities, as well as individuals interested in the impact of the form and
amount
ofconsumer
savings on purchasing behaviorneed
more information on a disaggregative level about the
-2-customers
of thetwo
institutions. Forexample,
it is important toknow
if thecus-tomers of the
two
institutionscome
from similar or dissimilarconsumer
groups.If they
have
unique characteristics, fluctuations ineconomic
conditions are likely tohave
differential effects on the flows of funds to the institutions. In addition, ascertainable distinct characteristics should lead tomore
precise definitions of marketsegments
and more efficient allocation of marketing effort by the institu-tions.On
the other hand, since the assets are almost perfect substitutes, it is possible that thecustomers
of thetwo
institutions are indistinguishable in terms of standardsocio-economic
variablesand
the assets areused
to fulfill similar roles in the portfolios of thetwo
groups.However, even
this conditiondoes
not preclude the possibility that significant differences exist in along important psychological dimensions. For
example,
both institutions have attempted todif-ferentiate their
images
and, as a result, important differencesmay
exist incus-tomers' personality needs, motives for saving, and expectations of
economic
con-ditions.
Knowledge
of these differences, if they can be ascertained, should provide important insights into the factors that affect choice of financial intermediaries andhave
a significant impact on the promotional policies of the institutions.In addition,disaggregative data direct from
consumers
will provide information aboutconsumers
who
hold both SLA's and CBA's. This group is particularly interest-ing since there is an opportunity cost equal to the differential in interest rates on the funds held inCBA's
andpresumably
there issome added
inconvenience to hold-ing funds in both institutions. Itwould
be important toknow
if these individuals
-3-allocate their funds equally to
CBA's
and SLA's, and if they concentrate proportion-ately more or less of their total funds to these institutions.This kind of data
can
also beused
to determine the relative effectiveness of the two institutions in exploiting the potential offered by their present customers.1 . 1 Objectives
This paper is an attempt to provide information
which
can beused
to testhypotheses
andanswer
questions such as those listed above. In particular, theobjectives are:
1) to provide
new
information about the role savings accounts in com-mercialbanks
and savings and loan associations play in the portfoliosof the following three
consumers
groups:a)
Group
C
- thosewho
hold thrift deposits incommercial
banks
but not in savings and loan associations, b)Group
S-those
who
hold thrift deposits in savings and loan associa-tions and not incommercial
banks, and c)Group
B - thosewho
hold thrift deposits in bothcommercial banks
and sav-ings and loan associations.2) to identify characteristics
which
discriminatebetween Groups
C, S, and B, anddraw
inferences relevant to the marketing policies of the respective institutions.3) to determine the relative importance of different types of variables as discriminators
between
the three groups ofconsumers.
1 .2
Design
of the Investigation1.2.1 The
Sample
-4-were
known
to hold eitherCBAs
or SLAs)was
one of several panelsdrawn
from largemidwestern
metropolitan areas in the study ofconsumer
savings carried on4 by the
Consumer
Savings Project.As
a part of theConsumer
Savings Project, informationwas
collected on a largenumber
of variables, ranging from standardsocio-economic
variables toamounts
held in specific assets and scores on psychological tests.The data
used
in this studywere
taken from the third re-interview of the panel, approximately ninemonths
after the initial contact. Corrections for inconsistencies in reporting during the ninemonth
period and for discrepanciesbetween
theamount
reported for a given holding and the actual
amount
according to the institution's recordswere
made
beforeany
analysiswas
undertaken.These
correctionsmean
that the data are likely to be more accurate than that obtained in
most
surveys. In particular,amounts
reported for specific assets are far less likely to be biased by under- and non-reporting than are reports of financial holdings derived frommost
surveys.1.2.2
Methodology
The first step in the analysis
was
classification ofeach
savings unit in the sample into one of three mutually exclusive groups -Group C, Group
S andGroup
B.In the analysis of the role of the specific asset in the portfolio of the
SU
,com-parisons
were
made
of themean
dollar holdings inCBAs
andSLAs
and of concentra-tion ratios ineach
of the respective assets. The concentration ratiowas
computed
5
as the ratio of the
amount
held in the specific asset to the total discretionary assets of the savings unit.
-5-In the analysis of the importance of specific variables in discriminating
between
the three groups,comparisons
between
themeans
ofeach
of the threegroups
were
firstmade
on a univariate basis, then all variableswere
included in a multivariatetwo-way
discriminate analysis.The discriminate analysis
was
performed in a step-wise fashion. That is, ina given run the program took all included variables into account in the first step
and
computed
the contribution ofeach
of the variables to the totalsum
of thesquares accounted for by the discriminant function.
Then
the variable contribu-ting the least to thesums
of squareswas
automatically deleted and the coeffi-cients recomputed. This process, including the analysis of variance,was
repeated until only one variable remained.
In order to
compare
the relative importance of certain classes of variables in discriminatingbetween
the three groups, all variableswere
classified inthree categories - socio-economic, asset, and psychological variables.
Socio-economic
variables included the age, education, and occupation of themain
wage
earner in the SU; the
SU's
gross 1959income
and total discretionary assets held at the date of the interview - spring, 1960.Asset
balances included theSU's
holdings in checking accounts,government
bonds, annuities, loans lent, stock, bonds, equity in real estate other than the place of residence, and equity in
businesses
operated by theSU
.
Psychological variables included
were
needs, asmeasured
by theEdwards
7
Personal Preference Schedule ; motives for saving; and expectations. The
needs
included were:
N-achievement,
N-deference,N-autonomy,
N-affiliation,
-6-and N-heterosexuality.
Motives
included were:M-old
age,M-education
ofchildren,
M-payment
of debts,M-purchase,
andM-emergency.
Expectationsincluded
were
X-prosperity during the next five years, X-recession during nextfive years, X-price level to increase during next five years, X-price level to remain constant during next five years.
1.2.3 Limitations
Obvious
limitations of the investigation are related to the nature of thesample. The sample
was
taken from:one point in time - early 1960,
one geographic region - the
midwest
United States,households
in a large metropolitan area,and
households
who
areknown
holders ofCBAs
or SLAs.Perhaps the
most
important limitation relates to the possible effect ofpromo-tion
done
prior to the study but not explicitly taken into account here. That is,the results found at this point in time
may
be in partcaused
by prior promotion. Thus, the variableswhich
distinguishbetween
the groupsmay
nothave
generality in situationswhere
other types of promotionhave
been employed.
Obviously
these limitationsmake
it important to validate the results reported here withnew
data beforemaking
broad generalizations.2. Results
2. 1
Comparative
Holdings ofCBAs
andSLAs
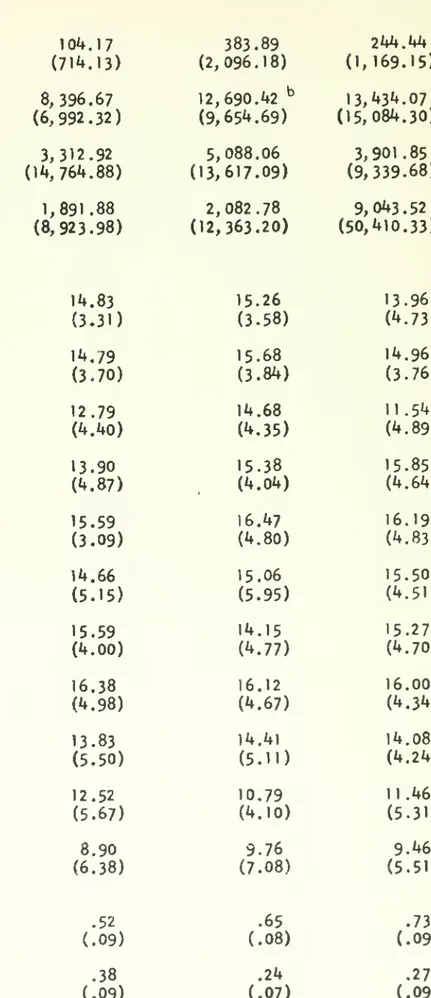
The data presented in Table 1 provide considerable information about the
way
the three
consumer
groups useCBAs
andSLAs
in their portfolios. In addition, in-ferencescan
bedrawn
about the nature of the market reached by thetwo
institutions and their relative effectiveness in exploiting the opportunities presented by theseGroup
TABLE 1
Absolute and Relative Holdings in Commercial Bank Accounts and Savings and Loan Association Accounts
-8-markets.
For
example,
comparison
of the average concentration ratios (i.e. ,$CBA
or
SLA
'A total discretionary assets) indicates thatSUs
in the three groups tend to hold, on average, slightly over50%
of their total discretionary assets inCBAs,
SLAs, or a combination of the two. Although the variances of the three distribu-tions are large, the similarity of the
mean
ratios is striking. Similar results are also found if the concentration of funds in thetwo
assets iscompared
on a group basis. Forexample,
24%
of the total discretionary assets ofGroup
C
isconcen-trated in
CBAs,
27%
of the assets ofGroup
S is concentrated in SLAs, and24%
of the assets of
Group
B is concentrated in combination ofCBAs
and SLAs. The fact that the aggregate concentration ratios are approximately one-halfthe value of the average of the individual ratios indicates, as might be expected, that a large
number
of those with small total asset holdings tend tohave
highcon-centration ratios. Thus, the results suggest that there is little difference in the portfolio role assigned to
CBAs
andSLAs
byconsumers
who
choose
one or the other exclusively; and, contrary to a priori expectations,consumers
who
hold bothCBAs
and
SLAs do
notseem
to concentrate more of their funds in these assets than thosewho
choose
one type of institution exclusively.Viewed
in a slightly differentway,
these results indicate thatcommercial banks
have approximately the
same
effectiveness in exploiting the potential offered bySUs
who
holdCBAs
exclusively, as savings and loan associations have with their present customers.However,
the distribution of funds bySUs
inGroup
Bshows
that the average concentration ratio forCBAs
is approximately one-half of thesame
ratio for
-9-SLAs.
A
similar result is found for the aggregate ratios, i.e. , only8%
ofGroup
B's total assets are in
CBAs
and16%
are in SLAs. Thus, with the group that diversifies thrift depositsbetween
thetwo
institutions,commercial
banksdo
considerably less well than savings and loan associations.
Although the variances are large and the distributions
skewed,
the resultsshown
in Table 1 also indicate that the average balance held inCBAs
is con-siderably smaller than that heldin SLAs.Moreover,
since the denominator of the concentration ratio is total discretionary assets, it is apparent that theSUs
inGroup
C
have, on average, smaller savings to distributeamong
variousalterna-tives.
(Mean
discretionary assets for theGroups C,
S, and B are$11,814,
$23,186,$32,372
respectively.) Thus, the results indicate that thecommercial
banksrepresented in this
sample
appear to attract proportionately more of theSUs
with small savingsand
fewerSUs
with large holdings thando
savings and loan associa-tions.2.2 Characteristics of Holders of Thrift Deposits
The results of the preceding section indicate that there are close similarities
in concentrations of funds in the
two
assets and theremay
be important differencesin the financial capacity or potential of the three
customer
groups. In the follow-ing section the three groups arecompared
on all variables included in the study. 2.2.1 UnivariateComparisons
ofSU
Groups
TABLE 2
Characteristics of Owners of Thrift Deposits
in Commercial Banks and Savings and Loan Associations Variable
TABLE 2 - Continued
Assets (Continued) Bonds
Home equity
Real estate equity
Business equity Psychological Needs Achievement Deference Au tonomy Affiliation Introspection Oominence Abasement Nurtu ranee Change Aggression Heterosexual Ity
Motive for Saving Old age
Education of children
Group C Mean
TABLE 2 - Continued
Motive for Saving (Continued) Payment of debts
Purchase
Emergency
Expectations
Prosperity (Next Five Years)
Recession (Next Five Years)
Price Level Increase (Next Five Years) Price Level Constant
Group C Mean
-13-a
SU
holdingCBAs
and notSLAs
is more likely to be younger,employed
as a skilledor unskilled laborer, and
have
moredependents
living athome,
than is thehead
ofa
SU
holdingSLAs
and notCBAs.
SUs
inGroup
C
also have lessmoney
invested in stocks andhome
equity.SUs
in thetwo
groups are remarkably similar in terms of formal education, income,home
ownership, andchecking
account balances, expectations ofeconomic
and price conditions, and motives for saving.To
theex-tent that
CBAs
andSLAs
are held for the motives listed, the results indicate that both assets are indeed held for similar reasons. The differences inm-old
age andm-education
of children are consistent with the differences in theages
and familyof the
two
groups, i.e. , the younger group with larger families are lessconcerned
with saving for old age, and more
concerned
with saving for education of children than the older, smaller family groups.In general, differences in the
same
variables are found incomparing
C
with B, the major exception is in the expectation of a recession in the near future.Only
7 percent ofGrbup
C
expected a recession,whereas
31 percent ofGroup
B reported that expectation.Group
Swas
significantly different fromGroup
B only in terms of theautonomy-need
score.
In
summary,
univariatecomparisons
of the three groups indicate thatGroup
C
differs from
Groups
S and B on a limitednumber
ofdimensions
andGroup
S is very similar toGroup
B on nearly all dimensions.
-14-(at least in a statistical sense)
between
the groupsdoes
not preclude the possibility that a multivariatemodel
will yield highly significant differences. The multiple discriminant analyses describedbelow
is an attempt toovercome
the limitations of univariate comparisons.2.2.2 Multiple Discriminant Analysis
between
SU
Groups
Group
C
vs.Group
S - Table 3 provides asummary
of the results obtained inthe discrimination
between
holders ofCBAs
andSlAs
usingsocio-economic,
asset, and psychological variables.Discriminant functions utilizing both
socio-economic
and psychologicalvari-ables produced significant F ratios at the .05 probability level.
However,
the eight best psychological variablesaccounted
for over 26 percent of the totalVari-es
ance and
socio-economic
variables accounted for less than 16 percent.The predication
summary shows
the resultswhich were
obtained inthe attempt to predict a given
SU's
accountownership
based
on its characteristics and the coefficients derived in the discriminant function. Forexample,
adiscrimi-so
nant value (Z)
was
calculated for each/as a linear combination of theSU's
psycho-logical characteristics.
On
the basis of theSU's Z
value and a separately calculated qdecision 7r the
SU was
classified inGroup
C
orGroup
S.These
results also indicate that the psychological variables provide the greatestrelative gain in correct predictions over a rational best guess. For
example,
if oneknows
only that 34 of theSUs
are inGroup
S and 29 are inGroup C,
then the optimal prediction strategy—
guess
that everySU
is inGroup
S --would
result in 34/63 orTABLE 3
Discrimination Between Owners of Commercial Bank Accounts and Owners of Savings and Loan Association Accounts, Based on Socio Economic, Asset and Psychological Variables
Analysis of Variance of the Discriminant Function Variables
-16-54 percent of the
SUs
placed in the correctownership
group. Utilization of the information obtained in the discriminant analysis resulted in 45/63, or 71 percent predicted correctly -- a gain of 17 percentage points. Utilization of thesocio-economic
and asset variables produced gains of 8 and 2.5 percentage points,re-spectively.
In an attempt to derive the "best" discriminant function the last six variables eliminated in
each
of the three previous functionswere
combined
in acomposite
analysis. Table 4
shows
the last eight variables to be eliminated from the composite function and thesummary
of the results.The F value for the
composite
function is significant at the .01 probability level and over 36 percent of the variancewas
accounted
for by the 8 variables listed inthe table.
Using
these variables, theownership
ofCBA's
and SLA'swas
predicted correctly in 79 percent of thecases
-- a gain of 25 percentage points.Although average stock holdings
was
the last variable to be excluded in the stepwise analysis, at the eight variable step N-affiliation and clerical occupationmade
greater contributions to the explainedsum
of squares.Of
the eight final variables five are from the psychological category, two are from thesocio-economic
category and one is from the asset category. This result is consistent with the resultsshown
in Table 3; i.e. , psychological variables tend to be better discriminatorsbetween
SUs
who
own CBAs
and not SLAs, andSUs
who
own
SLAs
and notCBAs,
than other types of variables. This result is particularly interesting since univariate tests of themean
psychological scores failed toshow
any significant differences (at the .o5 level). Yetwhen
thesame
variableswere used
in a multivariate model, the endre-TABLEjjt
Discrimination Between Owners of Commercial dank Account* and Owners of Savings and Loan Association Accounts
Based on the Best Eight Variables DISCRIMINANT FUNCTION Variable Stock Clerical N-autonomy N-aff Illation N-heterosexual Ity Age N-achievement M-old age ANALYSIS OF VARIANCE Source of Variance Discriminant Function Remainder PREDICTION SUMMARY Group C Group S Total Mean Z Weiqht
-18-sult is highly significant
even
after corrections for lost degrees of freedom.An
additional and perhapsmore
usefulway
to look at the predictivepower
of the discriminant function is to
compute
the probability of an individualSU
falling in a given group, rather than
making
a binary prediction.In this
way
the full information provided by the function is utilized. In orderto
compute
the probability function theSUs
1individual discriminant scores are grouped into discrete class intervals and the proportion of
each
classowning
a given asset, sayCBAs,
iscomputed
and plotted against the mid-point of theZ
class interval. Figure 1, the probability function
computed
on the basis of thecomposite
discriminant function,shows
clearly thatnone
of theSUs
withZ
scoresof less than -2.76
owns
thrift deposits incommercial
banks, all of theSU's
withZ
scores greater than -2.16own
CBAs,
and the probability ofowning
CBAs
increases monotonicallybetween
thetwo
limits.This analysis also yields additional information. For
example,
since theZ
value is positively associated with the probability of
owning
savings accounts incommercial banks
and the coefficients foreach
of the variables in the functionhave
negative signs, it is clear that high values of the variables are positively associated with the probability of
owning SLAs
and negatively associated with the probabilityof
owning CBAs.
That is, highneeds
forautonomy,
affiliation, achievement, andheterosexuality are more closely associated with
ownership
ofSLAs
than withowner-ship of
CBAs.
Similarly, being older, having a clerical occupation, a motive ofsavings for old age, and large stock holdings are
more
closely related toSLA
owner-ship than toCBA
ownership.FIGURE 1
Probability of Owning Commercial Bank Accounts As a Function of individual Discriminant Scores
Probability of owning CBA I.OOt
.80..
.20..
Discriminant Scores
-20-It is important to note that this analysis
does
not provide information about the relationship of these variables and theamounts
held in thetwo
types of assets. In-deed, only$SLA
and $stock (r = .40), and$SLA
and age (r = .29)have
simple cor-relation coefficients greater than .14. (Of course, multiple correlation analysisbetween
dollar holdings and these variablesmay
yield better results.)In
summary,
the results of the discriminant analysisbetween
holders ofCBA's
and SLA's indicated (1) that psychological variables
seemed
to be better predictorsthan
most
other variables in discriminatingbetween
thetwo
groups, (2) the "best"model
incorporated all three kinds of variables, and (3) the best (composite)model
produced highly significant results (in a statistical sense) and
marked
gains in pre-dictive ability. It remains to be seenwhether
these results are operationally sig-nificant, i.e. , whether thesame
variables will predict theownership
of a differentset of
consumers.
Group
C
vs.Group
B - The resultsshown
in Table 5 are analogous to thosereported in Table 3, except for the substitution of
Group
B forGroup
S. In contrast to the former case,socio-economic
variables appear to produce more significant gains in predictive ability thando
other types.Moreover,
when
the best six vari-ables fromeach
of the separate analyses are incorporated in thecomposite
function, five of the last six variables to be eliminatedwere
from thesocio-economic
class. Contributions to the explained varianceby
each
of the fivewere
highly significant(e.g., self-employed occupation,
income,
professional occupation, and educationTABLE 5
Discrimination Between Owners of Commercial Bank Accounts Only
and Owners of Both Commercial Bank Accounts and Savings and Loan Association Accounts, Based on Socio-economic, Asset and Psychological Variables
Analysis of Variance of the Discriminant Function
TABLE 6
Discrimination Between Owners of Commercial Bank Accounts Only and Owners of Commercial Bank Accounts and Savings and Loan Association Accounts, Based on the Best Eight Variables DISCRIMINANT FUNCTION
Weight Variable Self-employed Income Profess ional Education Age Government Bonds N-ach ievement N-nurturance ANALYSIS OF VARIANCE a P(F)
<
.10 b P(F) < .05 c P(F) < .01 Mean Z Group C Group B .65229 -.00392 .60868 -.06400 -.01460 -.00056 .03707 .02723 .47914 -.84126
-23-Z
scoresbased
on the coefficients derived for the best eight variables enabled correctownership
predictions to bemade
in 78 percent of thecases
—
a gain of 25 percentage points over the "bestguess"
estimate. The probability function derived from theZ
scoresshows
that the function offers perfect discrimination at the extremes and, with the exception of one class interval, the gradient increases monotonicallybetween
the extremes. The signs of the coefficients suggest that concentration of fundsCBAs
rather than diversificationbetween
CBAs
andSLAs
is positively associated with selfemployed
and professional occupations and highneeds
forachievement
and nurturance; and negatively associated with income,education, age, and
government
bond
holdings.Group
S vs.Group
B -- Separate discriminant functionscomputed
forGroups
Sand B produced similar results to those found for
Groups
C
and S. That is,psycho-logical variables resulted in the greatest fraction of the variance accounted for
—
29 percent versus 8 percent for
socio-economic
variables and 7 percent for asset variables -- and the greatest gain in predictivepower
-- 27 percent versus 2per-cent for
socio-economic
variables and 3 percent for asset variables.Wien
the bestvariables from
each
categorywere
combined
in the composite analysis, all six of the psychological variableswere
still in the analysis at the eight variable step; and three of themost
important psychological variables in the S vs. B analysis(N-autonomy,
N-achievement
, N-heterosexuality) are also discriminatorsbetween
Groups
C
and SFIGURE 2
Probability of Owning Commercial Bank Accounts Only, As a Function of Individual Discriminant Scores
Probability of Owning CBA Only
1 .00
^
,80.. .60.- .40-- .20--30 *-*-» \ 1 \ 1- 1 1 1 \ •1 .00 70 .40 .10 + .20 Discriminant ScoresTABLE 7
Discrimination Between Owners of Savings and Loan Association Accounts Only, and Owners of Both Commercial Bank Accounts ana Savings and Loan Association
Accounts, Based on Socio-economic, Asset, and Psychological Variables
Analysis of Variance of the Discriminant Function Variables Socio-economic Assets Psychological Socio-economic Group S Group B Total Assets Group S Group B Total Psychological Group S Group B Total « P(F)
<
.05 Source of Variation Discriminant function Remainder Discriminant function Remainder Discriminant function Remainder Degrees of Freedom 10 115 9 116 8 51 Sum of Squares .0872 Mean Square .9128TABLE 8
Discrimination Between Owners of Savings and Loan Association Accounts Only, and Owners of Both Commercial Bank Accounts and Savings and Loan Association
Accounts, Based on the Best Eight Variables DISCRIMINANT FUNCTION Weight Variable N-autonomy Self-employed N-achievement X-recession N-nurturance Size of SU N-deference N-heterosexual Ity ANALYSIS OF VARIANCE Source of Variance Discriminant Function Remainder PREDICTION SUMMARY Mean Z Group s Group B Group S Group B Total .04400 .31358 2.42479 2.10540 .03560
-27-It is interesting to note that the
composite
function produced virtually no gain in the variance accounted for or in correct predictions over that obtained using the function with psychological variables. In fact, one lessSU
was
predicted correctly in the former analysis.The probability function
computed
from the individualZ
scoresshows
thatZ
is positively associated with the probability of concentrating funds in SLAs.However,
the function
shown
in Figure 3does
not approach and remain at the upper limit asdoes
the function forC
and S, andC
and B. That is, allSUs
withZs between
2.55 and 2.70, and 2.85 and3.00
own
SLAs
only; while only one third of those withZs
between
2.71 and 2.85own
bothSLAs
andCBAs.
The signs of the coefficients
show
that high scores onn-autonomy, n-achievement,
n-nurturance, and n-difference, n-heterosexuality are all
more
closely related toowner-ship of
SLAs
only than toownership
of both assets.Only
the expectation of recessionin the near future is
more
closely associated with diversifying funds in both assets than with concentration of funds in SLAs.3.
Summary
andConclusions
The results presented
above
provide at least first levelanswers
tomany
of the questions raised in the introductory section.First, it is clear that
commonly
used
variablessuch
as income, education, andhome
ownership
are of little value in discriminatingbetween consumer
groupswho
concentrate thrift deposits in
commercial banks
and thosewho
choose
savings andFIGURE 3
Probability of Owning Savings and Loan Association Accounts Only, a
As a Function of Individual Discriminate Scores
Probability of Owning SLA Only
1
.00-
.80--Discriminant Scores
-29-both proved to be important factors in the final discriminant function. Thus, the hypothesis about the
homogeneity
of thetwo
groups in terms of standard marketing variables is partially supported by the results of the analysis.It also
seems
clear that there are empirically verifiable psychologicaldiffer-ences
between
thetwo
groupswhich can
be obtained with an easily administeredpencil and paper test. This result
has
important implications for the marketing strategy of the institutions. If the differences in theneeds
found in this analysis are general it should be possible for marketing executives of the institutions todesign promotional
messages
to more effectively cultivate possible inherent advantages,For
example,
theneed
forautonomy
seems
to be particularly closely associated withconcentrating funds in SLAs.
Even
if theneeds
found important heredo
nothave
generality in other situations,these results clearly indicate that it is possible for an institution to easily ascertain personality differences in
consumer
groupswhich
may
be closely associated with dis-tinct market advantages.It is important to note that
none
of the saving motives proved to be important discriminatorsbetween
thetwo
groups (saving for old age motivewas
not significant at the .10 probability level). Thus, the motives included in this study are, in the net analysis, no more closely associated with one type account than with the other. This result indicates that theremay
be little competitive advantage to be gained by an institution appealing directly to these motives.
-30-amounts
held in other assetshave
little ifany
differential association withCBA's
and SLA's. Thus, from a portfolio point of view, both assets
seem
to play similar roles. This result is consistent with the motives for saving results.The results of the analyses involving
Group
B -- thosewho
diversify their thriftdeposits in both
CBAs
andSLAs
—
present an interesting picture.It is clear from Tables 6 and 8 that
SUs
inGroup
B are more likeGroup
S thanGroup
C
in terms of concentrations of holdings and financial ability. Yet themost
important variables in distinguishing
between Group
C
andGroup
B are themore
com
-monly used socio-economic
variables and themost
important discriminatorsbetween
owners
ofSLAs
only andGroup
B are psychological variables. Sinceowners
of bothCBAs
andSLAs have
low absolute holdings, as well as concentration ratios incom-mercial banks, these results indicate areas of important
weaknesses.
Forexample,
income, education, age, and
government bond
holdingswere
all negatively associated with the probability ofowning
CBAs
only.Similar conclusions
may
bedrawn
from the results of theGroup
B-Group
S dis-criminant analysis since savings and loan associations do less well, relatively speaking, with thosewho
diversify than they do with thosewho
hold only SLAs.In
summary,
the results of this study indicate that certain psychologicalvari-ables are important discriminators
between owners
of thrift deposits incommercial
banks
and savings and loan associations, but the best discriminantmodels
requireboth psychological variables and standard
socio-economic
variables.
-31-small sample size, there is evidence that both institutions
do
equally well in exploit-ing the opportunity presented by thecustomers
who
concentrate their thrift deposits, but savings and loan associationshave
a competitiveedge
withconsumers
who
diversify their holdings.The results found in the analysis of the concentration ratio's also strongly indi-cate -- as do the non-significant motives for savings -- that both assets play very Similar roles in the portfolios of those that hold them.
Finally, it is the author's opinion that although the specific variables found significant here provide intriguing
hypotheses
to be tested in real world marketing experiments,showing
that themost
effective discriminate functions involve easilymeasured
psychological variables is amore
important result than determination ofthe specific variables in the function. For these results suggest that
even
simple testsmay
provide quantifiable personalitydimensions which can
be related to im-portant marketing variables.FOOTNOTES
1. See, "Flows Through Financial Intermediaries," Federal Reserve Bulletin, Vol. 50, No. 5, May, 1964, pp. 549-557
2. For example see, Clifton H. Creps, Jr., and David T. Lapkin, "Public Regulation and Operating Conventions Affecting Sources of Funds of Commercial Banks and Thrift Institutions," Journal of Finance,
Vol. XVII, No. 2, May, 1962, p. 289;
David Alhadeff and Charlotte P. Alhadeff, "The Struggle for Commercial Bank Savings," The Quarterly Journal of Economics, Vol. LXXI I
,
February, 1958, No. 1, pp. 1-22.
Marvin Rozen, "Competition Among Financial Institutions for Demand and Thrift Deposits," Journal of Finance, Vol. XVII, No. 2, May, 1962,
p. 318.
3. A savings unit is defined as one or more persons living in the same
dwelling pooling half or more of their income and savings. A dwelling unit may, therefore, have more than one savings unit
k. The consumer savings project is a large-scale study designed to develop the methodology for collection of accurate financial information through the survey technique. See Robert Ferber, Collecting Financial Data by
Consumer Panel Techniques, (Bureau of Economic and Business Research. University of Illinois, 1959).
5. Total discretionary assets was defined as the amount of SO"s total savings minus equity in the home, checking account balances, currency, cash value of life insurance and present value of pension plans.
6. The two-way discriminate analysis is analogous to standard regression analysis in which the dependent variable is dichotomous. One can view
the process as maximizing the deviation of the means of the two groups away from a discriminate function rather than attempting to minimize
the deviations of the dependent variable away from a regression line. For a discussion of discriminant analysis see, R. A. Fisher, Contributions to Mathematical Statistics, (New York: John Wiley and Sons, Inc., 1950),
pp. 184-90.
7. Alan Edwards, Edwards Personal Preference Schedule Manual, Revised, 1959,
New York Psychological Corporation.
8. The psychological tests were administered to 50 per cent of the original sample who were randomly selected from the total. Tests made on key variable indicate that there are no significant differences between
'
r—o
—
p 29. The decision Z is calculated as follows: Z, = .—
—
. IZ£ - Z* + 2 <rd 2(Z -Z ) c s P
p c b
Where: Z = mean discriminant score for Group C c
Z
s = mean discriminant score for Group S
<j2 = the pooled variances of the discriminant scores for each group
P
P = proportion of the observations in Group C P = proportion of the observations in Group S
William W. Cooley and Paul R. Lohnes, Multivariate Procedures for the Behavioral Sciences (New York: John Wiley and Sons, Inc., 1962),
pp. 117-18.
10. For an application of this technique in the prediction of innovative purchas ing -behavior see, Ronald E. Frank and William E. Massy, "Innovation and Brand Choice," (Paper presented at the American Marketing Association Winter Conference, Boston, Massachusetts,
3 nOflO
003
flbfi 40inmiIImi innmimimilini,nil
3
TOAD 003 ATT E4^
3 TOfl
0D3
flt.fi357
1751
«*IO
roeS M.I.T. Alfred
P. Sloan .M414 School of Management Nos.55-64 Workup- *>-ers. 5 .£». 3 TDflO
003
flbflMaL
^
im1 .UBft A"IE$ 3tOAO 003
flbfl577
mini
"-«
MET LIBRARIES 3 TOflO003
flbfl715
MIT LIBRARIES 3tOSO 003
flbfl707
&-^
67-^
3 nOflO003
ties flbfl bfli i ii 3 TOflO003
flbflt73
III
iii i -75-CM
72--kM
3Toao 003
an
t,T4 HlllVi8M"'fS°^"
fe.7fl / m'imiB"«lES3