https://doi.org/10.1021/la034959m
READ THESE TERMS AND CONDITIONS CAREFULLY BEFORE USING THIS WEBSITE. https://nrc-publications.canada.ca/eng/copyright
Vous avez des questions? Nous pouvons vous aider. Pour communiquer directement avec un auteur, consultez la première page de la revue dans laquelle son article a été publié afin de trouver ses coordonnées. Si vous n’arrivez pas à les repérer, communiquez avec nous à [email protected].
Questions? Contact the NRC Publications Archive team at
[email protected]. If you wish to email the authors directly, please see the first page of the publication for their contact information.
NRC Publications Archive
Archives des publications du CNRC
This publication could be one of several versions: author’s original, accepted manuscript or the publisher’s version. / La version de cette publication peut être l’une des suivantes : la version prépublication de l’auteur, la version acceptée du manuscrit ou la version de l’éditeur.
For the publisher’s version, please access the DOI link below./ Pour consulter la version de l’éditeur, utilisez le lien DOI ci-dessous.
Access and use of this website and the material on it are subject to the Terms and Conditions set forth at
Electrochemically driven assembly of mixed dithiol bilayers via sulfur
dimers
Rifai, S.; Lopinski, G. P.; Ward, T.; Wayner, D. D. M.; Morin, M.
https://publications-cnrc.canada.ca/fra/droits
L’accès à ce site Web et l’utilisation de son contenu sont assujettis aux conditions présentées dans le site LISEZ CES CONDITIONS ATTENTIVEMENT AVANT D’UTILISER CE SITE WEB.
NRC Publications Record / Notice d'Archives des publications de CNRC:
https://nrc-publications.canada.ca/eng/view/object/?id=2b9ba878-0bb9-4dc2-87a4-1fa06edbed60
https://publications-cnrc.canada.ca/fra/voir/objet/?id=2b9ba878-0bb9-4dc2-87a4-1fa06edbed60
Electrochemically Driven Assembly of Mixed Dithiol
Bilayers via Sulfur Dimers
S. Rifai,
†G. P. Lopinski,
‡T. Ward,
‡D. D. M. Wayner,
‡and M. Morin*
,§ Department of Chemistry and Ottawa-Carleton Chemistry Institute, University of Ottawa,Ottawa, Canada, Steacie Institute for Molecular Sciences, NRC, Ottawa, Canada, and De´partement de Chimie, Universite´ du Que´bec a` Montre´al, Montre´al, Canada
Received June 2, 2003. In Final Form: August 5, 2003
We report on the electroformation of mixed bilayers of rigid (1,4-benzenedimethanethiol) and flexible (1,6-hexanedithiol) dithiols on Au(111) from alkaline aqueous solution. These bilayers are formed by first electrodepositing a monolayer of vertically aligned dithiols. The unreacted dithiols are then oxidatively dimerized with the other dithiols, and a bilayer is formed. ACIS (ac impedance spectroscopy) measurements indicate that the monolayer of the rigid dithiol is a better substrate for dimerization than the flexible dithiol. ACIS also reveals that the electroformation of a bilayer is more complete, and the bilayer has fewer defects than one obtained through chemical incubation. Infrared reflection-absorption spectroscopy provides proof for mixed-bilayer formation of the alkanedithiol with the benzenedimethanethiol having its methylene groups deuterated. The mechanism for bilayer formation via the oxidative dimerization of thiols is supported by high-resolution electron energy loss spectra of bilayers, which show a S-S stretch at 515 cm-1. Our results show that this electrochemical approach is a viable methodology for the formation of complex organic interfaces.
Introduction
The use of self-assembled monolayers (SAMs) of func-tionalized thiols having few defects has become increas-ingly important in the design of new materials. The terminal moiety of the thiol may serve as a reactive center for fabricating complex systems, with applications in biosensors1-4and memory devices.5-7For instance, car-boxylic acid terminated alkanethiols form monolayers that can serve as adhesion layers for biomolecules and cells.1-4 Specifically, mercaptopropionic acid SAMs have been used as biosensors to selectively interact with the lysine groups of cytochrome c.2,3 They have also been used for the electrochemical detection of dopamine.4
Recently, SAMs of aromatic thiols having different substituents and terminal groups have been extensively studied.5-7Beyond their rigidity, the advantage of func-tionalized aromatic thiols is in their potential as molecular wires. Their conjugation affects the acidity of the thiol proton and can therefore make the thiolate a softer or a harder ligand.5Since the thiolate is an electron-donating group, an electron-attracting substituent will result in a significant molecular dipole moment, which may facilitate switching the conductivity of the molecule from an on to an off state.6,7
In the present work, the electrofabrication of mixed bilayers of 1,4-benzenedimethanethiol (1,4-BDMT) and
1,6-hexanedithiol (1,6-HDT) is discussed. These dithiols were selected because they have very different structures. The 1,4-BDMT molecule has a relatively rigid structure, despite the fact that the unbound thiolate can rotate due to its bond with a methylene group. In contrast, the 1,6-HDT has a flexible molecular framework. Regardless of these structural differences, the separation between the sulfurs in both molecules is similar.8Thus, these dithiols are appropriate systems to investigate the structural effect (i.e., rigid versus flexible) on making reactive templates of thiols.
Our approach to fabricating such complex systems is an electrochemical one. We have shown that monolayers and bilayers of the BDMT isomers can be electrodeposited onto Au(111) from alkaline electrolyte.9,10This electrosyn-thetic method could be extended to depositing mixed bilayers having applications in molecular electronics. For instance, by alternating monolayers of insulating and conducting dithiols, it should be possible to construct molecular heterostructures expected to exhibit interesting electrical characteristics.
Experimental Section
The preparation of the Au(111) single-crystal electrode and the electrochemical setup have been described previously.11The
1,4-BDMT and 1,6-HDT were purchased from Aldrich and used as received. Solutions of the dithiols were made in 0.5 M KOH (semiconductor grade, Aldrich) with deionized and distilled water (Milli-Q Plus, Millipore Corp.). The potentials given in this paper are all relative to a saturated calomel electrode (SCE). The differential capacitance (dc) and ac impedance spectroscopy (ACIS) measurements were performed with a Solartron system (Potentiostat model 1287, Impedance analyzer model 1260). The dc was measured between -0.30 and -0.50 V in a pure 0.05 M KOH solution. A 20 Hz ac potential of 5 mV root-mean-square
* Corresponding author. E-mail: [email protected]. †University of Ottawa.
‡Steacie Institute for Molecular Sciences. §Universite´ du Que´bec a` Montre´al.
(1) Song, S.; Clark, R. A.; Bowden, E. F. J. Phys. Chem. 1993, 97, 6564.
(2) Amador, S. M.; Pachence, J. M.; Fischetti, R.; McCauley, J. P.; Smith, A. P.; Blasie, J. K. Langmuir 1993, 9, 812.
(3) Clark, R. A.; Bowden, E. F. Langmuir 1997, 13, 559.
(4) Giz, M. J.; Duong, B.; Tao, J. J. Electroanal. Chem. 1999, 465, 72. (5) Kang, J. F.; Ulman, A.; Liao, S.; Jordan, R.; Yang, G.; Liu, G.-y.
Langmuir 2001, 17, 95.
(6) Chen, J.; Reed, M. A.; Rawlett, A. M.; Tour, J. M. Science 1999,
286, 1550.
(7) Reed, M. A.; Chen, J.; Rawlett, A. M.; Price, D. W.; Tour, J. M.
Appl. Phys. Lett. 2001, 78, 3735.
(8) The distance was calculated with Gaussian (HF/6-31G*), having a value of 8.4 Å in 1,4-BDMT and 9.2 Å in 1,6-HDT.
(9) Rifai, S.; Laferrie`re, M.; Qu, D.; Wayner, D. D. M.; Wilde, C. P.; Morin, M. J. Electroanal. Chem. 2002, 531, 111.
(10) Rifai, S.; Morin, M. J. Electroanal. Chem., in press.
(11) Yang, D. F.; Wilde, C. P.; Morin, M. Langmuir 1997, 13, 243.
-8921
10.1021/la034959m CCC: $25.00 © 2003 American Chemical Society Published on Web 08/30/2003
(rms) amplitude and a potential scan rate of 5 mV s-1were used
for these measurements. All capacity values reported are an average of at least three measurements taken at -0.40 V. The solution used for ac impedance measurements consisted of equimolar concentrations of potassium ferricyanide and potas-sium ferrocyanide (1.0 mM), with a supporting 0.05 M NaClO4
aqueous electrolyte. The ac impedance measurements were performed at the formal potential of the K3Fe(CN)6/K4Fe(CN)6
couple, determined by cyclic voltammetry with an applied bias voltage of 0.20 V modulated with a superposed sinusoidal potential of 5 mV rms amplitude. The impedance was measured from 100 kHz to 0.1 Hz with 10 measurements per decade.
The infrared reflection-absorption spectroscopy (IRRAS) measurements were recorded with p-polarized light at an angle of incidence of 85° relative to the surface normal using an experimental setup described elsewhere.12 The absorbance
spectra presented here are an average of at least 1500 scans taken at a resolution of 2 cm-1. High-resolution electron energy
loss (HREEL) spectra were obtained using the LK3000 spec-trometer (LK Technologies, Bloomington, IN). Spectral resolution was on the order of 40 cm-1(full width at half-maximum of the
elastic peak) at a count rate on the order of 103-105cps. The gold
films used in the IRRAS and HREELS measurements were purchased from Arrandee, and their preparation is described elsewhere.9
Results and Discussion
Electrochemical Results. 1,6-HDT and 1,4-BDMT
Bilayers.We reported an electrodeposition method to form
a bilayer of 1,4-BDMT at the Au(111) surface in a stepwise fashion.9,10A complete monolayer of vertically oriented dithiolates was first formed at potentials between -0.82 and -0.85 V. The unreacted sulfur end groups were then oxidized by scanning the potential to values more positive than -0.65 V. This resulted in dimerization between an adsorbed dithiolate and a dithiolate in solution. However, this rapid deposition did not allow sufficient time for the bilayer to organize. Monolayer formation of thiols onto gold occurs in two steps. The first step involves rapid adsorption,13-15 whereas the second step involves the slower reorganization of the alkane chains to maximize the van der Waals interactions.13-15This has also been demonstrated in a recent study on the oxidative deposition of alkanethiolates on gold, whereby the reorganization is a slow, potential-independent process.13Longer electro-deposition times allow this second step to occur, and a more homogeneous film with fewer defects is obtained. The results presented below were obtained using longer deposition times than we previously used to form bilayers of dithiols. The potential was scanned from -1.00 to -0.20 V and then held at -0.20 V for 10 min in a 0.5 M KOH aqueous solution saturated with 1,4-BDMT (approxi-mately 7 × 10⁻⁴M). The potential was then cycled twice starting at -0.20 V to -1.15 V. The resulting cyclic voltammograms are presented in Figure 1a. The first reductive (negative-going) potential scan (curve 1) rep-resents the reduction of the bilayer (current peak B′′) formed upon holding the potential. The following oxidative (positive-going) potential scan reveals two peaks labeled A (attributed to monolayer formation) and B (attributed to bilayer formation).9,10The second reductive scan (curve 2) represents bilayer formation via continuous scanning of the potential. The peak B′′on the first reductive scan (curve 1) is located at a more negative peak potential than the B′′on the second reductive scan (curve 2). The
baseline-corrected charge of B′′on consecutive cycles remains the same, having a value of 69 ( 6 µC cm-2.
The cyclic voltammogram of 1,6-HDT (1 mM in 0.5 M KOH) at the Au(111) surface, shown in Figure 1b, is very similar to that of 1,4-BDMT. Although the reductive peak B′′is sharper for 1,6-HDT, its baseline-corrected charge is similar (within error) to that of 1,4-BDMT having a value of 80 ( 5 µC cm-2. In addition, the peak B′′(curve 1) on the first voltammogram is at more negative potentials on the second voltammogram (curve 2). The reduction of the bilayer (peak B′′) on the second cycle (curve 2) for both dithiols occurs at almost the same potential value (-0.95 V for 1,6-HDT and -0.96 V for 1,4-BDMT). The oxidative peak current A is located at -0.86 for 1,6-HDT, while that of peak B is at -0.31 V. These values are again very similar to those of 1,4-BDMT at -0.81 and -0.36 V, respectively.9 Peak B is less defined for the 1,6-HDT.
The bilayer formation of 1,6-HDT was further charac-terized by chronocoulometry, and the results are compared with those previously described for 1,4-BDMT.9In these experiments, the potential was first set at -1.00 V for 5 min to obtain an uncoated Au(111) surface. The potential was then stepped to -0.75 V, where the electrochemical reaction related to peak A occurs, and the charge-time response was recorded for 2 s. Finally, the potential was stepped to - 0.20 V, where the electrochemical reaction related to peak B occurs, and another charge-time response was recorded. The charges obtained for peaks A and B of 1,6-HDT are 66 ( 4 µC cm-2and 125 ( 10 µC cm-2, respectively. These are very near the values reported for 1,4-BDMT of 70 ( 7 µC cm-2for peak A and 133 ( 8 µC cm-2for peak B.9Based on these results, we conclude that monolayers and bilayers of 1,6-HDT can be electro-deposited onto Au(111).
The fact that peak B′′ shifts toward more negative potentials upon holding and scanning the potential suggests that ion permeation is more difficult in this case than for a bilayer formed through continuous scanning of the potential. Thus, the bilayer is more uniform and has fewer defects when prepared in this way. This observation is supported by the differential capacitance measurements performed after scanning through peaks A and B, followed by holding the potential for 10 min at -0.20 V. The capacity of 4.6 ( 0.5 µF cm-2for 1,4-BDMT obtained through direct scanning decreased to 1.5 ( 0.1 µF cm-2. A decrease was (12) Yang, D. F.; Al-Maznai, H.; Morin, M. J. Phys. Chem. B 1997,
101, 1158.
(13) Qu, D.; Morin, M. J. Electroanal. Chem. 2001, 517, 45. (14) Qu, D.; Morin, M. J. Electroanal. Chem. 2002, 524, 77. (15) Ha¨hner, G.; Wo¨ll, Ch.; Buck, M.; Grunze, M. Langmuir 1993,
9, 1955.
Figure 1. Cyclic voltammograms of (a) 1,4-BDMT and (b) 1,6-HDT electrodeposited on Au(111) from 0.5 M KOH. The potential was held at -0.20 V for 10 min and then cycled between -0.20 and -1.15 V twice, starting with the cathodic scan. Potential scan rate: 20 mV s-1.
also observed in the capacitance of 1,6-HDT from 3.0 ( 0.3 to 2.0 ( 0.2 µF cm-2. These values are comparable to the capacitance measured for a hexadecanethiol monolayer (1.7 µF cm-2) formed through spontaneous adsorption16 or by electrodeposition from 0.5 M KOH.17This is expected since the bilayers are of similar length to the hexa-decanethiol monolayer. This value is approximated to be about 18.0 Å by assuming a thickness of 1.1 Å per CH2 (the value for an all-trans alkyl chain inclined at 30° to the surface).18 The bilayers of 1,4-BDMT and 1,6-HDT are expected to have a film thickness of about 16.8 and 18.4 Å, respectively, if oriented vertically to the surface. The decrease in the capacity values at a longer elec-trodeposition time is attributed to adequate time for the organization of the bilayer.
Mixed Bilayers.The quality of the bilayer improves upon
holding the potential at -0.20 V for 10 min. A similar method of depositing bilayers was thus employed in forming mixed-component bilayers. Monolayers of the BDMT isomers can be reacted with an alkanethiol.10A monolayer of 1,4-BDMT was first electrodeposited as described above, and the electrode was removed from the solution while maintaining the potential at -0.70 V. The electrode was rinsed with water and transferred to a 1 mM solution of 1,6-HDT in aqueous 0.5 M KOH. The potential was scanned from -0.70 to -0.20 V and held at this value for 10 min. Finally, the electrode was transferred to a solution of pure 0.05 M KOH, and the capacitance was measured. A value of 2.3 ( 0.2 µF cm-2was obtained for the capacitance of the mixed bilayer BDMT/HDT (i.e., 1,4-BDMT on bottom and HDT on top). This value is significantly lower than those of HDT and BDMT mono-layers (6.4 ( 0.6 µF cm-2 and 10.4 ( 0.8 µF cm-2, respectively9,10). The integration of the reductive peak B′′ on the subsequent reduction was similar to that of peak B′′obtained directly in the 1,4-BDMT solution through continuous scanning of the potential, having baseline-corrected values of 89 ( 6 µC cm-2and 82 ( 5 µC cm-2, respectively. Peak B′′was located at a potential of about -1.03 V. The same experiment was performed starting with a monolayer of 1,6-HDT and reacting it with 1,4-BDMT (HDT/1,4-BDMT). A capacity of 1.6 ( 0.1 µF cm-2was measured for this mixed bilayer. The reductive peak B′′
was located at -1.12 V and upon integration yields a baseline-corrected charge of 70 ( 6 µC cm-2. These capacity values are comparable to the ones obtained upon holding the potential in the same dithiol solution. It is difficult to comment on which monolayer template is better for reacting (i.e., 1,4-BDMT or 1,6-HDT) since the capacity values are all very close.
ACIS. The ion-blocking properties of the bilayer as-semblies were examined with ACIS. The impedance of the 1,4-BDMT-modified Au(111) electrode was measured, and the results are presented as Argand diagrams in Figure 2. The shape of the plots is significantly different depending on the method of deposition. Figure 2a il-lustrates the typical impedance results of a chemically deposited film of 1,4-BDMT. This layer was prepared through incubation of a Au(111) single-crystal electrode in a saturated ethanolic solution of 1,4-BDMT for 1 h. There is a semicircle at high frequencies and a linear region inclined at 45° at lower frequencies. This is typical of a fast electron transfer, followed by a diffusion-controlled
process.19-21 The electrodeposited 1,4-BDMT bilayer’s impedance results are given in Figure 2b. The main difference between the two 1,4-BDMT Argand plots is that the low-frequency linear-mass-transfer region is not observed for the electrodeposited film. This shows that the latter film is a better ion-blocking one than the former. These results support our previous suggestion9,10 that oxidative deposition yields complete bilayers in a fast and reproducible way. These impedance results further dem-onstrate that the electrodeposited bilayers of 1,4-BDMT are better at blocking redox processes than those formed through chemical incubation.22,23
The solid curves in Figure 2 represent fits of the experimental data using the Randles circuit shown in Scheme 1. This circuit has been applied to describe heterogeneous electron transfer across an alkanethiol-modified electrode.19-21The RCTfor [Fe(CN)6]4-/3-and the
CDLfor the chemically deposited 1,4-BDMT film were 300 ( 30 Ω cm2and 4.8 ( 0.4 µF cm-2, respectively. The charge-transfer resistance increased to 7400 ( 500 Ω cm2, and the double-layer capacity dropped to 1.3 ( 0.1 µF cm-2for the electrodeposited sample. The RCT shows variability
(16) Yang, D.-F.; Morin, M. J. Electroanal. Chem. 1998, 441, 273. (17) Al Maznai, H. M. Ph.D. Thesis, Chemistry, University of Ottawa, Ottawa, Canada, 1999, p 61.
(18) Bain, C. D.; Troughton, E. B.; Tao, Y.-T.; Evall, J.; Whitesides, G. M.; Nuzzo, R. G. J. Am. Chem. Soc. 1989, 111, 321.
(19) Janek, R. P.; Fawcett, W. R. Langmuir 1998, 14, 3011. (20) Protsailo, L. V.; Fawcett, W. R. Langmuir 2002, 18, 9342. (21) Boubour, E.; Lennox, R. B. J. Phys. Chem. B 2000, 104, 9004. (22) Murty, K. V. G. K.; Venkataramanan, M.; Pradeep, T. Langmuir
1998, 14, 5446.
(23) Joo, S. W.; Han, S. W.; Kim, K. J. Phys. Chem. B 1999, 103, 10831.
Figure 2. Argand plots of the impedance of Au(111) modified with 1,4-BDMT through (a) chemical incubation and (b) electrodeposition of a bilayer in the manner described in the text and in the caption of Figure 1. The solid line represents a fit using the Randles circuit model.
Scheme 1. The Randles Circuita
aW.E.is the working electrode, R.E. is the reference electrode, and C.E. is the counter electrode. The results of the fit provide numerical values for RS (the solution resistance), RCT (the
resistance to charge transfer), CDL(the double-layer
from trial to trial as is shown in Table 1, but the shapes of the Argand plots remain the same. The variation on
RCTis relatively high; thus the results can only be discussed on a qualitative level. Nevertheless, the average RCTvalue for the electrodeposited BDMT sample is 4500 ( 2500 Ω cm2, still about 3 times larger than that of the incubated sample (1300 ( 1200 Ω cm2).
Although the deviation on the RCT value for the electrodeposited sample is not as large as that of the incubated sample, it is still significant. This is attributed to the mechanism proposed for bilayer formation:10
The mechanism consists of two successive steps. The first one (reaction 1) represents the activation of the unreacted sulfur of the adsorbed dithiolate at sufficiently positive potentials. This activation would decrease the negative charge on the unreacted sulfur, making it a weaker nucleophile. The second step (reaction 2) involves the nucleophilic attack of an adsorbed activated sulfur, S*, by
a dithiolate in solution. This reaction requires the proper orientation of the activated thiolate. Variability in bilayer film formation is thus expected. Nevertheless, the elec-trosynthetic conditions provide more control for sulfur oxidation and orientation than those of chemical incuba-tion. The electrochemical route offers a more complete reaction than the chemical one since the latter one relies on trace amounts of oxidants, such as oxygen, present in the incubation medium24for bilayer formation.
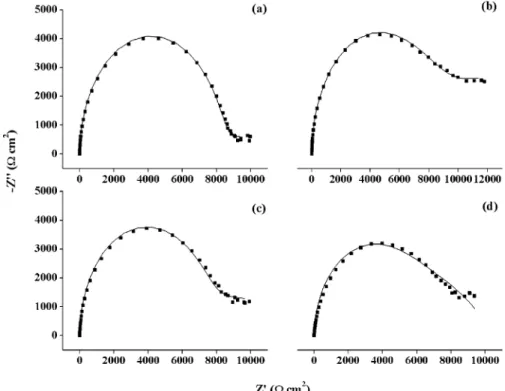
Figure 3 shows the impedance results for the four bilayers prepared on gold by the electrochemical method described above. Average values for RCTand CDLobtained from the fits are summarized in Table 1. Although there is a lot of variability in the tabulated results, the curve shapes do not vary significantly from trial to trial. Thus, the curve shapes will be used to qualitatively describe the structure of the bilayers. The shape of the curve for the 1,4-BDMT bilayer in Figure 3a is close to a semicircle, implying that the film is relatively homogeneous and that the reaction is under kinetic control (i.e., slow) over the entire frequency range. In contrast, the 1,6-HDT bilayer in Figure 3b shows more tailing in the low-frequency region, which is indicative of a more heterogeneous process, that is, a distribution of rates of electron transfer. The mixed bilayer results for BDMT/HDT and HDT/BDMT are shown in panels c and d of Figure 3, respectively. The film having 1,4-BDMT as its template for reactivity displays an Argand diagram which is more of a semicircle than the reverse film. This fits well with the IR spectra for the 1,4-BDMT monolayer, which suggested that these molecules were aligned relatively vertical to the gold.9 Hence there is easier access to the activated sulfurs. Of the four films, the dithiol bilayer having the 1,6-HDT on the bottom deviates most from a semicircle. This is in line with the fact that alkanethiol monolayers having fewer than nine carbons tend to have more structural defects
(24) Weckenmann, U.; Mittler, S.; Naumann, K.; Fischer, R. A.
Langmuir 2002, 18, 5479.
Figure 3. Argand plots of the impedance of Au(111) modified with an electrodeposited bilayer of (a) 1,4-BDMT, (b) 1,6-HDT, (c) BDMT/HDT, and (d) HDT/BDMT. The solid line represents a fit using the Randles circuit model. See the text for electrodeposition details.
Table 1. Results from the Randles Circuit Model Fits of the Impedance Curves for the Resistance to Charge Transfer (RCT) and Double-Layer Capacitance (CDL)
RCT/×103Ω cm2 CDL/µF cm-2 BDMT (incubated) 1.3 ( 1.2 4.7 ( 0.7 BDMT 4.5 ( 2.5 1.2 ( 0.1 HDT 6.2 ( 4.8 5.5 ( 0.3 BDMT/HDT 16.0 ( 9.2 2.8 ( 0.2 HDT/BDMT 1.8 ( 1.8 2.0 ( 0.6 Au-S-CH2-Ph-CH2-S-adsf Au-S-CH2-Ph-CH2-S*-ads (1) Au-S-CH2-Ph-CH2-S*-ads+ -S-CH 2-Ph-CH2-S-solf Au-S-CH2-Ph-CH2-S-S-CH2-Ph-CH2 -S -ads+ 2e- (2)
than the longer chain aliphatic thiols.25This tendency is also reflected in the values for RCT given in Table 1, whereby the value for the mixed bilayer BDMT/HDT is 8 times higher than that of the HDT/BDMT mixed bilayer. IRRAS. Spectroscopic characterization of the mixed bilayers was obtained through IRRAS. To be able to differentiate between the vibrational modes of 1,4-BDMT and 1,6-HDT, the methylene groups of the 1,4-BDMT were deuterated (d-BDMT). The electrochemistry of d-BDMT was found to be identical to what has already been reported for the 1,4-BDMT.9,10 The IR results for the 1,4-BDMT bilayer have been described elsewhere.9There are only three bands present in the spectrum of the deuterated compound (Figure 4), all corresponding to aromatic vibrational modes. The sharp band at 3017 cm-1 is an aromatic CH stretch, and the bands at 1507 and 1408 cm-1correspond to aromatic ring deformation modes.9The high-frequency methylene C-H stretching bands9are not present in the d-BDMT bilayer. The middle frequency range was probed to identify the C-D stretching vibrations expected at about 2230 cm-1.26 No CD
2 modes were observed, likely since they are relatively weak to begin with and there are only two such groups in the d-BDMT. It was not possible to estimate the average orientation of the molecules through tilt and twist angles because the normal modes of the aromatic ring have transition dipoles that are collinear.27,28
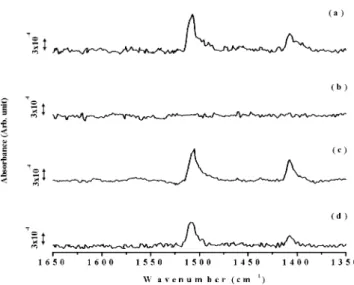
Having verified that the d-BDMT has no vibrational signature for a methylene group, the IR spectra of the 1,6-HDT bilayer and mixed bilayers were taken. The four spectra are presented in Figures 5 and 6, displaying the high- and low-frequency regions, respectively. There are two modes observed in the 1,6-HDT bilayer at 2928 and 2855 cm-1(Figure 5b), corresponding to ν(CH2asym) and ν(CH2sym), respectively. These bands cannot be used to calculate the orientation of the alkyl chains since their relative intensities do not change as a function of the tilt of the molecular axis.27,28The spectra of the mixed bilayers show bands present in the two dithiol systems. The methylene modes can only be attributed to the 1,6-HDT, while the aromatic modes are only attributed to d-BDMT. The spectra in Figures 5c,d and 6c,d provide further
support of the formation of mixed bilayers that we previously suggested.9,10
HREELS. 1,6-HDT and 1,4-BDMT monolayers and bilayers were investigated with HREELS. For both systems, similar spectra were obtained for the monolayers
(25) Porter, M. D.; Bright, T. B.; Allara, D. L.; Chidsey, C. E. D. J.
Am. Chem. Soc. 1987, 109, 3559.
(26) Chung, C.; Lee, M. J. Electroanal. Chem. 1999, 468, 91. (27) Varsanyi, G. Assignments for Vibrational Spectra of Seven
Hundred Benzene Derivatives; Wiley: New York, 1974.
(28) Kang, J. F.; Ulman, A.; Liao, S.; Jordan, R.; Yang, G.; Liu, G.-y.
Langmuir 2001, 17, 95.
Figure 4. IR spectrum of an electrodeposited bilayer of d-BDMT on Au(111).
Figure 5. IR spectrum of the high-frequency region of an electrodeposited bilayer of (a) d-BDMT, (b) 1,6-HDT, (c) d-BDMT/HDT, and (d) HDT/d-BDMT on Au(111).
Figure 6. IR spectrum of the low-frequency region of an electrodeposited bilayer of (a) d-BDMT, (b) 1,6-HDT, (c) d-BDMT/HDT, and (d) HDT/d-BDMT on Au(111).
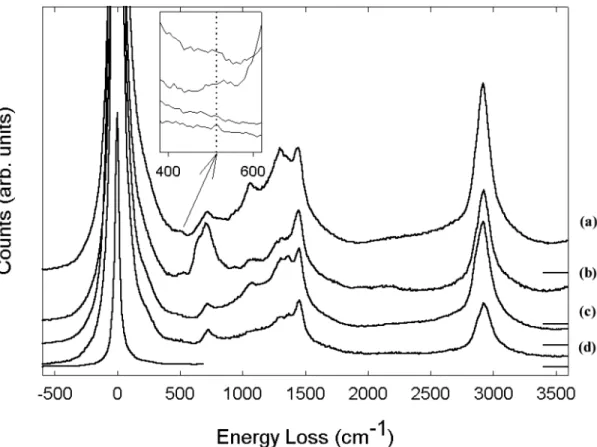
and bilayers. However, the vibrational peak intensities were, in general, approximately 2 times larger in the bilayer. This is expected within the dipole scattering approximation, since under the conditions employed here, the effective probe depth exceeds the thickness of the layers. HREEL spectra for the 1,6-HDT monolayer and bilayer samples are shown in Figure 7. Apart from the intensity difference already noted, for a given incident energy the spectra of the monolayer and bilayer are quite similar. The major peak positions are in good agreement with those reported previously for incubated octa-decanethiol/Au(111).29In contrast to the IRRAS spectra for 1,6 HDT, several modes are observed in the 1000-1500 cm-1region and can be assigned to CH2 bending modes and C-C stretch modes. The mode at 720 cm-1can be assigned to the C-S stretch. Most importantly, HREELS can be used to observe the S-S stretch expected for the bilayer based on reaction 2. The S-S mode is expected in the 500-540 cm-1 range.22,23,29-31 A rather weak but reproducible feature is observed at 515 cm-1for the bilayer as shown in the inset of Figure 7. The weakness of the mode is expected based on the weak dynamic dipole associated with this bond coupled with the dielectric
screening of the upper layer. The absence of this mode in the monolayer indicates there is minimal S-S bonding of the terminal thiols within a layer. This result provides unequivocal evidence for the bilayer formation proposed in eq 2.
Conclusions
Mixed bilayers have been formed by an electrochemical method described by eqs 1 and 2. Our electrosynthetic approach to growing bilayers of dithiols at the Au(111) surface is an improvement over traditional incubation methods using oxygen as the oxidant. The ACIS results indicate that the 1,4-BDMT monolayer is a better template for bilayer electrodeposition than the 1,6-HDT monolayer. The IR spectra give spectroscopic support to mixed-bilayer formation. The HREELS results provide direct evidence for sulfur dimer formation between an adsorbed dithiolate and one in solution. This electrochemical method can be extended to making new materials, for example, by reacting the thiolate end group of the monolayer with other thiols or metals and making hybrid systems. These films have potential for applications in molecular elec-tronics and as chemical sensors.
Acknowledgment. S.R. thanks NSERC and the University of Ottawa for scholarships. M.M. acknowledges financial support from NSERC and UQAÅM.
LA034959M
(29) Kluth, G. J.; Carraro, C.; Maboudian, R. Phys. Rev. B 1999, 59, 449.
(30) Nuzzo, R. G.; Zegarski, B. R.; Dubois, L. H. J. Am. Chem. Soc.
1987, 109, 733.
(31) Venkataramanan, M.; Murty, K. V. G. K.; Pradeep, T.; Deepali, W.; Vijayamohanan, K. Langmuir 2000, 16, 7673.
Figure 7. HREEL spectra of 1,6-HDT monolayers and bilayers at different incident energies: (a) bilayer (6 eV), (b) bilayer (3 eV), (c) monolayer (6 eV), and (d) monolayer (4 eV). Inelastic losses have been normalized to the elastic peak intensity and multiplied by 10 times. The elastic peak shown is for the monolayer at 4 eV. The inset shows the 400-600 cm-1region in greater detail.