Assessing the present and future
probability of Hurricane Harvey’s rainfall
The MIT Faculty has made this article openly available.
Please share
how this access benefits you. Your story matters.
Citation
Emanuel, Kerry. “Assessing the Present and Future Probability of
Hurricane Harvey’s Rainfall.” Proceedings of the National Academy
of Sciences 114, 48 (November 2017): 12681–12684
As Published
http://dx.doi.org/10.1073/PNAS.1716222114
Publisher
National Academy of Sciences (U.S.)
Version
Final published version
Citable link
http://hdl.handle.net/1721.1/117739
Terms of Use
Article is made available in accordance with the publisher's
policy and may be subject to US copyright law. Please refer to the
publisher's site for terms of use.
Assessing the present and future probability of
Hurricane Harvey
’s rainfall
Kerry Emanuela,1
aLorenz Center, Massachusetts Institute of Technology, Cambridge, MA 02139
Contributed by Kerry Emanuel, October 4, 2017 (sent for review September 15, 2017; reviewed by Cindy L. Bruyere, Efi Foufoula-Georgiou, and James A. Smith)
We estimate, for current and future climates, the annual probability of areally averaged hurricane rain of Hurricane Harvey’s magnitude by downscaling large numbers of tropical cyclones from three cli-mate reanalyses and six clicli-mate models. For the state of Texas, we estimate that the annual probability of 500 mm of area-integrated rainfall was about 1% in the period 1981–2000 and will increase to 18% over the period 2081–2100 under Intergovernmental Panel on Climate Change (IPCC) AR5 representative concentration pathway 8.5. If the frequency of such event is increasingly linearly between these two periods, then in 2017 the annual probability would be 6%, a sixfold increase since the late 20th century.
hurricanes
|
climate change|
floodsI
n the wake of a large disaster, it is natural to ask how likely it is that a disaster of comparable or greater magnitude will happen again. This question is especially pressing as reconstruction begins: Should buildings, homes, roads, and associated in-frastructure be built in the same place again? If so, should they be built to the same standards as before or should more be spent to make them stronger? If possible, should measures be taken to mitigate the hazard. . . for example, should vegetation be cut back to lessen fire risk, or levees or sea walls built to mitigate floods?According to data provided by Texas State Climatologist John Nielsen-Gammon, Hurricane Harvey produced the largest rain-fall of any US hurricane on record. Much of the rain fell in the greater Houston metropolitan area, a low-lying region that has seen rapid growth in recent decades. The result was the largest natural disaster the nation has seen since Hurricane Katrina of 2005, killing at least 70 people, displacing many thousands, and causing damages that are expected to rise above $150 billion (1). How likely is it that hurricane-induced flooding of Harvey’s magnitude will occur again?
Traditionally, questions like these are addressed using statis-tics of past events, augmented by concepts such as the“probable maximum precipitation,” the theoretically greatest depth of precipitation for a given duration that is physically possible over a particular drainage area at a certain time of the year. But, there are serious limitations to such an approach (2). First, the record of past events may be short, incomplete, and/or inaccurate. And second, if the underlying statistics are changing, the past may not be a good guide to the future.
Since 1899, 11 hurricanes have produced point total rainfalls in excess of 65 cm (3). Most recently, in 2015, the remnants of Hurricane Patricia dumped more than 50 cm of rain in parts of Texas. The relative rarity of rainfall of this magnitude compromises the accuracy of statistical risk as-sessments. Moreover, these data represent point measurements by rain gauges sampling very complex spatial and temporal dis-tributions, thus limiting their ability to provide a representative measure of the storm’s actual areally integrated precipitation. Streamflow measurements integrate over area and provide a more robust measure of floods, but changing land use may in-troduce streamflow trends unrelated to rainfall.
Changes in the underlying climate state further compromise statistical approaches to flood risk assessment. In particular, anthropogenic climate change is expected to lead to a greater incidence of high-intensity hurricanes, which together with rising sea level, will produce increased risk of storm surge flooding (4, 5), while hurricanes are projected to produce substantially more precipitation as the atmosphere and oceans warm (5).
For all these reasons, researchers are turning to physically based computational models to supplement statistically based risk assessment and to make projections of future risk as the climate changes. Even global models can now be run for thou-sands of years, providing far more robust statistics than most historical records, and any sampling issues are modest by com-parison. Model statistics can be quantitatively compared with historical records to help assess their accuracy. On the other hand, models are limited in spatial resolution and are forced to represent important unresolved processes parametrically. Thus, where possible, model output and historical observations should be combined judiciously to produce optimal assessments of risk. Hurricanes present a formidable challenge to risk modeling. To accurately simulate their intensity, models must have spatial reso-lutions of a few kilometers (6), but to simulate many storms models must be run over large areas and for long periods of time. Current global models have spatial resolutions that, at best, are measured in tens of kilometers, but these can only be run for a few years.
To circumvent this difficulty, the author and his colleagues developed a method of embedding a very high-resolution, spe-cialized computational hurricane model in the time-evolving coarse-resolution states of global climate analyses or models (7– 9). Basically, the technique begins by randomly seeding with weak hurricane-like disturbances the large-scale, time-evolving state given by the global climate data. These seed disturbances
Significance
Natural disasters such as the recent Hurricanes Harvey, Irma, and Maria highlight the need for quantitative estimates of the risk of such disasters. Statistically based risk assessment suffers from short records of often poor quality, and in the case of meteorological hazards, from the fact that the underlying cli-mate is changing. This study shows how a recently developed physics-based risk assessment method can be applied to assessing the probabilities of extreme hurricane rainfall, allowing for quantitative assessment of hurricane flooding risks in all locations affected by such storms, regardless of the presence or quality of historical hurricane records. Author contributions: K.E. wrote the paper.
Reviewers: C.L.B., University Corporation for Atmospheric Research; E.F.-G., University of California, Irvine; and J.A.S., Princeton University.
Conflict of interest statement: K.E. is an officer of WindRiskTech, LLC, a firm that provides hurricane risk assessments to clients worldwide. The firm also provides data sets free of charge to scientific researchers.
This open access article is distributed underCreative Commons Attribution-NonCommercial-NoDerivatives License 4.0 (CC BY-NC-ND).
1Email: [email protected]. EARTH, ATMOSPHERIC, AND PLANETARY SCIENCES
are assumed to move with the large-scale flow in which they are embedded, plus a westward and poleward component owing to planetary curvature and rotation. Their intensity is calculated using a simple, circularly symmetric hurricane model coupled to a very simple upper-ocean model to account for the effects of upper-ocean mixing of cold water to the surface. Applied to the synthetically generated tracks, this model predicts that a large majority of seed storms dissipate owing to unfavorable environ-ments. Only the“fittest” storms survive; thus, the technique re-lies on a kind of natural selection. The model is extremely fast and many thousands or tens of thousands of storms can easily be simulated. Extensive comparisons to historical events by Ema-nuel et al. (9) and subsequent papers provide confidence that the statistical properties of the simulated events are consistent with those of historical tropical cyclones.
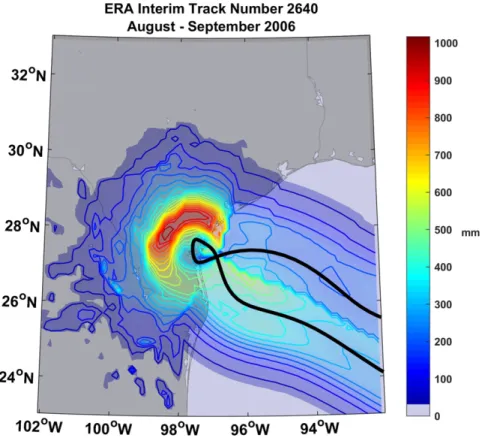
Besides providing detailed records of winds and pressures along each track, the model can also be used to estimate storm rainfall, as described in more detail by Zhu et al. (10). The rain produced by the model does not resolve individual convective storms, but can simulate the intense eyewall convection and the broad-scale precipitation outside the core. Fig. 1 shows an ex-ample of the accumulated precipitation from a simulated event that produced particularly extreme rainfall and whose track, like that of Hurricane Harvey, executed a U-turn over coastal Texas. Events like these, that linger over a particular region for a long time, tend to produce extreme precipitation. The patchiness of rainfall totals in the southwestern portion of the map is owing to the mountainous topography of northeast Mexico.
Results and Discussion
For this study, we first generated sets of 3,700 tropical cyclones over the period 1980–2016 from each of three gridded climate
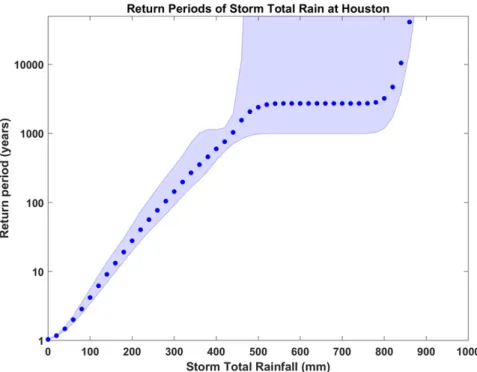
analyses: National Center for Atmospheric Research/National Centers for Environmental Prediction (NCAR/NCEP) Version 1, National Aeronautics and Space Administration Modern-Era Retrospective analysis for Research and Applications, Version 2 (MERRA2), and the European Center for Medium Range Weather Forecasts Interim Reanalysis (ERA-Interim). Each of these events was selected from much larger sets on the basis of passing within 300 km of Houston, Texas, with peak winds speeds of at least 40 kn (22 m/s) while within 300 km of Houston. The technique requires a single calibration constant (the overall seeding rate) for each climate data set; in this case that constant was chosen to yield an average of 1.5 tropical cyclones per year within 300 km of Houston, based on historical hurricane data (11). Fig. 2 shows the return periods associated with point rainfall at Houston, Texas. The return period is here defined as the inverse of the annual exceedance probability. The shading in the figure represents an SD (in frequency) up and down from the mean.
Beyond about 450 mm of rain, the distribution flattens out and the SD among the three reanalyses increases greatly. This is owing to the paucity of events with rainfall of this magnitude. Harvey’s accumulated rain, averaging over records in the greater Houston metropolitan area, was around 840 mm (12). Nevertheless, we here use the more conservative value of 500 mm to avoid the sparse tail of the distribution. According to Fig. 2, the probability of rainfall larger than this magnitude is around once in 2,000 y. By the standards of the average climate during 1981–2000, Harvey’s rainfall in Houston was “biblical” in the sense that it likely oc-curred around once since the Old Testament was written.
To assess the probability of Harvey-like rains in Texas as a whole, we used the same method to create another set of 3,700 synthetic tracks driven by NCAR/NCEP reanalyses over the period 1979–2015 and crossing any part of the Texas coastline.
Fig. 1. Storm total rainfall (millimeters) from a simulated tropical cyclone driven by climate analysis data over the period 1980–2016. This simulated event took place in August and September 2006. The track of the storm center is indicated by the back curve; it approached Texas from the southeast, moved slowly around a counterclockwise path in coastal Texas, and exited toward the southeast.
(We did not consider events entering Texas from Mexico or Louisiana.) We then calculated storm total rainfall for each event at each of 78 points constituting a grid extending from 26° N to 31° N and from 99° W to 94° W, at increments of 0.5°, but excluding points over the Gulf. For each event we de-termined the maximum storm total rainfall among the points on this grid. Fig. 3 shows the return periods for this statewide maximum hurricane rain.
The return period of at least 500 mm of rainfall in the state of Texas is about 100 y, in the climate of the period 1981–2000. How will climate change influence the probability of Harvey-like rains? To answer this question, we applied the same tech-nique to six global climate models: The National Center for Atmospheric Research CCSM4, the United Kingdom Meteoro-logical Office Hadley Center HadGEM2-ES, the Institute Pierre Simon Laplace CM5A-LR, the Japan Agency for Marine-Earth Science and Technology MIROC-5, the Max Planck Institute for Meteorology MPI-ESM-MR, and the Japan Meteorological In-stitute MRI-CGCM3. For each model, 100 events were run for each of the years 1981–2000 from the historical climate simula-tions, and again for the period 2081–2100 under Representative Concentration Pathway RCP 8.5, which corresponds to essen-tially unmitigated growth of greenhouse gas emissions.
A seventh model, the Geophysical Fluid Dynamics Laboratory CM3, was also used but yielded an increase in rain risk, from the early to the late period, that was far greater than any of the other six models and so was excluded from this analysis.
The return periods of hurricane rainfall at Houston in the late 20th and late 21st centuries are shown in Fig. 4, which may be compared with Fig. 2. The shading once again represents the SD among the six models.
The 20th century rain return periods are very similar to those calculated from reanalyses over the same period (Fig. 2), except for amounts above about 450 mm for which there are too few events in any of the event sets to make robust statistical estimates.
Rainfall in excess of 500 mm, which is around a once in 2,000-y event in the late 20th century, becomes a once in a 100-y event by
the end of this century. If we were to assume that the frequency of hurricane rain is changing linearly between the period 1981– 2000 and the period 2081–2100, then the return period of rainfall in excess of 500 m in the year 2017 would be about 325 y.
If we assume that the area covered by individual hurricane rainstorms does not change much as a result of climate change, we can use Figs. 2 and 3 to convert between Houston and Texas rain probabilities. Applying this to Fig. 4, hurricane rains in ex-cess of 500 mm in Texas would evolve from about a once in 100-y event at the end of the 20th century to a once in 5.5-y occurrence by the end of this century. A linear increase in frequency would yield a 2017 return period for rainfall in excess of 500 mm in Texas of about 16 y.
Fig. 2. Return periods of hurricane total rainfall (millimeters) at the single point of Houston, Texas, based on 3,700 simulated events each from three global climate analyses over the period 1980–2016. The dots show the three-climate-set mean and the shading shows 1 SD in storm frequency, remapped into return periods.
0 100 200 300 400 500 600 700
Storm Total Rainfall (mm)
1 10 100 1,000 10,000
Return Period (years)
Fig. 3. Return periods for hurricane storm total rainfall in the state of Texas, based on 3,700 simulated events from NCAR/NCEP reanalyses over the period 1979–2015. EARTH, ATMOSPHERIC, AND PLANETARY SCIENCES
These large increases in probabilities are consistent with expectations about what happened to tail risk as the distribu-tion of events is shifted toward the tail (13). It would be of some interest to evaluate how these increases are related to greater water vapor concentration, stronger upward motion in storms,
longer duration of events, and greater frequency of events. This is left to future work.
ACKNOWLEDGMENTS. I am grateful for additional thoughtful reviews by Michael Mann and Adam Sobel. This work was supported by the National Science Foundation under Grant AGS-1520683.
1. FOX News Network (September 6, 2017) Gov. Abbott: Harvey recovery will cost far more than Katrina [video recording, transcript]. Available at www.foxnews.com/ transcript/2017/09/06/gov-abbott-harvey-recovery-will-cost-far-more-than-katrina.html. Accessed September 12, 2017.
2. Foufoula-Georgiou E (1989) A probabilistic storm transposition approach for estimating exceedance probabilities of extreme precipitation depths. Water Resour Res 25:799–815. 3. Roth D (2009) Texas Hurricane History (National Weather Service, Camp Springs, MD). 4. Houser T, Hsiang S, Kopp R, Larsen K (2014) American Climate Prospectus: Economic
Risks in the United States (Rhodium Group LLC, New York), p 197.
5. Knutson TR, et al. (2010) Tropical cyclones and climate change. Nat Geosci 3:157–163. 6. Rotunno R, et al. (2009) Large-eddy simulation of an idealized tropical cyclone. Bull
Am Meteorol Soc 90:1783–1788.
7. Emanuel K (2006) Climate and tropical cyclone activity: A new model downscaling approach. J Clim 19:4797–4802.
8. Emanuel, K (2013) Downscaling CMIP5 climate models shows increased tropical cy-clone activity over the 21st century. Proc Natl Acad Sci USA 110:1229–12224. 9. Emanuel K, Sundararajan R, Williams J (2008) Hurricanes and global warming: Results
from downscaling IPCC AR4 simulations. Bull Am Meteorol Soc 89:347–367. 10. Zhu L, Quiring SM, Emanuel KA (2013) Estimating tropical cyclone precipitation risk in
Texas. Geophys Res Lett 40:6225–6230.
11. Knapp KR, Kruk MC, Levinson DH, Diamond HJ, Neumann CJ (2010) The International Best Track Archive for Climate Stewardship (IBTrACS): Unifying tropical cyclone best track data. Bull Am Meteorol Soc 91:363–376.
12. Harris County Flood Control District. Available at https://www.hcfcd.org/hurricane-harvey/. Accessed September 2, 2017.
13. Weitzman ML (2009) On modeling and intepreting the economics of catastrophic climate change. Rev Econ Stat 91:1–19.
Fig. 4. Return periods of hurricane total rainfall (millimeters) at the single point of Houston, Texas, based on 3,700 simulated events each from six global climate models over the period 1981–2000 from historical simulations (blue), and 2081–2100 from RCP 8.5 simulations (red). The dots show the six-climate-set mean and the shading shows 1 SD in storm frequency, remapped into return periods.