Assessing the Impacts of Increasing Transmission Capacity on
the Electric Power Sector in New England
by
Christoph Tries
B.Sc. Industrial Engineering
Technische Universitat Darmstadt, Darmstadt, Germany, 2014
SUBMITTED TO THE INSTITUTE FOR DATA, SYSTEMS, AND SOCIETY IN PARTIAL FULFILLMENT OF
THE REQUIREMENTS FOR THE DEGREE OF
MASTER OF SCIENCE IN TECHNOLOGY AND POLICY
AT THE
MASSACHUSETTS INSTITUTE OF TECHNOLOGY
JUNE 2018
2018 Massachusetts Institute of Technology. All rights reserved.
Signature of Author
Certified by
Signature redacted
Institute for Data, Systems, and Society
May 25, 2018
Signature
redacted"-Sergey Paltsev Senior Research Scientist, int Program on the Science and Policy of Global Change Thesis Supervisor
Certified by
Accepted by
MASSACHUSETS INSTITUTE
OF TECHNOLOGYJUN 0
5
2018
LIBRARIES
Signature redacted,
(7
Jennifer Morris
R
earch Scientist, MIT Joint Program on the Science and Policy of Global Change
Thesis Supervisor
Signature redacted
Munther Dahleh
William A. Coolidge Professor, Electrical Engineering and Computer Science
(of0
<jTHIS PAGE IS INTENTIONALLY LEFT BLANK
ABSTRACT
This thesis explores the evolution of the electric power sector in New England under the expansion of transmission capacity and under policy with increasing Clean Energy Standards (CES). I use EleMod, a Capacity Expansion Planning model, to compare (1) the reference case of current transmission assets, (2) increasing transmission interface capacities within New England, (3) increasing interconnection capacities with Canada, and (4) both capacity expansions. Transmission expansion allows electricity trade between states and enables them to take advantage of localized, intermittent resources like wind power. Increasing the interconnection capacity with Canada allows the system to optimally allocate the available hydropower energy for imports in the hours of highest net demand. Both transmission expansions together make even stronger use of their contributions.
For the capacity expansion model, I choose a set of generation technologies available in New England, and supply cost and operational data from public domain sources. My contributions to EleMod include: (1) the representation of transmission interfaces for New England; (2) the addition of an CES policy standard forcing generation shares from a subset of CES-eligible resources; (3) the modeling of an external hydro reservoir resource in Canada that can be used to supply the load in New England based on cross-border interconnection constraints and the total available energy per year; and (4) the detailed state-level representation of the New England power sector with generation technologies, installed capacities, transmission interface capacities, and CES targets.
Policy scenarios increase CES from an average of 25% in 2018 in the base scenario to 95% in 2050 in the decarbonization scenario. Through all policy scenarios, combined-cycle gas plants (GasCC) with carbon capture and storage (CCS) technology dominate the capacity expansions. Increases in transmission capacity lead to higher shares of wind in generation, especially when both transmission and interconnection are expanded. Natural gas, in the form of GasCC with and without CCS, takes shares of the generation mix of up to 85% by 2050. Thus, I also assess the role of pipeline capacities into New England. Because other natural gas uses like residential heating demand have priority over generators, gas-fired power plants cannot expect to meet all their demand during critical periods of shortage in the winter. However, this issue is part of a larger integrated resource planning process.
Both transmission and interconnection expansion reduce total system costs by an annual 3.95% and 4.29%, respectively. Because transmission costs are not included in the model, I separately assess the costs and benefits of both transmission expansion scenarios. Transmission expansions from Maine to Massachusetts of 2,000 MW and interconnection expansions to Canada of 3,000 MW and 4,500 MW from Maine and Vermont, respectively, allow for optimal allocation of flows across lines in over 90% of the hours. For interconnection, the calculation estimates costs to be about 1% higher than the benefits, and for transmission within the region the benefits exceed the costs by about 40%.
ABSTRACT... 3
1. INTRODUCTION ... 6
2. THE ELECTRIC POW ER SECTOR IN NEW ENGLAND ... 9
2.1. EMISSIONS REDUCTIONS AND RENEWABLE PORTFOLIO STANDARDS... 9
2.2. ELECTRICITY GENERATION ... 13
2.3. OPPORTUNITIES FOR LOW-CARBON GENERATION ... 15
3. M ODELING THE ELECTRIC POW ER SECTOR ... 19
3.1. DECARBONIZATION OF THE ELECTRIC POW ER SECTOR... 19
3.2. CAPACITY EXPANSION PLANNING ... 22
4. ELEM OD: A CAPACITY EXPANSION PLANNING M ODEL ... 25
4.1. CORE STRUCTURE OF ELEM OD ... 26
4.1.1. Technologies ... 26
4.1.2. Cost and Operational Param eters ... 27
4.1.3. Tem poral Scope ... 28
4.1.4. Objective Function ... 29
4.1.5. EleM od Data ... 30
4.2. M ODEL CONTRIBUTIONS ... 31
4.2.1. Representation of New England Power Sector ... 32
4.2.2. Canadian Hydro Reservoir... 34
4.2.3. Transm ission Grid Representation ... 35
4.2.4. Clean Energy Standard... 37
5. SCENARIOS ... 38
5.1. CES SCENARIOS ... 38
5.2. TRANSMISSION SCENARIOS ... 40
6. RESULTS AND DISUCSSION ... 40
6.1. BENCHMARK AND CALIBRATION ... 42
6.2. THE REFERE NCE CASE ... 43
6.2.1. Total System Cost...44
6.2.2. Installed Capacities...45
6.2.3. Generation M ix...47
6.3. INCREASED INTERCONNECTION W ITH CANADA ... 48
6.4. INCREASED TRANSMISSION BETW EEN NEW ENGLAND STATES ... 51
6.5. TRANSMISSION CAPACITY AND COSTS ... 54
6.6. CES AND DECARBONIZATION...57
6.7. INCREASING ALL TRANSMISSION CAPACITIES...58
6.8. GAS PIPELINE CONSTRAINTS...62
7. RECOM M ENDATIONS AND CONCLUSION ... 63
APPENDIX A - TECHNOLOGY M ATCHING...66
APPENDIX B - COST AND OPERATIONAL PARAMETERS FOR CONVENTIONAL RESOURCES...68
APPENDIX C - COST AND OPERATIONAL PARAMETERS FOR RENEWABLE RESOURCES...68
1. INTRODUCTION
The scientific consensus is clear that the effects of man-made climate change are real, and if unmitigated will potentially be drastic (IPCC 2014). In response to this challenge, 195 UN Member States signed the Paris Agreement, an international treaty with the ambitious goal to keep the increase of average global temperatures under 2*C. This signifies the acknowledgement of the problem of climate change at the highest levels of global society, and, even more important, shows the emergence of a plan to take action. Decarbonization has become the widely agreed upon strategy to effectively combat climate change over the course of the 21st century (Carley 2011; Hilbler & Lbschel 2013). The electric power sector in particular is expected to play a critical role in reducing emissions (Williams et al. 2012). This thesis focuses on the issues related to decarbonization of electricity.
In the United States, federal policy addressing climate change has been difficult to implement and the government's future role in the Paris Agreement is uncertain. However, many states are dedicated to combatting climate change. New England, the region including the six Northeastern-most states of the US, has set ambitious emissions reductions targets (35-45% below 1990 levels by 2030). The six states (Connecticut, Maine, Massachusetts, New Hampshire, Rhode Island, and Vermont) have also committed to stringent emissions reductions for the electric power sector (30% below 2020 levels by 2030) through the Regional Greenhouse Gas Initiative (RGGI 2017). While the RGGI carbon trading mechanism is in place, its effect on emissions has been limited thus far due to low permit prices. However, another policy measure-Renewable Portfolio Standards (RPS) - has been playing a key role in meeting carbon emissions reductions goals in the electric power sector. Across the United States, the electric power sector contributed 35.2% of total emissions in 2016 (down from an average of 40% of emissions in the 2000s) (IEA 2018). 29 states, including those in New England, have passed RPS policies to bring low-carbon generation into the mix and lower the emissions from the electric power sector. Collectively, state RPS policies have contributed more than 60% of all renewable generation since 2000, and states successfully meet their annual targets around 95% of the time (Barbose 2016).
A similar policy tool is the Clean Energy Standard (CES). As a policy, CES works exactly like an RPS, but it is more inclusive in the types of technologies it accepts to meet the proposed standard of electricity generation, focusing on all technologies that can deliver low-carbon electricity instead of providing support
only for a select few resources like an RPS. In comparison to a cap-and-trade policy, CES performs similarly, and in some cases it is even more cost-effective than cap-and-trade (Goulder, Hafstead & Williams 2014). In comparision to an RPS, CES is more cost-effective as it includes a wider range of technologies to choose from in order to minimize costs. CES received wide attention when President Obama offered the goal of 80% clean energy by 2035 in his State of the Union Address in 2011, and the Senate Committee on Energy and Natural Resources followed this proposal up with a white paper on CES (Bingaman & Murkowski 2011). Some states, such as New York, have already moved to a CES instead of an RPS. Moving forward, CES is likely to be the policy solution of choice to advance the decarbonization of the electric power sector.
Decarbonization is likely to be the determining factor for transitions in the electric power sector in both the near- and long-term, and this is also true for New England. For this reason, I conduct my research on the electrictric power sector in New England under policy scenarios encouraging decarbonization. I therefore analyze three policy scenarios: (1) a baseline CES requirement equivalent to current RPS commitments by New England states (CESbase), which range from 13% in Rhode Island to 19.1% in Massachusetts and 55% in Vermont; (2) an increased CES trajectory with further commitments by all states, similar to Massachusetts' commitment to increase its RPS by 1% annually (CEShigh); and (3) a set of CES requirements that meet decarbonization targets for the electric power sector by requiring 95% renewable electricity by 2050 (CESdecarb). While the magnitudes of commitments to CES, RPS or RGGI are highly uncertain, these scenarios illustrate three possible trajectories of the strength of climate change policies that we may reasonably expect through 2050.
As clean energy targets increase for New England, there are several opportunities for the region to decrease the carbon intensity of its electricity, including: developing wind power on-shore in Maine or off-shore in Massachusetts; using more biomass from Maine, New Hampshire, and Vermont; continuing to increase natural gas, potentially in combination with carbon capture and storage (CCS); building advanced nuclear reactors; and importing hydro power from Quebec. In my analysis I examine a selection of these technological options.
Crucially, many of these options require increased transmission capacities. Wind power and biomass are highly localized resources and additional transmission connecting them to load centers would be required. Similarly, regional integration with Canada to allow for larger hydro import quantities during
peak hours would also require new transmission lines. These two stories are key pieces of the transition to a decarbonized electric power sector: expansion of transmission capacity on the intra-regional level can take advantage of localized generation resources (Lund 2005; S6der et al. 2007), and efforts of regional electricity market integration, primarily enabled by expansion of interconnector transmission lines, can enable the intra-regional co-optimization of electric power systems (Pellini 2012).
The purpose of this thesis is thus to explore how increased transmission capacity within New England and connecting to Canada impacts the evolution and cost of the electric power sector in New England under policy scenarios of increased CES target trajectories.
To do so, I adapt an electricity capacity expansion model EleMod (Tapia-Ahumada et al. 2014) to represent individual states in New England. I add a representation of hydro resources in Canada as well as the current interconnection capabilities to model the benefits from increased integration. I explore scenarios with increased transmission capacities between New England states to take advantage of localized resources (TransNEng), and increased transmission capacity with Canada to incorporate the benefits of regional hydro-thermal integration (TransCan), which I compare to the current levels of transmission capacity (TransRe). Finally, I track the evolution of the resource mix and total electric power sector costs until 2050 across the three CES policy scenarios (CESbase, CEShigh, and CESdecarb).
My thesis is structured as follows: In Chapter 2 I present an in-depth look into the New England electric power sector and its efforts of emissions reductions (see Section 2.1), the landscape of electricity generation (see Section 0), and specifically the low-carbon generation technologies that might play a role in decarbonization (see Section 2.3). Then, I conduct a literature review on approaches to studying decarbonization scenarios in the electric power sector (see Section 3.1), and I review the methodology of choice for my analysis--Capacity Expansion Planning (CEP)-in Section 3.2. CEP is widely used to study electric power sector developments, and I provide an overview of various CEP studies conducted by research groups world-wide and identify the shortcomings which I aim to address with my modeling approach. In Chapter 4, I introduce the linear optimization model EleMod which I use to gain insight into long-term capacity expansion investments in New England, and the additions I made to the model. In Chapter 5, I introduce the scenarios which I use in my analysis: by comparing four transmission scenarios, I quantify the benefits of expanding the transmission grid in New England and the interconnection with
Canada under policy scenarios with different levels of CES targets. Then, in Chapter 6, I present the results of my exploration of the effect of hydropower imports from Canada and increased trade within the region on long-term capacity expansion decisions and total system costs of the electric power sector in New England. Across all scenarios, I also evaluate the electricity trade flows to estimate the necessary transmission capacity expansion and conduct a first-order cost-benefit calculation. Furthermore, I evaluate the role of natural gas by tracking the fuel demand across the scenarios and comparing it with existing pipeline capacities. I conclude in Chapter 7 by offering insights and recommendations for the evolution of the electric power sector in New England.
2. THE ELECTRIC POWER SECTOR IN NEW ENGLAND
In this chapter, I review the state of the electric power sector in New England. I start by introducing the emissions reductions efforts through the Regional Greenhouse Gas Initiative (RGGI), Renewable Portfolio Standards (RPS) and Clean Energy Standards (CES) in New England (see section 2.1). I also make the case to use CES as a policy to analyze the stringent decarbonization scenarios in my analysis. Then, I provide an overview of electricity generation in New England (see section 0), focusing on the recent transitions from coal to gas-fired power plants, and the partial phase-out of nuclear power. Finally, I survey the available low-carbon generation technologies in New England for the current transition to more low-carbon generation sources (see section 2.3), among them wind power, natural gas with CCS technology, biomass (with or without CCS), and hydropower imports from Canada.
2.1. Emissions Reductions and Renewable Portfolio Standards
New England has stated its climate goals in the joint declaration of the Conference of New England Governors and Eastern Canadian Premiers (NEG-ECP) in 2001. The emissions target for 2010 (returning to 1990 emissions levels) was surpassed, and the region is on track to achieve its 2020 target of reducing emissions 10% below 1990 levels (Coalition of Northeastern Governors & Eastern Canadian Secretariat). The targets continue to increase in stringency over time, with a planned reduction by 2030 of 35 - 45% below 1990 levels. In 2050, the end of the time horizon for my study, the region projects to reduce overall economy emissions to 75 - 85% below 2001 levels, which are less than 87.5 Mt (million metric tonnes) of CO2 equivalents.
Table 1: New England greenhouse gas emissions targets and status of progress
Year Target Mt of CO
2equivalent Status
1990 - 330
-2010 Return to 1990 levels 330 4.1% below
2020 10% below 1990 levels 297 On track
2030 35 - 45% below 1990 levels 181.5 - 214.5 2050 75 - 85% below 1990 levels 52.5 - 87.5
To achieve emissions reductions, economists' favorite tool is carbon pricing (Newcomer et al. 2008;
Weitzman 2014). There are two basic ways to put a price on carbon: implement a carbon tax or implement
a cap and trade market. For the electric power sector, New England has implemented the latter with its Regional Greenhouse Gas Initiative (RGGI). Together with Delaware, Maryland, and New York, the New England states implemented this cap-and-trade regime, which sets a total budget for CO2 emissions from all conventional power plants over 25 MW. Allowances that permit a power plant to emit CO2 need to be
acquired either in one of the quarterly auctions, or through trades from other allowance-holders.
However, RGGI is deemed to have been of limited effectiveness thus far. After initial low permit prices due to too high carbon budgets that were not exhausted by the industry, the initiative received a boost when states agreed to reduce the budget (Ramseur 2017). After an initial increase in auction results, however, the permit prices have since plummeted again to very low clearing prices (see Figure 1).
Regional Greenhouse Gas Initiative (RGGI) allowance clearing price dollars per short ton of carbon dioxide
8 7 6 March 2017 auction: 4 $3.00 per short ton C02 3 2 1 0,
2008
2009
2010
2011
2012
2013
2014
2015
2016
2017
c9
Figure 1: RGGI allowance clearing price (EIA 2017a)
The fact that RGGI has not been able to tighten carbon budgets to levels where carbon price auctions make a meaningful difference on emissions from the electric power sector is at least partly due to some of carbon pricing's practical drawbacks. Strong opposition from industry groups who are under threat to lose valuable assets under a carbon pricing regime can take away the teeth of a carbon pricing instrument
through influence on the technical details like which carbon budgets are set (Jenkins 2014).
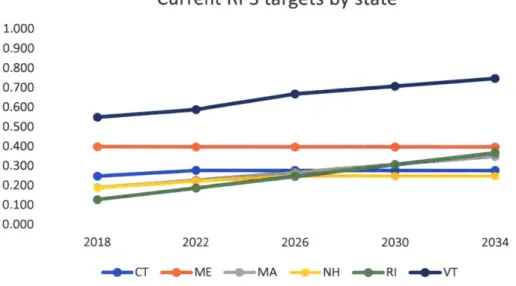
As an alternative policy measure, states have also introduced RPS which have successfully reduced emissions in the electric power sector. An RPS requires that a certain percentage of electricity generation come from specified renewable. RPS policies have been widely and successfully employed in the US since the early 2000s (Rabe 2007; Wiser & Barbose 2008). All New England states have implemented RPS targets for their electricity sector, mandating their utilities to buy Renewable Energy Credits (RECs) for a given percentage of electricity generation, with that percentage differing by state (see Figure 2). Which technologies qualify as "renewable" also varies by state, but commonly include wind, solar, biomass, and new hydro installations.
Current RPS targets by state
1.000 0.900 0.800 0.700 0.600 0.500 0.200 0.100 0.000 2018 2022 2026 2030 2034 4CT - ME -- MA --NH *RI 0VT
Figure 2: Current RPS targets in New England by state (ISO-NE 2016)
There are indications that for the future, CES will be the policy solution of choice to advance the decarbonization of the electric power sector in New England. CES and RPS are almost the same. They both mandate that a certain percentage of electricity generation must be met by generation resources from an eligible portfolio, and these resources receive credits for generating energy which they can sell on a
secondary market. The key difference between CES and RPS is the makeup of their portfolios. Whereas in an RPS portfolio, states almost exclusively include "true" renewable sources like wind, solar, and in some cases biomass, CES offers credits to all types of resources which emit low amounts of carbon in power generation, such as gas or coal with CCS, advanced nuclear or hydro.
New York, a neighboring state to New England, which also supplies renewable energy credits to the New England markets,1 has adopted a new CES policy in 2016 to replace its expired RPS policy. The new CES mandates 50% clean energy by 2030, which can be supplied by renewable generation eligible before under the RPS, as well as co-fire generation at its rate of biomass as a fuel, nuclear and hydro plants. A CES yields emissions reductions, but is more agnostic of technology and does not "pick winners and losers" as deliberately as an RPS (Victor & Yanosek 2011). In addition, cost reductions in comparison to an RPS provide a good incentive for policy-makers to choose CES as a strategy for decarbonization.
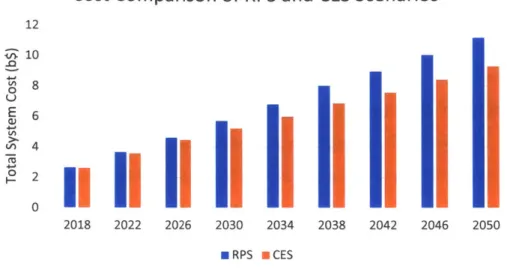
In order to assess the difference in costs between an RPS and a CES, I conduct two exploratory runs of my model. RPS-eligible technologies are wind, solar, and hydro resources in Maine.2
CES-eligible technologies include the RPS-eligible technologies as well as biomass, natural gas combined-cycle plants with carbon capture and storage (GasCCS), and coal with CCS (CoalCCS).3
The results show that the application of a CES leads to significantly lower system costs, totaling 17% or $1.89 billion for the year of 2050 (see Figure 1). Especially considering the dim outlook regarding a functioning cap-and-trade program anywhere between Brussels and California, CES is a second-best option worth exploring.
For these reasons, I construct my three policy scenarios based on CES targets rather than an RPS or total emissions reductions in the form of a cap on RGGI emissions allowances.
1 NEPOOL GIS, the REC accrediting institution, accepts renewable energy credits from New York, but also from
Delaware, Maryland, New Jersey, and Pennsylvania.
2 This closely replicates the eligibility of technologies for RPS across the New England states. Maine is the only
state which counts in-state hydro resource towards its RPS.
3 Due to cost estimates for CCS technologies that have long been too optimistic, CCS technologies are only
modeled to become available at their current cost estimates after 2030. 12
Cost Comparison of RPS and CES Scenarios
12 10 v)4 0 2 0 2018 2022 2026 2030 2034 2038 2042 2046 2050 ERPS ECESFigure 3: Comparison of Total System Cost for the New England electric power sector in RPS and CES scenarios (in billion-$)
2.2.
Electricity Generation
Currently, New England relies largely on natural gas and nuclear power for its electricity generation-over 78% of electricity in New England is generated by these two technologies (see Table 2). They also make up almost 67% of the net energy for load, with imports from New York and Canada making up an additional 16.7%.
Table 2: New England's resource mix in 2017 (ISO-NE 2018e)
GWh % of Generation % of Net Energy for Load (NEL)
Total Generation 102,534 100.0% 84.7% Gas 49,198 48.0% 40.6% Nuclear 31,538 30.8% 26.1% Renewables" 10,830 10.6% 8.9% Hydro 8,572 8.4% 7.1% Coal 1,684 1.6% 1.4% Oil 696 0.7% 0.6% Other 14 0.01% 0.01%
Net Flow over External Ties 20,243 16.7%
Quebec 14,401
New Brunswick 4,306
' Note that 8.9% NEL of Renewables mainly include wind (2.7%), Refuse/Municipal Solid Waste (2.6%), and Wood (2.5%). Solar as the fourth-largest contributor provides 0.7%.
New York 1,536
Pumping Load -1,716 -1.4%
1Net Energy for Load 1121,061 100.00%
A large transition of New England's electricity generation sector started around 2000. Environmental policies and, arguably more important, low natural gas prices, have pushed out coal and petroleum as the
primary energy providers for electricity generation, and natural gas has largely taken its place. Between 2000
and 2016, oil fell from 8.2% to 0.5% and coal from 17.9% to 2.4%, while natural gas increased from 13.7% to 49.3% (see Figure 4).
New England Shifted from Oil and Coal to Natural Gas
49.3% 31.2% 31.0% 17.9% 13.7% 8.2% .5 2002.4%
Nuclear Oil Coal Natural Gas
M 2000 M 2016
Figure 4: Shift from Coal & Oil to Natural Gas between 2000 and 2016 (ISO-NE 2018b)
The close ties of the electricity sector to the natural gas sector have proven difficult in recent winters, when prolonged cold temperatures hit the region and the demand for gas-fired heating increases (Babula & Petak 2014; Hibbard & Schatzki 2012; Wang et al. 2017) and competes with the demand for gas-fired power plants. The heating demand from utilities serving their customers is met with priority. At the same time, the demand for gas in the electric power sector also increases, as electric heating appliances are connected and increase electricity demand. As a result, during a cold spell gas plants face increased demand for gas, with decreased net supply capacity through the pipeline network due to prioritized utility gas withdrawals. For the electric power sector, this implies that other technologies that do not rely on gas are dispatched. In cold winter days these are increasingly coal and petroleum-fired power plants (ISO-NE 2018f). While this leads to a short-term increase in gas prices as well as electricity prices which hurt
consumers, this is not a severe problem for the electric power sector as of now. Moving forward, it is crucial to monitor that either sufficient non-natural gas-fired power plants are in reserve capacity for a cold spell, or otherwise that pipelines into New England or LNG terminals are expanded accordingly to provide the necessary reserves for the electric power sector.
In these crucial times, the pipeline network of New England struggles to supply sufficient fuel due to its geographical location. With no natural gas wells in the region, it relies entirely on imports. Most of the natural gas imports come from New York state, and only a small amount from Canada, all through five pipelines feeding the region. The total pipeline capacity for the winter of 2024/25 was recently forecasted by ISO New England to amount to 3.86 billion cubic feet per day (Bcf/d)5 (ISO-NE 20180. In addition, three LNG terminals exist where liquified natural gas can be received from an ocean tanker and injected into the regional pipeline system. These three terminals have a joint-maximal capacity of 2.04 Bcf/d, even though the all-time recorded maximum injection per day was 1.25 Bcf (ISO-NE 2018f). Thus, New England has access to slightly less than 6 Bcf/d of natural gas. For a region which relies as much on gas-fired electricity production as New England, this is not a lot. This is the reason why periodic discussions center around expanding the pipeline capacities bringing fuel into New England. As mentioned above, from the standpoint of a systems planner this is something to be aware of, especially if the region has the ambition to engage in integrated energy and resource planning.
2.3. Opportunities for Low-Carbon Generation
To meet the challenge of decarbonizing the electric power sector, every region must make use of the resources at its disposal. The availability and quality of renewable resources like wind, solar, hydropower, or biomass vary strongly between regions. Some regions in the world, like Norway, Iceland and Costa Rica, already have almost completely decarbonized electric power sectors largely thanks to the coincidence that the most inexpensive electricity generating technologies in these countries are renewable sources. But other regions also need to assess their resources, and use tools like carbon pricing as well as CES and RPS policies which affect the merit order by favoring natural gas over coal-fired generation technologies (Delarue,
' ISO New England discounts one of the pipelines, the Maritimes and Northeast pipeline between Canada and Maine, because under certain, not infrequent market conditions it will transport natural gas from New England into Canada.
Voorspools & D'haeseleer 2008), and enable the integration of renewable resources (Smith et al. 2007). Furthermore, regional integration is a very useful tool to share the benefit of location-specific natural occurrence of renewable resources.
Following this blueprint, New England needs to assess its own resources and its potential for regional integration with its neighbors. The renewable resource in New England with the largest potential installed capacity is wind generation, mostly in Northern and Western Maine. The Northern states, Maine, Vermont, and New Hampshire, all use biomass to a substantially larger degrees than the national average of the United States. This can be an important resource, especially if combined with CCS technology. Natural gas as a well-established resource in New England can also become a useful tool for its decarbonization efforts if natural gas generation is combined with CCS at high capture levels. Taking advantage of all of these resources across the region will require the expansion of transmission capacities for electricity between load centers and the locations of generation resources.
New England must also look to regional integration efforts to access resources available in its neighbors' territories in New York and Canada. While stronger interconnection with New York can enable better synchronization of the two electricity markets and provide gains from trade, the more interesting connection is with the Canadian province of Quebec. Quebec's electricity generation is 95% hydropower, which is an excellent complement to the strongly thermal power sector in New England. Expanded interconnection capacity would be required to take fuller advantage of this resource. Taking better advantage of hydro from Canada can come on two forms: either through higher energy imports per year, providing more low-carbon electricity to the region; or through better allocation of the same annual amount of energy by using it purposefully in peak hours, when the value contributed to the system by hydro imports is greatest.
Wind is seen as one of the major contributors for electricity generation in the US in the 2 1't century,
with projects evaluating the feasibility of long-range transmission lines transporting wind power from the Great Plains to the load centers at the East Coast (Frew et al. 2016). Similarly, wind power will play an important role in the future of New England's electric power sector (GE Energy, EnerNex Corporation & AWS Truepower 2010). Rather than relying on transmission from the Great Plains, New England can integrate wind resources from Maine into its electricity mix. Maine provides up to 69 GW of wind power
potential, which is massive compared with 923 MW of currently installed capacity in the state (U.S.
Department of Energy 2018). These resources are in relative proximity to load centers in Massachusetts and Connecticut. However, to unlock this potential renewable resource for the New England region, transmission grid expansions at the regional level need to be envisioned.
Natural gas has developed very strongly since the 2000s. And even currently, New England has large amounts of natural gas-fired power plants in its Interconnection Queue, which keeps track of all proposed projects that plan to connect to the electric grid in the future (ISO-NE 2018e). Furthermore, recent years have had strong discussions about pipeline additions into New England, as well as the addition of new LNG terminals. This is especially a recurring phenomenon every January or February, when a longer cold period hits New England. Other techno-economic power sector research suggests that natural gas can play a viable role on the path to 50-65% of emissions reductions in the electric power sector (Jenkins & Thernstrom 2017). However, New England's stated emissions goals are more stringent than these levels, and are at levels which are commonly associated with emissions reductions of over 90% in the power sector (Krey et al. 2014). There is a compelling storyline about the role of gas in a decarbonized power sector. This string of research focuses on the complementarity of the fast-ramping capabilities of natural gas with the intermittent nature of renewable sources like wind and solar (Lee et al. 2012; Paltsev et al. 2011), and therefore sees an important role for natural gas in the electric power sector even under decarbonization.
Biomass might be one of the key resources for any region on its path to a decarbonized power sector as it is dispatchable, and when paired with CCS even offers the opportunity to produce negative carbon emissions (Rhodes & Keith 2008). And in New England, biomass already is an established electricity generating technology. Maine has a share of 18.9% of electricity generated from biomass, New Hampshire 8.3%, Massachusetts 3.8% and Connecticut 2.3% (EIA 2017a). This is an outsized role compared to a national average of 1.1%. Nonetheless, there are some serious implications of biomass deployed on a large scale in the electric power sector. These can include inadvertent emissions increases through land-use change (Fargione et al. 2008), and carbon stock accounting over the lifecycle of the biomass which might end up not being carbon-neutral (Johnson 2009).
Another technology that needs to be considered as playing a potentially important role in New England's future electric power sector is carbon capture and storage (CCS) for coal or natural gas plants, if
the technology becomes commercially viable and available. It currently faces a variety of technical, economic and public acceptance challenges. However, a crucial step by the U.S. government in early 2018 was the passing of a tax credit for CCS projects (Rathi 2018), which could provide the necessary push for the technology to be deployed in more than just pilot studies.
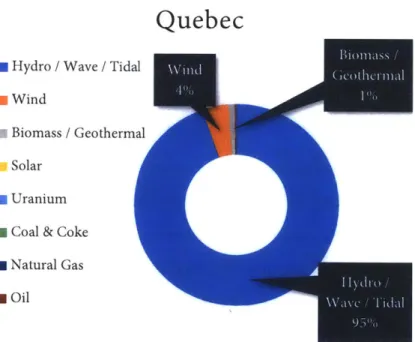
Finally, hydropower imports from Canada play a large role for New England. On average over the last five years, net imports from Canada were 17,483.2 GWh' (ISO-NE 2018e), which accounts for around 16% of the net load in New England. Over 75% of these imports come from Quebec, which also has the majority of interconnection capacity to New England. Quebec is connected to New England via the New England Phase
II (1400 MW) and Highgate (200 MW) transmission lines. The electric power sector in Quebec is 95%
composed of hydropower (see Figure 5), and one of my contributions in this thesis is to implement this techno-economic feature of New England's electric power sector in EleMod, the electricity capacity expansion model used in this work.
Quebec
0
Hydro / Wave / Tidal m Wind* Biomass / Geothermal
,i Solar
0 Uranium 0 Coal & Coke * Natural Gas M Oil
Figure 5: Quebec's resource mix (National Energy Board 2018)
Hydropower imports from Canada serve two purposes. First, they represent a low-carbon electricity source that could directly replace carbon-intensive generation. However, hydro imports do not currently
qualify as counting toward most CES or RPS targets. Second, and the focus in my analysis, hydro imports have "peak-shaving" ability which can impact the evolution of the electric power sector. The management of reservoir hydropower installations is based on the value of stored energy (Simopoulos, Kavatza & Vournas 2007). To the extent that the release of water to produce electricity is not precluded due to other environmental factors and resource concerns7, the energy from hydropower will be used to supply to the system when it needs it most, i.e. in the hours of highest prices. These hours mostly coincide with the peak of net demand (demand minus non-dispatchable generation), and thus the pattern of use for reservoir hydropower is also called "peak shaving", since it takes off the peaks and rather transforms them into plateaus (Bushnell 2003; Simopoulos, Kavatza & Vournas 2007).
Thus, hydropower is imported from Canada into New England to make use of surplus electricity stored in the Canadian reservoirs during hours of scarce supply, or high net load, in New England, thereby reducing the peak demand. As a result, hydropower imports into New England may result in lower demand for total installed capacity for the electric power sector, and in lower dispatch of peaking technology resources, which are currently gas-fired power plants.
3. MODELING THE ELECTRIC POWER SECTOR
3.1. Decarbonization of the Electric Power Sector
Silberglitt et al. (2003) note that the diversity of technical, social and economic, as well as policy and regulatory characteristics have "led to the proliferation of energy scenarios" (Silberglitt, Hove & Shulman 2003). With decarbonization becoming increasingly more important in the combating of climate change, decarbonization scenarios are even more numerous today. There exist a myriad of models and approaches to capture decarbonization scenarios of the electric power sector. However, there is no clear classification in the research field of electric power sector modeling for decarbonization scenarios (Loftus et al. 2015). I start by reviewing a series of recent model comparison studies that were undertaken to illuminate recent developments in modeling efforts of decarbonization scenarios. The studies each analyze between three and
' The release of water from hydro reservoirs to generate electricity is subject to other constraints like river management and other water uses.
18 individual models that span a variety of classifications. Each model comparison study makes an attempt at classifying the models they examine, but they do not agree on one overarching typology. Nonetheless, some similarities are apparent in the classification schemes, and after review of the five studies I identify the three archetypes of energy system models that are most widely and successfully applied.
Capros et al. (Capros et al. 2014) explore costs for EU energy system transformation based on the EU Roadmap 2050 (80% GHG emissions reduction targets). They analyze decarbonization strategies, energy system restructuring, associated costs and further macroeconomic implications. All their considered models are widely applied large-scale models. They classify them into (1) partial equilibrium technology-rich energy system models, (2) energy models on specific sectors, (3) comprehensive computable general equilibrium models, and (4) macro-econometric models. The partial equilibrium energy system models focus on the representation of energy technologies, the engineering characteristics and economic markets. However, they do not provide feedback loops between the energy and other sectors of the economy. Macroeconomic models on the other hand display all sectors of the economy, while they lack more specific details of the technological systems of the energy sector (Capros et al. 2014).
Cochran, Mai & Bazilian (Cochran, Mai & Bazilian 2014) from NREL compare high penetration renewable energy scenarios from regions around the globe. The models they examine include both power sector and economy-wide models.
Krey et al. (Krey et al. 2014) report on the results of the Energy Modeling Forum (EMF) 22 by comparing all EMF participants' models. All models run a common set of scenarios, and the results are compared. The main way in which they differ are "decarbonization of energy supply, increasing the use of low-carbon energy carriers in end-use, and reduction of energy use" (Krey et al. 2014). They classify the models as either energy-economic or integrated assessment models (IAM). Also, they note that the major differences between the models in methodology lies in (1) the representation of the energy system, and (2) the CO2 budgets that are made available to the model by the modelers.
Loftus et al. (Loftus et al. 2015) "assess a set of scenarios constructed using a diverse range of methods, including IAMs but also several other influential studies constructed using different methods" (Loftus et al. 2015). All their models focus on the decarbonization of the electricity sector, which makes it particularly relevant for my work. Their classification breaks models down into four groups: (1) top-down
based back-casting, (2) top-down integrated assessment modeling, (3) bottom-up energy systems modeling, and (4) bottom-up techno-economic assessments.
Luderer et al. (Luderer et al. 2012) compare three models, two intertemporal optimization models as well as a recursive dynamic computable general equilibrium model. All three models are "hybrids" (Luderer et al. 2012), meaning they combine a top-down view of the economic sectors with a bottom-up view of technological details of the energy system.
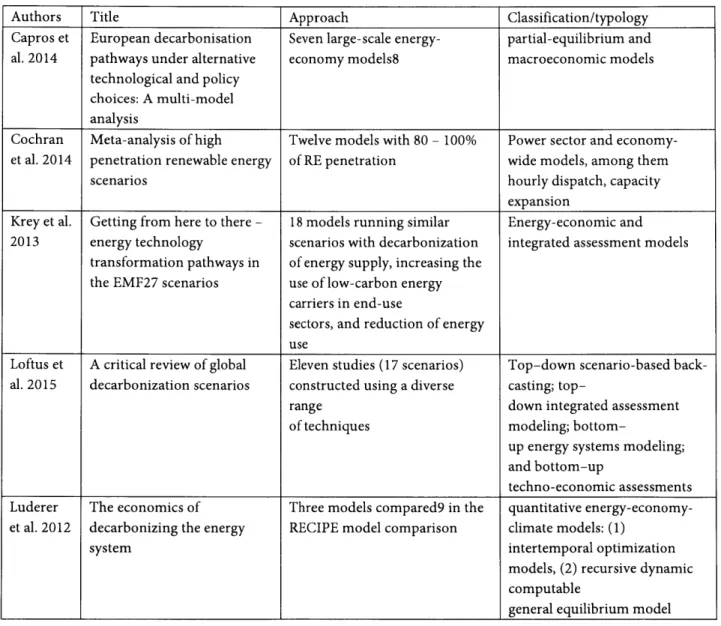
Table 3: Model comparison studies analyzed to identify archetypes of models to simulate and inform decarbonization strategies
Authors Title Approach Classification/typology
Capros et European decarbonisation Seven large-scale energy- partial-equilibrium and al. 2014 pathways under alternative economy models8 macroeconomic models
technological and policy
choices: A multi-model
analysis
Cochran Meta-analysis of high Twelve models with 80 - 100% Power sector and economy-et al. 2014 penetration renewable energy of RE penetration wide models, among them
scenarios hourly dispatch, capacity
expansion
Krey et al. Getting from here to there - 18 models running similar Energy-economic and 2013 energy technology scenarios with decarbonization integrated assessment models
transformation pathways in of energy supply, increasing the
the EMF27 scenarios use of low-carbon energy carriers in end-use
sectors, and reduction of energy
use
Loftus et A critical review of global Eleven studies (17 scenarios) Top-down scenario-based
back-al. 2015 decarbonization scenarios constructed using a diverse casting;
top-range down integrated assessment
of techniques modeling;
bottom-up energy systems modeling; and bottom-up
techno-economic assessments
Luderer The economics of Three models compared9 in the quantitative
energy-economy-et al. 2012 decarbonizing the energy RECIPE model comparison climate models: (1)
system intertemporal optimization
models, (2) recursive dynamic
computable
general equilibrium model
8
PRIMES, TIMES-PanEu, GEM-E3, NEMESIS, WorldScan, Green-X and GAINS
As archetypes, three distinct types emerge: (1) IAMs encompass the highest level of top-down, inclusive models that can include a wide range of causes and show system-wide effects; (2) detailed techno-economic energy system models focus on the technical aspects of the energy and/or electricity system; and (3) hybrid models combine bottom-up and top-down approaches in an attempt to find a better trade-off between the strengths and weaknesses of the other two model types. For the purposes of my work, since my research question is aimed at the electric power sector, the second type of model is most appropriate.
3.2.Capacity Expansion Planning
Emerging from the literature review in Section 3.1, I reviewed a list of nine techno-economic electric power sector models. In this section, I present the results from this literature review (see Table 4). It becomes apparent from the analysis that Capacity Expansion Planning models are the most applied type of model. Seven of the nine reviewed models are CEP models, and I choose to conduct my analysis using a Capacity Expansion Planning model as well.
Two model characteristics are of high importance for my analysis: an hourly scope for solving the energy balance equations, and a representation of long-distance transmission. The hourly resolution is highly preferable to a collection of time slices to fully capture the supply-demand dynamics with intermittent renewables. And since the focus of my thesis is to explore scenarios of transmission and interconnector expansion, having a representation of transmission between regions is necessary for my analysis.
However, many of the reviewed models do not include these two features. In many cases, models use time slices which group the hours of the year into characteristic groups based on time of day and seasonality. The representation of long-distance transmission is only included in four of the reviewed models.
For my thesis, I thus choose the capacity expansion planning model EleMod, which I introduce in the following chapter. The model meets the shortcomings of a large list of the reviewed models. It solves an hourly dispatch model to adequately capture the challenges of intermittent resources. Furthermore, EleMod can be applied to the geographic scope of New England, and it allows for the representation of transmission interfaces in between states. Finally, a hydro resource in Canada can be added to the model which allows the assessment of the benefit of hydropower imports and the effect of increased interconnection capacity.
Table 4: Overview of Bottom-Up Electricity Sector Models
Model Name Model Type Reference Description Technological Scope Temporal Cost Modeling Scope Parameters Highlights AURORAxmp Dispatch Carley 2011 State energy portfolios, Individual plant data from Every fourth Real levelized Electricity market
optimization, resource dispatch based EIA hour, four days net prices, realistic capacity on competitive a week on present value transmission capacity expansion wholesale alternating (in $/MW) of constraints
weeks all available resources
Renewable Reduced-form Denholm et REFlex is a reduced form Wind, PV, CSP and nuclear Hourly load Variable cost of Combining Energy dispatch model al. 2012 dispatch model that with 8h thermal storage, data from generation renewable and Flexibility compares the hourly conventional resource ERCOT nuclear energy using (REFlex) demand for electricity portfolio thermal storage
with the supply of renewable energy considering grid constraints
European Unit Hourly dispatch Despr6s et Integrates with POLES Wind, solar, storage, Hourly Variable costs Storage technologies, Commitment optimization al. 2017 model which accounts conventionals demand response, and Dispatch for capacity expansion and European grid
(EUCAD) planning interconnections
Regional Energy Capacity Eurek et al. Built for the contiguous Focus and detail of 17 time slices Energy and Complete technology Deployment expansion and 2016 United States, explores renewables (on- and off- capacity costs set, endogenous System (ReEDS) dispatch model generation and shore wind, solar CSP and transmission
transmission capacity PV, geothermal, biopower, expansion, CES and expansions kinetic wave), also RPS
conventional fleet, storage, demand-side response, energy efficiency
Model Name Model Type Reference Description Technological Scope Temporal Cost Modeling Scope Parameters Highlights Renewable Capacity Gils et al. Assess the capacity Solar PV and CSP, wind, Hourly Capital costs Deterministic Energy Mix expansion, 2017 expansion and hourly hydro run-of-river, storage, and operational optimisation of the (REMix) hourly dispatch dispatch at various levels thermal plants (geothermal, costs operation
of photovoltaic and wind biomass, conventional fuels) and the capacity
power penetration expansion of all
modelled technologies LIMES-EU Capacity Haller, Ludig Multi-scale power Focus and detail on 49 time slices Investment, Long-term
expansion, & Bauer system model to explore renewables, but also fixed and transmission, storage hourly dispatch 2012 expansion pathways for conventional resources variable O&M
renewables, long costs
distance transmission and storage capacities
(No name) Capacity Jigemann et Dynamic linear Conventional, CHP, nuclear, Four typical Investment, High technological expansion, al. 2013 electricity system renewables, storage days per year, fixed O&M, and regional hourly dispatch optimization model for investment variable costs, resolution
Europe decisions every and ramping
five years costs
MARKAL UK Perfect foresight Kannan Minimizes discounted Conventional, CHP, solar 6 time slices Capital cost, Technology-rich partial 2009 total system cost by PV, on- and off-shore wind, (night + day, 3 fixed and (including CCS), equilibrium choosing the investment biomass, wave energy seasons) variable O&M learning rates optimization and operation
model
Investment Advanced Sisternes, Generation capacity Focus on solar, also advanced Hourly Annualized Value of storage, unit Model for generation Jenkins expansion model with nuclear, advanced coal, fixed costs, commitment Renewable capacity & Botterud detailed unit combined and open cycle gas variable constraints and Electricity expansion model 2016 commitment turbines operating costs investment decisions
Systems for individual power
(IMRES) plants
4. ELEMOD: A CAPACITY EXPANSION PLANNING MODEL
EleMod is a recursive-dynamic optimization model that solves capacity expansion, generation planning and dispatch on an hourly basis over the time horizon of thirty years. The capacity expansion function of the model is jointly executed with the generation planning and dispatch functions by examining how to meet the hourly demand profile of the given year. Slightly simplified, operation planning accounts for the daily start up and shutdown decisions of the different generation technologies, operation dispatch considers the hourly economic dispatch decisions of the various technologies based on the variable costs (fuel and variable O&M costs) as well as the costs associated with specific start-up and shut-down sequences, and capacity expansion planning decides which new capacities to add to the system based on the technologies' annualized costs (annualized fixed capital costs and O&M costs) and long-term reliability requirements. For a more detailed description of the mathematical formulation of EleMod, please refer to Tapia-Ahumada et al. 2014 and Tapia-Ahumada et al. 2015.
EleMod was developed as a techno-economic model to study the electric power sector for the lower-48 US states and Alaska. In this configuration, states were aggregated into 12 larger regions, with New England as one of those regions. Given the modular framework of the model, its structure can be applied to study other geographical areas. To answer the research question set out for my thesis, I thus use EleMod and adapt its structure to study the New England electric power sector in detail, where the regions are now the six New England states.
The contributions of my work to the research efforts around the development of EleMod at the MIT Energy Initiative and the Joint Program on the Science and Policy of Global Change include the following features: First, I added a representation of hydro imports from Canada (see subsection 4.2.2). Second, I included a representation of the transmission interfaces within New England (see subsection 4.2.3). And third, I added a Clean Energy Standard which enforces a certain percentage of each year's generation to come from a set of CES-eligible technologies.
4.1. Core Structure of EleMod
4.1.1. Technologies
The choice of generation technologies was primarily based on the latest data of NREL's 2017 Annual Technology Baseline (ATB). Its officially stated purpose is "to provide CAPEX, O&M, and capacity factor estimates for Base Year and future year projections [...] for use in electric sector models." (NREL 2018) Most of the technologies included in my analysis are taken from there. These include three technologies for natural gas (combustion turbine, combined-cycle, and combined-cycle with CCS), three coal technologies (a state-of-the-art coal plant, one with 30% CCS and one with 90% CCS), nuclear power, hydropower, wind (land-based) and solar power (utility-size), as well as two biomass technologies (a dedicated and a co-fire plant). In the following subsection 4.1.2, I provide details on the operational characteristics and investment
cost data for these plants.
Since the ATB is directed towards future deployment of electricity generating technologies, it does not contain data for some of the legacy technologies like petroleum-fired plants, steam-powered open cycle gas plants, or old coal plants. While I do not allow capacity expansion for these technologies, their current stock is not negligible: New England possesses over 7 GW of oil-fired plants, over 4 GW of old coal plant, and over
1
GW of open cycle gas plants. I thus choose four technologies based on the 2006 EIA AEO to represent these legacy plants: an oil/gas steam turbine, a coal steam plant, a petroleum steam turbine and a petroleum combustion turbine. A full overview of all 17 generation technologies available in EleMod for my study can be found in Table 5.Table 5: EleMod Generation Technologies
Code Resource Technology
nOl Natural gas combustion turbine - GasCT
n02 Combined cycle gas turbine - GasCC
n03 Natural gas Combined cycle gas turbine with carbon capture and sequestration (CCS) - GasCCS
n09 Oil/gas steam turbine - OGS -- > Assumed to use GAS
n05 Conventional pulverized coal steam plant (with
Coal S02 scrubber) - CoalOldScr
n06 Advanced supercritical coal steam plant (with S02
and NOx controls) - CoalNew
n07 Integrated gasification combined cycle (IGCC) coal - CoalIGCC
n14 Coal-CCS-30%
n15 Coal-CCS-90%
n10 Nuclear Nuclear plant - Nuclear
n12 Advanced supercritical coal steam plant (with
Biopower biomass cofiring) - CofireNew
n13 Dedicated biomass plant - Dedicated
n16 Petroleum Oil Combustion Turbine
n17 Petroleum Oil Steam Turbine
Solar Solar Solar power (utility scale)
Wind Wind Wind power
Hydro Hydro Run-of-river Hydropower
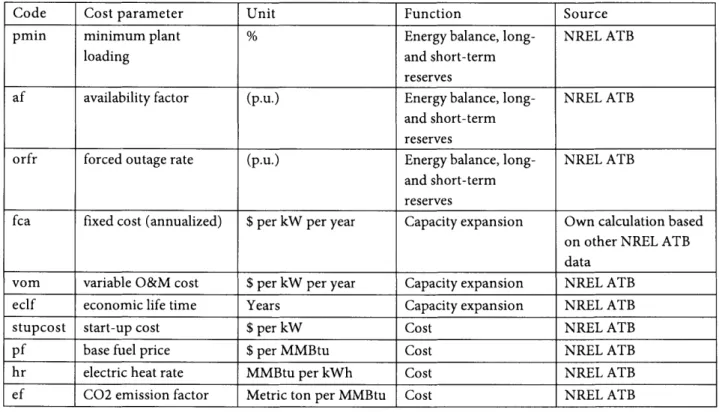
4.1.2. Cost and Operational Parameters
The cost and operational parameters used in EleMod are shown in Table 6. The relative costs of all technologies can be found in Appendix B (conventional resources) and C (renewable resources). To better understand how the cost and operational parameters are used in the model, I divide them into three groups: parameters used (1) in calculating the energy balance, (2) in determining the capacity expansion, and (3) in minimizing the cost function.
All the parameters in Table 6 are directly taken from the ATB database, with exception of the annualized and fixed capacity costs (fca), which is based on other data from ATB. This value is crucial to determining the capacity expansion decisions in the model, and represents the annualized investment costs of the model:
fca = (oncap + fin) * cfr +
fom
Where
fca fixed cost (annualized) oncap" overnight capital cost
fin financing cost
cfr capital recovery factor
fom fixed O&M cost.
The parameters oncap, fin, cfr, and fom are obtained from the ATB for all technologies (cfr does not vary by technology).
The data for cost parameters used in EleMod was previously supplied from the EIA AEO in 2006 and 2016. I supply data for cost parameters with the latest values from the NREL's 2017 ATB (NREL 2018), " which largely draws on the equivalent 2017 AEO outlook data. The advantage of the ATB is the consistent presentation of data for all new generation technologies in an easy-to-integrate Excel table.
Table 6: Cost and Operational Parameters for Technologies
Code Cost parameter Unit Function Source
pmin minimum plant % Energy balance, long- NREL ATB
loading and short-term
reserves
af availability factor (p.u.) Energy balance, long- NREL ATB and short-term
reserves
orfr forced outage rate (p.u.) Energy balance, long- NREL ATB and short-term
reserves
fca fixed cost (annualized) $ per kW per year Capacity expansion Own calculation based on other NREL ATB data
vom variable O&M cost $ per kW per year Capacity expansion NREL ATB eclf economic life time Years Capacity expansion NREL ATB
stupcost start-up cost $ per kW Cost NREL ATB
pf base fuel price $ per MMBtu Cost NREL ATB
hr electric heat rate MMBtu per kWh Cost NREL ATB ef CO2 emission factor Metric ton per MMBtu Cost NREL ATB
4.1.3. Temporal Scope
EleMod conducts an hourly representation of dispatch and daily operation planning. The capacity expansion planning is done on an annual basis, and volumes of newly installed capacity are carried over to form the base stock in the next year.
In order to save computational time but enable an outlook further into the future, I solve the capacity expansion every four years starting in 2018 and going out to 2050. These nine snapshots of annual capacity
" Only exception are the legacy technologies. To find appropriate cost and performance parameters, I went back as far as possible to the 2006 EIA AEO outlook. My assumption is that plant data from 2006 provide the most accurate representation of the operational characteristics of those legacy plants.
investments as well as year-long generation profiles on an hourly basis provide a forecast to analyze the future of New England's electricity sector.
4.1.4. Objective Function
For the objective function, EleMod offers two options: (1) to minimize the total system cost over all regions, or (2) to maximize total welfare. Total system costs include the annualized investment costs and fixed operation and maintenance (O&M) costs, start-up and shut-down costs for generators, and variable costs. The latter include variable O&M costs, fuel costs based on heat rate, fuel prices, and generation levels, as well as the cost of non-served energy (NSE), which accounts for the cost to society of not serving load based on the Value of Lost Load (VoLL).
TotCost = TCostreg
reg
Where
TotCost Total System Cost
TCost System Cost per region
reg Set of regions of the model.
And for every region:
TCostreg = ICaPreg,tec * fcatecf + StUPreg,tech,h * StUPCOSttech
tech tech,h
+ GOutreg,tech,h * (fueltech * heatratetech + CO2
reg * emisstech tech,h
* heatratetech + VOmtech) +
Y
(CPOwreg,tech,h - GOUtreg,tech,h) * vomtechtech,h + NSEh * VoLL
Where
ICap Installed capacity per region and technology StUp Start-up variable per region, technology and hour
Gout Electricity output per region, technology and hour
CPow Connected power per region, technology and hour
NSE Non-served energy demand per hour
fca Annualized fixed capacity cost per technology
fuel Fuel price per technology
heatrate Heat rate per technology
C02 CO2 price per region
emiss Emissions rate per technology
vom Variable O&M cost per technology
VoLL Value of Lost Load.
As an alternative, the welfare maximization computes consumer and producer rents based on the hourly electricity prices and subtracts total system costs. The calculation of rents is non-linear and requires the use of a Quadratically Constrained Programming (QCP) solver. For this work, I apply the cost minimization described above which can be solved using Mixed-Integer Programming (MIP).
The main decision variables for EleMod are annual installed capacities per technology and region (for the capacity expansion), hourly generated power per technology and region (for dispatch planning), the connected power on a daily basis (operational planning), the hourly system curtailments for wind and solar power per region, and the hourly NSE per region.
The major constraints of the model include the resource availability for additional capacity installments of solar and wind power per region, the reserve margins for short-term operational reserves, the reliability requirements for long-term security of supply, and the minimum and maximum generation levels per technology which are relevant for the operation and dispatch planning. The equations for the latter model features can be found in (Tapia-Ahumada et al. 2015).
4.1.5. EleMod Data
The strengths of a bottom-up techno-economic model lie in its ability to capture technological processes and market mechanisms in mathematical relationships. But in order for the solutions to these formulas to develop a real meaning, they need to be built upon reliable data, and in many cases a lot of it.
This is also the case with EleMod. Since I build my model upon an earlier version of the model, many data sets already exist and can be applied to my model as well after some data processing. As a first principle, if data that is available from the twelve-region version of EleMod on a state- or even more disaggregated level, I simply re-do the aggregation process and stop at the state-level rather than the New England regional level. In cases where data for EleMod is directly supplied for the New England region without further disaggregation, I choose either of three options: apply the regional value to each state, use reasonable