Publisher’s version / Version de l'éditeur:
The Journal of Physical Chemistry A, 111, 34, pp. 8500-8508, 2007-08-09
READ THESE TERMS AND CONDITIONS CAREFULLY BEFORE USING THIS WEBSITE. https://nrc-publications.canada.ca/eng/copyright
Vous avez des questions? Nous pouvons vous aider. Pour communiquer directement avec un auteur, consultez la
première page de la revue dans laquelle son article a été publié afin de trouver ses coordonnées. Si vous n’arrivez pas à les repérer, communiquez avec nous à PublicationsArchive-ArchivesPublications@nrc-cnrc.gc.ca.
Questions? Contact the NRC Publications Archive team at
PublicationsArchive-ArchivesPublications@nrc-cnrc.gc.ca. If you wish to email the authors directly, please see the first page of the publication for their contact information.
NRC Publications Archive
Archives des publications du CNRC
This publication could be one of several versions: author’s original, accepted manuscript or the publisher’s version. / La version de cette publication peut être l’une des suivantes : la version prépublication de l’auteur, la version acceptée du manuscrit ou la version de l’éditeur.
For the publisher’s version, please access the DOI link below./ Pour consulter la version de l’éditeur, utilisez le lien DOI ci-dessous.
https://doi.org/10.1021/jp0723665
Access and use of this website and the material on it are subject to the Terms and Conditions set forth at
Ab initio molecular dynamics and time-resolved photoelectron
spectroscopy of electronically excited uracil and thymine
Hudock, Hanneli R.; Levine, Benjamin G.; Thompson, Alexis L.; Satzger,
Helmut; Townsend, D.; Gador, N.; Ullrich, S.; Stolow, Albert; Martinez, Todd
J.
https://publications-cnrc.canada.ca/fra/droits
L’accès à ce site Web et l’utilisation de son contenu sont assujettis aux conditions présentées dans le site LISEZ CES CONDITIONS ATTENTIVEMENT AVANT D’UTILISER CE SITE WEB.
NRC Publications Record / Notice d'Archives des publications de CNRC:
https://nrc-publications.canada.ca/eng/view/object/?id=20900e4b-251a-45fe-bf49-a95e352fe29e https://publications-cnrc.canada.ca/fra/voir/objet/?id=20900e4b-251a-45fe-bf49-a95e352fe29eAb Initio Molecular Dynamics and Time-Resolved Photoelectron Spectroscopy of
Electronically Excited Uracil and Thymine
Hanneli R. Hudock,†Benjamin G. Levine,†Alexis L. Thompson,†Helmut Satzger,‡
D. Townsend,‡ N. Gador,‡S. Ullrich,‡,§Albert Stolow,‡and Todd J. Martı´nez*,†
Department of Chemistry, Beckman Institute, and Center for Biophysics and Computational Biology, UniVersity of Illinois at Urbana-Champaign, Urbana, Illinois 61801, and Steacie Institute for Molecular Sciences, National Research Council of Canada, 100 Sussex DriVe, Ottawa, Ontario K1A 0R6, Canada
ReceiVed: March 26, 2007; In Final Form: May 25, 2007
The reaction dynamics of excited electronic states in nucleic acid bases is a key process in DNA photodamage. Recent ultrafast spectroscopy experiments have shown multicomponent decays of excited uracil and thymine, tentatively assigned to nonadiabatic transitions involving multiple electronic states. Using both quantum chemistry and first principles quantum molecular dynamics methods we show that a true minimum on the bright S2electronic state is responsible for the first step that occurs on a femtosecond time scale. Thus the observed femtosecond decay does not correspond to surface crossing as previously thought. We suggest that subsequent barrier crossing to the minimal energy S2/S1conical intersection is responsible for the picosecond decay.
Introduction
Because of its importance to the mechanisms underlying photodamage in DNA, the electronic structure and dynamics of electronically excited nucleic acid bases have been a subject of keen theoretical and experimental interest, in both isolated molecules and condensed phases.1-12 Ultrafast pump-probe photoionization experiments on isolated nucleic acid bases have established a multiexponential decay with components in the femtosecond,1,13picosecond,13,14and nanosecond9ranges. How-ever, the molecular origin of these time scales remains unknown. Many authors have previously suggested1,7,8,13,15that the shortest of these lifetimes corresponds to decay from the initially excited (S2, π f π*) state to a lower (S1, n f π*) electronic state. Ostensibly minor perturbations can have a large effect on the observed lifetimessfor example, thymine and uracil differ by only a methyl group, but the picosecond component of the lifetime has been previously reported to differ by almost a factor of 3 for these moleculess6.4 and 2.4 ps for thymine and uracil, respectively.14Experimental and theoretical studies on cytosine, the other pyrimidine base, have suggested the involvement of multiple electronic states, starting from an S1π f π* state and involving one or more n fπ* or biradical states.4,16-18Direct simulation of the excited-state dynamics could provide important insights into the detailed electronic relaxation mechanism and the molecular origin of the observed lifetime variations. We report on such simulations for the isolated pyrimidine bases uracil (U) and thymine (T) here, using the ab initio multiple spawning (AIMS) method. The AIMS simulations show that the femtosecond decay time corresponds to relaxation from the Franck-Condon region into a well-defined minimum on S2. Thus, the ultrafast femtosecond relaxation does not correspond
to nonadiabatic transitions from S2to S1. However, in agreement with previous workers, we do find a low-lying S2/S1conical intersection, separated by an intervening barrier from an S2 minimum. Thus, we suggest that the picosecond component of the lifetime may correspond to electronic relaxation from S2to S1through this conical intersection. To support our picture, we use AIMS to predict ultrafast time-resolved photoelectron spectroscopy (TRPES) results where the probe pulse photoion-izes the excited-state molecules. TRPES experiments19,20consist of a pump pulse that electronically excites the molecule, followed by a probe pulse that can induce photoionization via a single-photon transition. The resulting ejected electrons are energy-resolved, providing a two-dimensional spectrum depict-ing the yield of photoelectrons with given kinetic energy for each pump-probe time delay. We compare the AIMS predic-tions directly to experimental TRPES results, with excellent agreement for both uracil and thymine. This agreement serves to corroborate the detailed molecular mechanism predicted by AIMS for these molecules and suggests that AIMS simulations will play an important role in the interpretation of future TRPES experiments.
Theory
The AIMS method solves the electronic and nuclear Schro¨-dinger equations simultaneously, including all molecular degrees of freedom.21,22The total wave function in AIMS is expanded in a time-dependent basis set of phase-space-localized frozen Gaussians as
where I labels electronic states, e.g., S2, NI(t) is the number of
nuclear basis functions associated with the Ith electronic state at time t, and r and R label electronic and nuclear coordinates, respectively. The nuclear basis set increases adaptively during
* Author to whom correspondence should be addressed. E-mail: tjm@ spawn.scs.uiuc.edu.
†University of Illinois at Urbana-Champaign. ‡National Research Council of Canada.
§Present address: Department of Physics, University of Georgia, Athens, GA. ψ(R,r,t) )
∑
I∑
i NI(t) ci I (t)χiI(R;RhiI,Phi I ,γiI)φI(r;R) (1) 8500 J. Phys. Chem. A 2007, 111,8500-850810.1021/jp0723665 CCC: $37.00 © 2007 American Chemical Society Published on Web 08/09/2007
the simulation to allow for nonadiabatic effects, and the nuclear Schro¨dinger equation is solved in this basis to determine the time evolution of the electronic population. Because of this adaptive expansion, i.e., “spawning,” NI(t) in eq 1 will in general
increase with time. The nuclear basis functionsχiI(R;RhiI,PhiI,γiI) are multidimensional products of complex Gaussians and parametrized by their average positions and momenta, RhiI and
PhiI as well as a semiclassical phase factor γiI. The average
positions and momenta evolve according to Hamilton’s equa-tions, and the semiclassical phase factor evolves as the time integral of the classical Lagrangian. The electronic basis functions φI(r;R) are defined as solutions of the electronic
Schro¨dinger equation in the adiabatic representation at the nuclear geometry given by R. The complex coefficients ciI(t) evolve according to the time-dependent nuclear Schro¨dinger equation in the time-evolving basis set, i.e.,
is solved simultaneously with the equations of motion for RhiI,
PhiI, and γiI. The overlap, right-acting time derivative, and Hamiltonian matrix elements have been used in eq 2
where Hˆ is the full molecular Hamiltonian operator including the nuclear kinetic energy and the electronic potential energy surfaces (PES’s) and nonadiabatic coupling terms (NACs). The electronic Schro¨dinger equation is solved simultaneously with the nuclear dynamics to obtain the PES’s and NACs. The electronic states are taken to be orthonormal as indicated in eq 3. The saddle point approximation is used to compute the potential part of the Hamiltonian matrix elements, which requires evaluation of the PES’s and NACs at intermediate geometries for each unique pair of trajectory basis functions. Complete details of the AIMS method can be found in the literature,21,22 and its applicability to photoinduced isomerization and excited-state proton transfer has been demonstrated.23,24
In this work, the simulation results are directly compared to femtosecond pump-probe TRPES experiments.1In the TRPES experiments, the energy of the emitted electrons is directly measured. Consequently, higher-order multiphoton processes would unavoidably be observed if present. The experiments have been performed under conditions where multiphoton ionization is negligible, simplifying both the experimental interpretation and the theoretical modeling. In the present work, we compare only to the photoelectron yield, obtained by integrating the TRPES spectrum over all possible kinetic energies of the ejected electrons.
In principle, a complete calculation of photoelectron yield requires consideration of the continuum of final states for the free electron and calculation of boundary-free transition dipole matrix elements. A number of approaches have been presented for calculating time-resolved photoelectron spectra and applied in cases where analytic potential energy functions were available.25-30Although direct application of these approaches is possible within the context of AIMS (because full electronic and nuclear wave functions are available), we employ a
simplified approach here, exploiting the analogy to classical mechanics suggested by the evolution of the nuclear basis functions.
Consider a single localized nuclear basis function on the Ith electronic state centered at Rh(t) and a probe pulse applied at time t with carrier frequency pωprobe. We assume that the electron ejection event is ultrafast. Therefore, we assume that the transition is fully vertical in what follows; i.e., the nuclear wave functions of the initial and final states are identical. The electronic wave functions of the photodetached states are defined as |φRφη〉, whereR labels the adiabatic electronic state of the cation and η is a composite index containing the quantum numbers of the scattering orbital describing the ejected electron. Within the electric dipole approximation, the instantaneous single-photon-induced ionization rate at time t into final states corresponding to theRth cation core is given by
and
where Eb is the polarization vector of the light, µˆ is the electronic dipole operator, VIand VRare the adiabatic electronic
PES’s of the neutral and cationic states, and ǫ is the kinetic energy of the ejected electron corresponding to φη. The transition dipole matrix element can be expressed in a second quantized form as
where a and b label orbitals obeying either bound or scattering boundary conditions and p labels only bound orbitals. Since we are not presently interested in the detailed angular distribu-tion of the ejected electrons, we replace the unknown bound-free matrix elementsbµpηwith an average value, fη
This separates the transition matrix element into one term that discriminates between different electronic cation final states and a second term that is dominated by the kinetic energy of the ejected electron. The first term is directly related to the “corresponding” and “complementary” ionization correlations, which can be very helpful in disentangling electronic and vibrational dynamics in TRPES experiments.31,32Summing over final states with equivalent kinetic energy ǫ of the departing electron and assuming that the average transition dipole moment
fηdepends only on ǫ yields
where F(ǫ) is the density of scattering states and IPIR is the
vertical ionization potential from the Ith electronic state of the
∑
kK Sjk JK c˘k K) -i∑
kK (Hjk JK- iSB˘ jk JK )ck K (2) Sjk JK) 〈χjJφJ|χkKφK〉δJK S B˙jk JK)〈
χjJφJ|
∂χk K ∂t φK〉
δJK (3) Hjk JK)〈 χjJφJ|Hˆ |χkKφK〉 PIfR(t)∝∑
η PIfRη(t) (4) PIfRη(t)∝|
〈φI|Eb‚µˆ|φRφη〉|
2 δ(pωprobe+ VI(Rh(t)) -VR(Rh(t)) - ǫ(η)) (5) |〈φI|Eb‚µˆ|φRφη〉|2)|
∑
ab 〈φI|aa†ab|φRφη〉Eb‚µbab|
2 )|
∑
p 〈φI|ap †|φ R〉Eb‚µbpη|
2 (6) |〈φI|Eb‚µˆ|φRφη〉|2≈|
∑
p 〈φI|ap†|φR〉|
2fη fη)|
〈Eb‚µˆ pη〉p|
2 (7) PIfR(ǫ,t)∝|
∑
p 〈φI|ap †|φ R〉|
2f(ǫ)F(ǫ)δ(pωprobe- IPIR(RB) - ǫ) (8) Electronically Excited Uracil and Thymine J. Phys. Chem. A, Vol. 111, No. 34, 2007 8501neutral to theRth electronic state of the cation. Experimentally, it is often observed that the photoionization cross-section is only weakly dependent on the kinetic energy of the departing electron, at least for relatively low energies.33This is because the density of scattering states is an increasing function of ǫ while f(ǫ) decreases with increasing ǫ. This is theoretically modeled by treating the product f(ǫ)F(ǫ) as a constant for all electron kinetic energies leading to
The first term in eq 9 is referred to as the “electronic factor” in what follows, and it provides a measure of the degree to which the neutral electronic state is compatible with a given cation core for a single photon transition. The electronic factor is closely related to the Dyson orbitals that have been used previously to analyze photoelectron spectra.34,35We generalize eq 9 for the case where the AIMS wave function is composed of many different nuclear/electronic basis functions by incoher-ently averaging over the basis functions
where niI(t) represents the Lo¨wdin population in the corre-sponding nuclear/electronic basis function.22Finally, the pho-toionization probability is given as a sum over all possible cation cores and an integral over all possible electronic kinetic energies
where wR is a weighting factor that can in principle be fit to compensate for some of the averaging that has been done in eqs 7 and 9. In the present work we make no attempt to fit these weighting factors, and they are all set to unity.
In many cases, the electronic wave function used in the AIMS dynamics will not be sufficiently flexible to calculate accurate ionization potentials. For example, the vertical excitation energies obtained in a state-averaged complete active space self-consistent field (SA-CASSCF) treatment36are often too large because dynamic electron correlation effects are neglected. Since the ionization potential itself is usually more accurate than the excitation energies, this implies that ionization potentials from excited electronic states will be too low. Another potential issue is that the electronic structure requirements for the cationic states may be different from those for the neutral ground and excited states. For example, an active space that is large enough to describe the neutral may not be large enough to describe the important electronic states of the cation. The results can thus be considerably improved (1) by using more sophisticated excited-state electronic structure methods to calculate the ionization potentials along the centers of the trajectory basis functions determined in AIMS and (2) by introducing a constant shift of the computed ionization potential. We have found second-order multireference perturbation theory37(CASPT2) to be a good choice for computing ionization potentialssthis includes both multireference (static correlation) and dynamical electron correlation effects. A constant shift is determined by computing the ionization potential at the Franck-Condon point and comparing it to the experimentally determined value. This correction is incorporated by replacing IPIR in eq 10
with IPIR- ∆, where
and RBFC is the Franck-Condon point. This ensures that the predicted kinetic energy of electrons ejected immediately after photoexcitation to S2(i.e., when the pump-probe time delay is zero) is in coincidence with the experimental value.
The procedure as described so far models the photoionization pulse as an instantaneous interaction between the molecule and the radiation field. Furthermore, the AIMS method, as used in this paper, models the excitation as an instantaneous process also. In a realistic experiment, the pump and probe pulses are both of finite time duration, and it is important to incorporate this in the modeling procedure. We convolute the signal predicted by instantaneous excitation and ionization according to the known pump and probe pulse durations in the TRPES experiment. Thus, given transform-limited pulses with the envelope function
the convoluted signal is calculated from eq 11 as
Results
In our AIMS simulations of uracil and thymine, the electronic Schro¨dinger equation is solved using SA-CASSCF with eight electrons in six orbitals, i.e., SA-3-CAS(8/6). The 6-31G* basis set38,39was used in all calculations. Results are averaged over 12 simulations where initial positions and momenta are ran-domly selected from a harmonic (V ) 0) Wigner distribution40 constructed from the SA-3-CAS(8/6) S0frequencies at the MP2-optimized Franck-Condon point. The lowest excited electronic state S1(n fπ*) in both thymine and uracil is optically dark, and thus the dynamics begin on the bright S2(π f π*) state. We followed the dynamics for 500 fs. All calculations are carried out in the full dimensionality of the molecules.
Previous work has established that an S2/S1minimal energy conical intersection (MECI) lies below the FC point in uracil7,41 and thymine.8It has been suggested8 that quenching through this MECI might be responsible for the experimentally ob-served42,43 broad and structureless absorption spectrum of isolated uracil and thymine. Thus, we were surprised to find very little (<10%) quenching to S1within the first 500 fs of dynamics for both uracil and thymine, as shown in Figure 1. While some quenching to S1is observed, this only occurs for very few of the trajectory basis functions. However, as shown in Figure 2, there is rapid structural relaxation after photoex-citation to S2, consisting of lengthening of the C5-C6bond, pyramidalization around C6, and lengthening of the C4-O4bond. (The numbering of atoms used is given in the inset to Figure 2.) This rapid relaxation out of the FC region on the excited state may be responsible for the observed broad absorption spectrum.
However, a femtosecond decay component has also been observed for both thymine and uracil in pump-probe
experi-PIfR(ǫ,t)∝
|
∑
p 〈φI|ap†|φR〉|
2δ(pωprobe- IPIR(RB) - ǫ) (9) PR(ǫ,t)∝∑
Ii niI(t)|
∑
p 〈φI|ap†|φR〉|
2δ(pωprobe- IPIR(Rhi I )- ǫ) (10) Pion(t))∑
R wR∫
0 ∞ PR(ǫ,t) dǫ (11) ∆ ) VD0 CASPT2 (RBFC) -VS2 CASPT2 (RBFC)- IPS 0/D0 vertical,expt+ ∆E S2/S0 vertical,expt (12) fpump(t)) 1 σpumpx2π e-(t-t0pump)2/2σpump2 (13) Pion convolved (t′)) 1 σppx2π∫
-∞ ∞ e-t2/2σpp2P ion(t′- t) dt σpp)x
σpump2+ σprobe2 (14)ments. As mentioned in the Introduction, this has been ascribed to nonradiative transitions, at variance with the AIMS results shown in Figure 1. To verify the picture produced by AIMS, namely, that neither uracil nor thymine undergo significant surface crossing within the first 500 fs, we calculate the photoelectron yield predicted by AIMS and compare directly to results from TRPES spectra.19 As discussed above, the TRPES experiment measures energy-resolved photoelectron yield as a function of pump-probe time delay. Here, we focus on the total photoelectron yield, leaving comparisons of the full TRPES spectrum to future work. Our calculations of the
photoelectron yield follow eqs 10-12. The CASPT2 method with an enlarged active space was used to calculate the ionization potentials required in eq 10. Specifically, we use SA-3-CAS-(10/7)-PT2 for the neutral molecule and SA-3-CAS(9/7)-PT2 for the cation. The shift of the ionization potentials, ∆ in eq 12, is set to -0.1 eV (for both thymine and uracil), which ensures that the threshold probe wavelength that can induce photoionization immediately after a vertical transition to S2 matches that predicted from the experimental absorption maxima43 (5.1 and 4.8 eV for uracil and thymine, respectively) and vertical ionization potentials44(9.6 and 9.2 eV in uracil and thymine,
Figure 1. Population on S2(ππ*) after photoexcitation for uracil (left panel) and thymine (right panel). For each molecule, the gray lines show the S2population for each of the 12 initial conditions, and the black lines show the average over all initial conditions. Very few nonadiabatic events are observed, and the total population on S2remains close to unity for the time period shown for both molecules. Molecular geometries near the few observed quenching events are shown, and these involve significant distortions from planarity. In this respect, the quenching geometries are similar to the minimal energy S2/S1conical intersection shown in the insets. (Three perspectives of the MECI geometry are shown for uracil and thymine.)
Figure 2. Average C5-C6bond length in uracil (left panel) and thymine (right panel) afterπ f π* (S2) photoexcitation as calculated with AIMS dynamics. This bond length changes dramatically in the first 20 fs and is the bond length that changes most during the first 500 fs of dynamics on S2. The C5-C6bond stretches on the excited state from its ground-state double-bond configuration to an elongated single bond in the first 10 fs and then relaxes to the single-bond configuration corresponding to the minimum on S2. This minimum is also characterized by the H atom attached to C6bending out of plane, corresponding to a change in the hybridization of C6from planar sp2to tetrahedral sp3and the lengthening of the C4-O4 bond. This rapid relaxation out of the Franck-Condon region on the excited state may contribute to the observed broadening of the absorption spectrum.
respectively). The resulting AIMS-predicted signal Pion(t) was subsequently convoluted according to the pump and probe pulse widths used in the TRPES experiment (160 fs), as in eq 14. The two lowest doublet cation electronic states are included in the calculation, i.e., R ) D0 and R ) D1 in eq 11. At the Franck-Condon point, these states correspond to electron detachment fromπ and n orbitals for D0and D1, respectively. At the probe pulse energy of 6.2 eV (200 nm) that was used in the experiment, these are the only two cation states that are energetically accessible as early as 5 fs after photexcitation.
The expression given for the electronic factor in eq 9 is most readily evaluated when the cation and neutral wave functions are expanded in a common set of orthogonal molecular orbitals. Furthermore, it is unlikely to be worth the effort to compute the electronic factor with CASPT2 wave functions since the detailed nature of the continuum orbitals is not taken into account. Thus, we carried out a fully optimized state-averaged CASSCF calculation for the neutral molecule at each geometry and a subsequent CASCI calculation for the cation using the orbitals determined for the neutral molecule (at the given geometry) without further optimization. The electronic factor was then determined using the usual Slater-Condon rules.45 The same active space and state-averaging is used in the CASSCF/CASCI calculation of the electronic factor and the subsequent CASPT2 calculation of the ionization potentials.
Figure 3 compares the predicted (AIMS) and observed photoelectron yield1in uracil (upper panel) and thymine (lower panel). The computed and measured signals are in excellent agreement, verifying the AIMS simulations. Since Figure 1 shows that there is negligible nonradiative relaxation, one is forced to conclude that the femtosecond component in the decay of the experimentally and computationally observed
photoelec-tron signal does not correspond to a change in adiabatic electronic state but rather to relaxation on S2. In principle, it is possible that the decreased signal is due to a change in the electronic character of the S2 state, without accompanying nonadiabatic transitions. In other words, there could be a strongly avoided crossing of diabatic electronic states. Thus, we have also examined the character of the electronic wave function on S2 during the dynamics. The electronic wave function of the S2state is dominantly of biradical character, in agreement with the previous studies of Zgierski and co-workers using coupled cluster methods.15The sp3rehybridization of C
6 and the lengthening of the C4-O4bond result from this diradical formation. For the majority of trajectory basis functions (those which do not reach the S2/S1MECI), this assignment of S2as a diradical state remains valid throughout the course of the dynamics. Furthermore, the two active orbitals that are singly occupied in the dominant electronic configuration are unchanged at both early and late times, as shown for a representative trajectory in Figure 3. Thus, we conclude that the observed decrease in the photoelectron yield is not due to nonadiabatic transitions, neither through a conical intersection nor through a strongly avoided crossing. Examination of eq 10 shows that the only remaining factors that can lead to a decrease in the photoelectron yield are variation of the electronic factor or ionization potential. The role of the electronic factor is discussed in more detail below, but already from the observation that the electronic character is unchanged during relaxation on S2, one can infer that the ionization potential must be responsible for the observed decreased photoelectron yield. As the molecules relax on S2, the ionization potential increases, and ionization is energetically forbidden given the chosen probe pulse energy. This suggests that the femtosecond decay in the TRPES experiments may not be observed if a more energetic probe pulse is used.
The observed relaxation on S2 without significant internal conversion to S1 suggests the presence of a well-defined minimum on S2. Thus, we searched for an S2minimum using the SA-3-CAS(8/6) wave function and starting from geometries in the dynamics at later times (>300 fs). Such a minimum was indeed located and has been overlooked in previous studies of uracil. Recently, Perun et al. found a similar S2minimum in thymine.8The S
2minimum geometry that we located involves significant out-of-plane distortion of the hydrogen atom attached to C6, as shown in Figure 4. To ensure that this S2minimum is not an artifact of the electronic structure method used, we have further optimized it using multireference perturbation theory with multistate corrections (MS-CASPT2),46,47as implemented in MOLCAS.48The active space and state-averaging in these CASPT2 calculations was enlarged, SA-5-CAS(8/7)-MSPT2, to ensure balanced treatment of the four lowest-lying excited states (two are nπ* and two are ππ*), as discussed in more detail below. Gradients for MSPT2 were determined numerically by central differences with a step size of 0.1 bohr. Optimized bond lengths and angles from the MSPT2 optimizations are shown in Figure 4 (in parentheses). The S2minimum geometries from CASSCF and MSPT2 are very similar, and both show the out-of-plane distortion of the hydrogen atom and a slight puckering of the ring.
We also carried out searches for the S2/S1MECI using both CASSCF and MSPT2. For the MSPT2 optimizations, MECI geometries were optimized using a new algorithm49,50that does not require NACs. The resulting S2/S1 MECI geometries are shown in Figure 5. These MECI geometries are similar to those previously reported in both uracil7and thymine.8As in the case
Figure 3. Photoelectron yield as a function of pump-probe time delay
for uracil (upper panel) and thymine (lower panel). Predicted results from AIMS dynamics simulations are shown as gray lines, and experimental TRPES results from ref 1 are shown as black circles. Throughout the first 500 fs, the lowestππ* state (S2) is dominated by a configuration with two singly occupied orbitals, φ1and φ2, indicating that the observed decay does not arise from a change in electronic state.
of the S2minimum, the CASSCF and MSPT2 results are quite similar. These geometries can be compared to the representative molecular configurations near the few observed internal conver-sion events shown in Figure 1.
It is interesting to examine the role of the electronic factor in detail. The initially populated S2state is dominantly of n2ππ* character, while the two lowest-lying electronic states of the cation are of n2π and nπ2character (D
0and D1, respectively). Under single-photon ionization conditions, molecules are often observed to photoionize according to a Koopmans (frozen core) approximation;51,52i.e., electron detachment is not accompanied by electronic rearrangement. The electronic factor of eq 9 embodies this propensity, since it is a projection of the neutral
electronic wave function onto the electronic states of the cation. For uracil and thymine, one thus expects that the S2state will ionize primarily to D0, accomplished by ejection of the electron in theπ* orbital. In contrast, ionization to D1requires ejection of theπ* electron and accompanying n f π excitation. The expected ionization propensities are indeed observed, as shown in Figure 6, which decomposes the photoelectron yield of Figure 3 into the components arising from ionization to D0and D1for uracil (upper panel) and thymine (lower panel). At early times, the dominant contribution is from D0, while both D0and D1 contribute at longer times. The origin of this behavior is made
Figure 4. Optimized geometries for uracil (upper panel) and thymine (lower panel) on S0(left) and S2(right). Optimizations were carried out using both CASSCF (SA-3-CAS(8/6)) and MS-CASPT2 (SA-5-CAS(8/7)-MSPT2) methods. Selected bond lengths and angles are shown (CASSCF in normal text and CASPT2 in parentheses), with boldface highlighting the parameters that change most upon relaxation on S2after photoexcitation.
Figure 5. Optimized geometries for S2/S1 MECIs in uracil (upper panel) and thymine (lower panel). Optimizations were carried out using both CASSCF (SA-3-CAS(8/6)) and MS-CASPT2 (SA-5-CAS(8/7)-MSPT2) methods. Selected bond lengths and angles are shown (CASSCF in normal text and CASPT2 in parentheses).
Figure 6. Photoelectron yield from ionization to D0 (blue) and D1 (green) that comprise the total signal (gray). The lowest cation electronic state D0, aπ-hole cation, contributes most to the signal in the first 500 fs. D1, an n-hole cation, contributes to the signal later in time, as the molecule leaves the planar configuration.
clear in Figure 7, which traces the molecular geometry of uracil along a linearly interpolated path in internal coordinates connecting the Franck-Condon point to the S2 minimum to the S2/S1 MECI. The endpoint geometries of this path cor-respond to the geometries optimized with the SA-3-CAS(8/6) method used in the AIMS dynamics. The energies shown correspond to those used (CASPT2) in the calculation of the ionization potentials required in eq 10. The upper panel of Figure 7 shows the energies of the neutral and cation states along this path. The ionization potential from S2increases significantly going from the Franck-Condon point to the S2minimum, and this increase is responsible for the observed decay of the photoelectron yield. Notice that the molecule would remain (barely) ionizable at the S2minimum if it followed the depicted path. (The probe energy is 6.2 eV, and the S2/D0gap at the S2
minimum is also ∼6.2 eV.) However, there is significant kinetic energy distributed among the vibrational modes of the molecule, and ionization is not energetically allowed. The upper panel of Figure 7 also shows that the cation states become degenerate in the region of the S2 minimum. Thus, the adiabatic cation states are of mixed n-hole andπ-hole character, which is why signal from ionization to both D0and D1is observed at later times. This is clear in the lower panel of Figure 7, which shows the electronic factors connecting S2to D0and D1along the same linearly interpolated path. For the most part, the electronic factor to D0is significantly larger than that to D1, with the exception of the region near the S2minimum where the two cation states are degenerate.
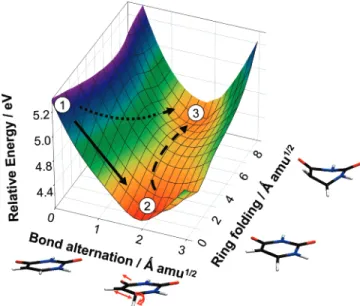
The picture that emerges from both the AIMS dynamics and subsequent electronic structure calculations is summarized in Figure 8, which presents the S2potential energy surface in a set of linearly interpolated coordinates that span the important molecular configurations as best as possible. The two coordi-nates used for the interpolation are roughly characterized as bond alternation (the rapid relaxation shown in Figure 2) and ring folding (the strongly out-of-plane distortions including folding of the ring along the C6-N3axis needed to reach the S2/S1 MECI). The bond alternation coordinate is dominated by lengthening of the C5-C6bond (to a lesser extent also the C4 -O4bond) and subsequent out-of-plane distortion of the hydrogen atom bonded to C6, changing C6from an sp2to an sp3center. These distortions are characteristic of the diradical character on S2. The PES shown in Figure 8 was calculated using SA-5-CAS(8/7)-MSPT2, and details of the collective coordinates used may be found in the Supporting Information (Table S36). The coordinates are mass-weighted so that the slopes along the two directions may be compared. Although it is possible to reach the S2/S1MECI directly from the Franck-Condon point without any intervening barrier (dotted line in Figure 8), the slope of the S2 PES is steepest in the direction leading to the S2 minimum. Hence, most of the population relaxes directly to the S2minimum (solid line in Figure 8), whereupon barrier crossing (dashed line in Figure 8) is required to reach the S2/S1MECI. It is natural to suggest that this barrier crossing on S2may be
Figure 7. Reaction pathway along S2, as probed by photoionization TRPES experiments. The pathway is determined by linear interpolation in internal coordinates between the S0minimum, S2minimum, and S2/ S1MECI, where the geometries in each case are optimized with SA-3-CAS(8/6), as used in the AIMS dynamics. After excitation to S2, the molecule relaxes to an S2minimum and may subsequently cross a barrier to the S2/S1MECI. The lowest two cationic states, D0, aπ-hole cation, and D1, an n-hole cation, are shown along this linear interpolation pathway with their corresponding photoionization propensities (elec-tronic factors), calculated as described in the text. Rapid relaxation to the minimum on S2leads to higher ionization potentials as well as changes in the photoionization propensities. In the Franck-Condon region (left side of plot), ionization to D0 (π-hole) is favored both energetically and electronically. Near the S2minimum, the D0and D1 cation states become degenerate, and their photoionization propensities are similar. The electronic factor is calculated from the SA-3-CAS-(10,7) neutral and SA-3-CAS(9,7) cation wave functions, and the PES is calculated with SA-3-CAS(10,7)-PT2 and SA-3-CAS(9,7)-PT2 (shifting the neutral states according to eq 12). The analogous plot for thymine is similar (Figure S38 of the Supporting Information).
Figure 8. SA-5-CAS(8/7)-MSPT2 PES of uracil in mass-weighted coordinates showing potential relaxation pathways connecting (1) the FC point, (2) the S2minimum, and (3) the S2/S1MECI. The path that dominates the observed dynamics is shown as a solid arrow, and an alternate barrierless pathway is depicted as a dotted arrow. The analogous plot for thymine (not shown) is similar.
the origin of the picosecond component of the lifetime observed in the TRPES experiments, but confirmation of this suggestion will require longer dynamics simulations and/or application of statistical rate theories.
The picture of the dynamics that results from the AIMS simulations has already been verified in part by location and characterization of the S2minimum and S2/S1MECI for both uracil and thymine using a larger active space (eight electrons in seven orbitals) and including dynamic electron correlation with MS-CASPT2. However, we comment on various technical issues here. First, the CASSCF results are not sensitive to the use of a larger active space or the number of states included in the state-averaging procedure (three or five). Specifically, the vertical excitation energies differ by less than 0.3 eV for both molecules using SA-3-CAS(8/6) or SA-5-CAS(8/7) wave func-tions (Tables S31-S33 of the Supporting Information). There is also little difference between these two CASSCF methods in linear interpolation plots such as that shown in Figure 7. However, there is a large difference (0.8 eV) in the MS-CASPT2 vertical excitation energies for these two CASSCF wave functions. Importantly, this does not arise because of reordering of the states but rather because of mixing between the two lowest ππ* and between the two lowest nπ* states induced by dynamic correlation, i.e., through the multistate correction procedure. On an absolute scale, the amount of mixing is rather small with the dominant coefficient being greater than 0.93 (Figures S3 and S4 of the Supporting Information). However, the energetic consequence is especially large at the Franck-Condon point. When the two correlating higher states (S3and S4, which are nπ* and ππ*, respectively) are included, the MSPT2 vertical excitation energy drops from 6.11 to 5.20 eV for uracil and from 6.19 to 5.17 eV for thymine. Thus, the SA-5-CAS(8/7)-MSPT2 prediction for the vertical excitation energy of uracil is very close to the experimentally observed43absorption maximum at 244 nm (5.08 eV). In Figure 9, we compare the PES’s from SA-3-CAS(8/6) used in the AIMS dynamics and SA-5-CAS-(8/7)-MSPT2, which is able to reproduce the experimental vertical excitation energy. The path chosen in each case corresponds to linear interpolation in internal coordinates
between the S0 minimum, S2 minimum, and S2/S1 MECI determined at the respective level of theory. As expected, the vertical excitation energy is much smaller in the MS-CASPT2 calculation, and therefore the energy scales of the two plots are different. Nevertheless, the main features of the S2PES are seen to be similar in both cases. Estimated barrier heights (upper bounds to the true barrier heights) along this linear interpolation pathway connecting the S2minimum with the S2/S1MECI are 0.16 and 0.28 eV for uracil and thymine, respectively. This demonstrates that our conclusions from the AIMS dynamics remain valid in light of the more accurate potential energy surface from MS-CASPT2.
Table 1 summarizes the energetics of the important points in the AIMS dynamics determined at the 3-CAS(8/6) and SA-5-CAS(8/7)-MSPT2 levels. Interestingly, the S2minimum and the S2/S1MECI are predicted to be nearly degenerate with each other, at both the CAS and the MSPT2 levels of theory. This implies that only direct calculation of the dynamics (as we have done here) can determine whether the molecules will access the MECI directly or first relax (perhaps only partially) in the S2minimum. As shown in Figure 8, the observed population trapping at the S2minimum arises because the mass-weighted distance from the FC point to the S2minimum is smaller than that from the FC point to the S2/S1 MECI. This is primarily
Figure 9. Potential energy curves for uracil using SA-3-CAS(8/6) and SA-5-CAS(8/7)-MSPT2 levels of theory. Shown are the relaxation pathway from the Franck-Condon point to the minimum on the ππ* excited state and barrier crossing from the minimum to the S1/S2MECI. In both cases, the energy zero is that of the S0minimum and the paths are obtained by linear interpolation in internal coordinates between the S0minimum, S2 minimum, S2transition state, and S2/S1MECI geometries. Each of these minimum, transition state, and MECI geometries were explicitly optimized for each level of theory. As expected, the vertical excitation energy is much lower using the more accurate MSPT2 level of theory. (Note the different energy scales in the two plots.) However, the qualitative features of the two surfaces are the same, validating the use of SA-3-CAS(8/6) for the AIMS dynamics. Similar agreement holds for thymine (Figure S39 of the Supporting Information).
TABLE 1: Relative Energies (eV) at Important Geometries of Uracil and Thymine Determined with SA-3-CAS(8/6) and
(in Parenthesis) SA-5-CAS(8/7)-MSPT2a
Franck-Condon S2minimum S2/S1MECI Uracil S0 0.00 (0.00) 1.84 (0.85) 2.97 (1.75) S1 5.11 (4.83) 4.09 (4.29) 5.67 (4.67) S2 7.36 (5.20) 5.72 (4.56) 5.68 (4.68) Thymine S0 0.00 (0.00) 1.96 (0.63) 2.97 (1.62) S1 5.30 (4.88) 4.21 (4.24) 5.84 (4.68) S2 7.49 (5.17) 5.83 (4.47) 5.84 (4.71)
aGeometries in each case are determined by full optimization at the
given level of theory.
because there is little out-of-plane distortion of the heavy ring atoms at the S2minimum.
Conclusions
Quantitative agreement between AIMS and TRPES experi-ments shows conclusively that the femtosecond decay observed in uracil and thymine is due to relaxation to an S2minimum and not to electronic quenching. Although some crossing from S2 to S1 via the S2/S1 MECI is observed with AIMS, the dominant behavior in the first 500 fs is relaxation to a true minimum on S2with diradical character, where the C5-C6and C4-O4 bonds lengthen and the C6 center undergoes sp3 rehybridization. This rapid relaxation on the excited state may be responsible for the broad absorption spectrum, previously thought to be due to rapid electronic quenching.
Barrier crossing on S2(to the S2/S1MECI) may be responsible for the picosecond lifetime that is subsequently observed. As this barrier crossing involves out-of-plane motion of the H attached to C5 (which is CH3in thymine), the difference in picosecond lifetimes may also have a large kinematic compo-nent. To confirm this suggestion, longer dynamics runs and application of statistical rate theories are underway.
The excellent agreement between theory and experiment establishes the accuracy of the AIMS approach to dynamics of electronically excited states and demonstrates its utility in interpreting TRPES experiments. Work is in progress to extend these results to longer time scales, following the excited-state relaxation of thymine and uracil to S0. We are also working to incorporate aqueous environments using hybrid quantum me-chanics/molecular mechanics methods within AIMS.53
Acknowledgment. This work was supported by the National Science Foundation (Grant Nos. CHE-02-311876 and CHE-05-35640). H.R.H. is a National Institutes of Health Molecular Biophysics Training Grantee.
Supporting Information Available: Cartesian coordinates of all optimized structures discussed in the text, details of coordinates used in linear interpolation, details of electronic structure calculations, and further figures for thymine. This material is available free of charge via the Internet at http:// pubs.acs.org.
References and Notes
(1) Ullrich, S.; Schultz, T.; Zgierski, M. Z.; Stolow, A. Phys. Chem.
Chem. Phys. 2004, 6, 2796.
(2) Crespo-Hernandez, C. E.; Cohen, B.; Hare, P. M.; Kohler, B. Chem.
ReV. 2004, 104, 1977.
(3) Crespo-Hernandez, C. E.; Cohen, B.; Kohler, B. Nature 2005, 436, 1141.
(4) Blancafort, L.; Cohen, B.; Hare, P. M.; Kohler, B.; Robb, M. A. J.
Phys. Chem. A 2005, 109, 4431.
(5) Lorentzon, J.; Fuelscher, M. P.; Roos, B. O. J. Am. Chem. Soc.
1995, 117, 9265.
(6) Merchan, M.; Serrano-Andres, L. J. Am. Chem. Soc. 2003, 125, 8108.
(7) Matsika, S. J. Phys. Chem. A 2004, 108, 7584.
(8) Perun, S.; Sobolewski, A. L.; Domcke, W. J. Phys. Chem. A 2006,
110, 13238.
(9) He, Y.; Wu, C.; Kong, W. J. Phys. Chem. A 2003, 107, 5145. (10) Schreier, W. J.; Schrader, T. E.; Koller, F. O.; Gilch, P.; Crespo-Hernandez, C. E.; Swaminathan, V. N.; Carrell, T.; Zinth, W.; Kohler, B.
Science 2007, 315, 625.
(11) Ullrich, S.; Schultz, T.; Zgierski, M. Z.; Stolow, A. J. Am. Chem.
Soc. 2004, 126, 2262.
(12) Satzger, H.; Townsend, D.; Zgierski, M. Z.; Patchkovskii, S.; Ullrich, S.; Stolow, A. Proc. Natl. Acad. Sci. U.S.A. 2006, 103, 10196.
(13) Canuel, C.; Mons, M.; Piuzzi, F.; Tardivel, B.; Dimicoli, I.; Elhanine, M. J. Chem. Phys. 2005, 122, 074316.
(14) Kang, H.; Lee, K. T.; Jung, B.; Ko, Y. J.; Kim, S. K. J. Am. Chem.
Soc. 2002, 124, 12958.
(15) Zgierski, M. Z.; Patchkovskii, S.; Fujiwara, T.; Lim, E. C. J. Phys.
Chem. A 2005, 109, 9384.
(16) Fulscher, M.; Roos, B. O. J. Am. Chem. Soc. 1995, 117, 2089. (17) Shukla, M.; Leszczynski, J. J. Comput. Chem. 2004, 25, 768. (18) Zgierski, M. Z.; Alavi, S. Chem. Phys. Lett. 2006, 426, 398. (19) Stolow, A. Annu. ReV. Phys. Chem. 2003, 54, 89.
(20) Stolow, A.; Bragg, A. E.; Neumark, D. M. Chem. ReV. 2004, 104, 1719.
(21) Ben-Nun, M.; Martı´nez, T. J. J. Chem. Phys. 1998, 108, 7244. (22) Ben-Nun, M.; Martinez, T. J. AdV. Chem. Phys. 2002, 121, 439. (23) Ben-Nun, M.; Quenneville, J.; Martı´nez, T. J. J. Phys. Chem. A
2000, 104, 5161.
(24) Coe, J.; Martinez, T. J. J. Am. Chem. Soc. 2005, 127, 4560. (25) Seel, M.; Domcke, W. J. Chem. Phys. 1991, 95, 7806. (26) Arasaki, Y.; Takatsuka, K.; Wang, K.; McKoy, V. Chem. Phys.
Lett. 1999, 302, 363.
(27) Batista, V. S.; Zanni, M. T.; Greenblatt, B. J.; Neumark, D. M.; Miller, W. H. J. Chem. Phys. 1999, 110, 3736.
(28) Seideman, T. J. Chem. Phys. 2000, 113, 1677.
(29) Ichino, T.; Gianola, A. J.; Lineberger, W. C.; Stanton, J. F. J. Chem.
Phys. 2006, 125, 084312.
(30) Meier, C.; Engel, V. J. Chem. Phys. 1994, 101, 2673.
(31) Blanchet, V.; Zgierski, M. Z.; Stolow, A. J. Chem. Phys. 2001,
114, 1194.
(32) Schmitt, M.; Lochbrunner, S.; Shaffer, J. P.; Larsen, J. J.; Zgierski, M. Z.; Stolow, A. J. Chem. Phys. 2001, 114, 1206.
(33) Rabalais, J. W. Principles of UltraViolet Photoelectron
Spectros-copy; John Wiley and Sons: New York, 1977. (34) Pickup, B. T. Chem. Phys. 1977, 19, 193.
(35) Deleuze, M. S.; Cederbaum, L. S. Int. J. Quantum Chem. 1997,
63, 465.
(36) Roos, B. O. AdV. Chem. Phys. 1987, 69, 399. (37) Roos, B. O. Acc. Chem. Res. 1999, 32, 137.
(38) Frisch, M. J.; Pople, J. A.; Binkley, J. S. J. Chem. Phys. 1984, 80, 3265.
(39) Hehre, W. J.; Ditchfield, R.; Pople, J. A. J. Chem. Phys. 1972, 56, 2257.
(40) Hillery, M.; O’Connell, R. F.; Scully, M. O.; Wigner, E. P. Phys.
Rep. 1984, 106, 121.
(41) Gustavsson, T.; Banyasz, A.; Lazzarotto, E.; Markovitsi, D.; Scalamani, G.; Frisch, M. J.; Barone, V.; Improta, R. J. Am. Chem. Soc.
2006, 128, 607.
(42) Brady, B. B.; Peteanu, L. A.; Levy, D. H. Chem. Phys. Lett. 1988,
147, 538.
(43) Clark, L. B.; Peschel, G. G.; Tinoco, I. J. J. Phys. Chem. 1965, 69, 3615.
(44) Dougherty, D.; Wittel, K.; Meeks, J.; McGlynn, S. P. J. Am. Chem.
Soc. 1976, 98, 3815.
(45) Szabo, A.; Ostlund, N. S. Modern Quantum Chemistry; Dover: Mineola, 1996.
(46) Finley, J.; Malmqvist, P.-A.; Roos, B. O.; Serrano-Andres, L. Chem.
Phys. Lett. 1998, 288, 299.
(47) Werner, H.-J. Mol. Phys. 1996, 89, 645.
(48) Karlstrom, G.; Lindh, R.; Malmqvist, P.-A.; Roos, B. O.; Ryde, U.; Veryazov, V.; Widmark, P.-O.; Cossi, M.; Schimmelpfennig, B.; Neogrady, P.; Seijo, L. Comput. Mater. Sci. 2003, 28, 222.
(49) Levine, B. G.; Ko, C.; Quenneville, J.; Martinez, T. J. Mol. Phys.
2006, 104, 1053.
(50) Levine, B. G.; Coe, J. D.; Martinez, T. J. Optimization of conical intersections with multistate multireference perturbation theory, to be submitted for publication.
(51) Eland, J. H. D. Photoelectron Spectroscopy; Butterworths: London, 1984.
(52) Berkowitz, J. Photoabsorption, Photoionization, and Photoelectron
Spectroscopy; Academic Press: New York, 1979.
(53) Toniolo, A.; Olsen, S.; Manohar, L.; Martinez, T. J. Faraday
Discuss. 2004, 127, 149.