Publisher’s version / Version de l'éditeur:
Questions? Contact the NRC Publications Archive team at
PublicationsArchive-ArchivesPublications@nrc-cnrc.gc.ca. If you wish to email the authors directly, please see the first page of the publication for their contact information.
https://publications-cnrc.canada.ca/fra/droits
L’accès à ce site Web et l’utilisation de son contenu sont assujettis aux conditions présentées dans le site LISEZ CES CONDITIONS ATTENTIVEMENT AVANT D’UTILISER CE SITE WEB.
Client Report (National Research Council of Canada. Construction), 2014-12
READ THESE TERMS AND CONDITIONS CAREFULLY BEFORE USING THIS WEBSITE. https://nrc-publications.canada.ca/eng/copyright
NRC Publications Archive Record / Notice des Archives des publications du CNRC : https://nrc-publications.canada.ca/eng/view/object/?id=a8ad663c-2bc6-4e6a-88d7-fbcd602433b2 https://publications-cnrc.canada.ca/fra/voir/objet/?id=a8ad663c-2bc6-4e6a-88d7-fbcd602433b2
NRC Publications Archive
Archives des publications du CNRC
For the publisher’s version, please access the DOI link below./ Pour consulter la version de l’éditeur, utilisez le lien DOI ci-dessous.
https://doi.org/10.4224/21274572
Access and use of this website and the material on it are subject to the Terms and Conditions set forth at
Solutions for mid-rise wood construction: encapsulation time data
from NRC Fire-Resistance Projects: report to Research Consortium for
Wood and Wood-Hybrid Mid-Rise Buildings
NATIONAL RESEARCH COUNCIL CANADA
REPORT TO RESEARCH CONSORTIUM
FOR WOOD AND WOOD-HYBRID
MID-RISE BUILDINGS
Solutions for Mid-Rise Wood Construction:
Encapsulation Time Data from NRC
Fire-resistance Projects
CLIENT REPORT: A1-100035-01.14
December 31, 2014
REPORT TO RESEARCH CONSORTIUM FOR WOOD AND
WOOD-HYBRID MID-RISE BUILDINGS
Solutions for Mid-Rise Wood Construction:
Encapsulation Time Data from NRC Fire-resistance Projects
G.D. Lougheed, J.Z. Su and N. Bénichou
Report No. A1-100035-01.14
Report date: December 31, 2014 Contract No. B-7000 (A1-100035) Prepared for Canadian Wood Council
FPInnovations
Régie du bâtiment du Québec
HER MAJESTY THE QUEEN IN RIGHT OF ONTARIO as represented by the Minister of Municipal Affairs and Housing
133 pages
This report may not be reproduced in whole or in part without the written consent of both the
TABLE OF CONTENTS
Contents
1 Introduction...1
2 Encapsulation...2
3 NRC Fire-Resistance Projects...3
4 Small-scale Wall Assemblies...4
4.1 Small-scale Assemblies and Thermocouple Locations – Walls Phase 1 ...4
4.2 Encapsulation Times Based on Temperature Increase Criteria – Small-scale Wall Assemblies – Walls Phase 1...5
4.3 Results and Discussion – Small-scale Wall Assemblies – Walls Phase 1 ...6
5 Full-scale Wall assemblies ...22
5.1 Walls Phase 1...22
5.1.1 Full-scale Wall Assemblies and Thermocouple Locations – Walls Phase 1...22
5.1.2 Average Temperature Increase Profiles – Full-scale Wall Assemblies – Walls Phase 1...24
5.1.3 Encapsulation Times Based on Temperature Increase Criteria – Full-scale Wall Assemblies – Walls Phase 1 ...26
5.1.4 Results and Discussion – Type X Gypsum Board – Full-scale Wall Assemblies – Walls Phase 1 ...26
5.1.5 Results and Discussion – Regular Gypsum Board – Full-scale Wall Assemblies – Walls Phase 1 ...27
5.1.6 Results and Discussion – All Full-scale Wall Assemblies – Walls Phase 1...27
5.2 Walls Phase 2...41
5.2.1 Full-scale Wood-frame Wall Assemblies and Thermocouple Locations – Walls Phase 2...41
5.2.2 Average Temperature Increase Profiles – Full-scale Wood-frame Wall Assemblies – Walls Phase 2 ...42
5.2.3 Full-scale Steel-frame Wall Assemblies and Thermocouple Locations – Walls Phase 2...43
5.2.4 Average Temperature Increase Profiles – Full-scale Steel-frame Wall Assemblies – Walls Phase 2 ...44
5.2.5 Encapsulation Times Based on Temperature Increase Criteria – Walls Phase 2 .44 5.2.6 Results and Discussion – Walls Phase 2 ...45
5.3 Other Recent Fire-resistance Tests for Wall Assemblies...61
5.3.1 Full-scale CLT Wall Assembly and Thermocouple Locations ...61
5.3.3 Full-scale Lightweight Wood-frame Mid-rise Wall Assemblies and Thermocouple
Locations...61
5.3.4 Average Temperature Increase Profiles – Full-scale Lightweight Wood-frame Mid-rise Wall Assemblies ...62
5.3.5 Encapsulation Times Based on Temperature Increase Criteria – Full-scale CLT and Mid-rise Wall Assemblies...62
5.3.6 Results and Discussion – Full-scale CLT and Mid-rise Wall Assemblies...62
6 Full-scale Lightweight Wood- and Steel-frame Floor assemblies...74
6.1.1 Full-scale Lightweight Wood- and Steel-frame Floor Assemblies and Thermocouple Locations – Floors Phase 1 and Floors Phase 2 ...74
6.1.2 Average Temperature Increase Profiles – Floors Phase 1 and Floors Phase 2....74
6.1.3 Encapsulation Times Based on Temperature Increase Criteria – Floors Phase 1 and Floors Phase 2 ...78
6.1.4 Results and Discussion – Floors Phase 1 and Floors Phase 2 ...79
7 Full-scale CLT Floor Assemblies ...116
7.1.1 Thermocouple Locations...116
7.1.2 Average Temperature Increase Profiles...116
7.1.3 Encapsulation Times Based on Temperature Increase Criteria...116
7.1.4 Results and Discussion...116
8 Comparative Discussion of Encapsulation Times for Type X Gypsum Board...119
8.1 Single Layer of 12.7 mm Thick Type X Gypsum Board ...119
8.2 Single Layer of 15.9 mm Thick Type X Gypsum Board ...120
8.3 Double Layer of 12.7 mm Thick Type X Gypsum Board...121
8.4 Double Layer of 15.9 mm Thick Type X Gypsum Board...122
9 Summary...131
10 Acknowledgments ...131
LIST OF FIGURES
Figure 1. Typical small-scale wall test assembly with wood studs and 2 layers of gypsum
board. ...8 Figure 2. Typical small-scale wall test assembly with steel studs and 2 layers of gypsum board.9 Figure 3. Typical small-scale wall test assembly with resilient channels...10 Figure 4. Small-scale wall assembly tests (Walls Phase 1) – times at which 140C average and
180ºC single point temperature increases (Criteria 1) were reached...11 Figure 5. Small-scale wall assembly tests (Walls Phase 1) – times at which 195C average and
250ºC single point temperature increases (Criteria 2) were reached...12 Figure 6. Small-scale wall assembly tests (Walls Phase 1) – times at which 250C average and
270C single point temperature increases (Criteria 3) were reached. ...13 Figure 7. Differences in times between Criteria 1 and Criteria 2 results for small-scale wall
assemblies in Walls Phase 1. ...14 Figure 8. Differences in times between Criteria 1 and Criteria 3 results for small-scale wall
assemblies in Walls Phase 1. ...15 Figure 9. Full-scale wood-frame wall assembly with resilient channels on the exposed side. ....28 Figure 10. Full-scale steel-frame wall assembly. ...29 Figure 11. Average temperature increases – gypsum board/stud interface – wood-frame wall
assemblies with Type X gypsum board...30 Figure 12. Average temperature increases – gypsum board/cavity interface – wood-frame wall
assemblies with Type X gypsum board...30 Figure 13. Average temperature increases – gypsum board/stud interface – steel-frame wall
assemblies with one layer of 12.7 mm thick Type X gypsum board...31 Figure 14. Average temperature increases – gypsum board/cavity interface – steel-frame wall
assemblies with one layer of 12.7 mm thick Type X gypsum board...31 Figure 15. Average temperature increases – gypsum board/stud interface – wood- and
steel-frame wall assemblies with regular gypsum board. ...32 Figure 16. Average temperature increases – gypsum board/cavity interface – wood- and
steel-frame wall assemblies with regular gypsum board. ...32 Figure 17. Full-scale wall assembly tests (Walls Phase 1) – times at which 140ºC average and
180ºC single point temperature increases (Criteria 1) were reached...33 Figure 18. Full-scale wall assembly tests (Walls Phase 1) – times at which 195ºC average and
250ºC single point temperature increases (Criteria 2) were reached...34 Figure 19. Full-scale wall assembly tests (Walls Phase 1) – times at which 250ºC average and
270ºC single point temperature increases (Criteria 3) were reached...35 Figure 20. Differences in times between Criteria 1 and Criteria 2 results for full-scale wall
assemblies in Walls Phase 1. ...36 Figure 21. Differences in times between Criteria 1 and Criteria 3 results for full-scale wall
assemblies in Walls Phase 1. ...37 Figure 22. Average temperature increases for wood-frame wall assemblies with shear panels as
the base layer on the exposed side. ...47 Figure 23. Average temperature increases – gypsum board/stud interface – wood-frame wall
assemblies with glass fibre insulation. ...48 Figure 24. Average temperature increases – gypsum board/cavity interface – wood-frame wall
assemblies with glass fibre insulation. ...48 Figure 25. Average temperature increases – gypsum board/stud interface – wood-frame wall
assemblies with rock and cellulose fibre insulation. ...49 Figure 26. Average temperature increases – gypsum board/cavity interface – wood-frame wall
Figure 27. Average temperature increases – face layer/base layer interface for steel-frame wall assemblies...50 Figure 28. Average temperature increases – base layer/stud interface steel-frame wall
assemblies...50 Figure 29. Average temperature increases – base layer/cavity interface – steel-frame wall
assemblies...51 Figure 30. Full-scale wall assembly tests (Walls Phase 2) – times at which 140ºC average and
180ºC single point temperature increases (Criteria 1) were reached...52 Figure 31. Full-scale wall assembly tests (Walls Phase 2) – times at which 195ºC average and
250ºC single point temperature increases (Criteria 2) were reached...53 Figure 32. Full-scale wall assembly tests (Walls Phase 2) – times at which 250ºC average and
270ºC single point temperature increases (Criteria 3) were reached...54 Figure 33. Differences in times between Criteria 1 and Criteria 2 results for full-scale wall
assemblies in Walls Phase 2. ...55 Figure 34. Differences in times between Criteria 1 and Criteria 3 results for full-scale wall
assemblies in Walls Phase 2. ...56 Figure 35. Average temperature increase at the gypsum board/CLT interface...64 Figure 36. Average temperature increases – gypsum board face layer/base layer interface –
mid-rise wall assemblies. ...64 Figure 37. Average temperature increases – gypsum board/stud interface – mid-rise wall
assemblies...65 Figure 38. Average temperature increases – gypsum board/cavity interface – mid-rise wall
assemblies...65 Figure 39. Mid-rise lightweight wood-frame and CLT wall assembly tests – times at which 140ºC
average and 180ºC single point temperature increases (Criteria 1) were reached. ..66 Figure 40. Mid-rise lightweight wood-frame and CLT wall assembly tests – times at which 195ºC
average and 250ºC single point temperature increases (Criteria 2) were reached. ..67 Figure 41. Mid-rise lightweight wood-frame and CLT wall assembly tests – times at which 250ºC
average and 270ºC single point temperature increases (Criteria 3) were reached. ..68 Figure 42. Differences in times between Criteria 1 and Criteria 2 results for mid-rise lightweight
wood-frame and CLT wall assemblies. ...69 Figure 43. Differences in times between Criteria 1 and Criteria 3 results for mid-rise lightweight
wood-frame and CLT wall assemblies. ...70 Figure 44. Average temperature increases – gypsum board/joist interface – 1 layer of 12.7 mm
gypsum board on wood joists...83 Figure 45. Average temperature increases – gypsum board/cavity interface – 1 layer of 12.7 mm
Type X gypsum board on wood joists. ...83 Figure 46. Average temperature increases – gypsum board/joist interface – 1 layer of 12.7 mm
Type X gypsum board on wood I-joists. ...84 Figure 47. Average temperature increases – gypsum board/cavity interface – 1 layer of 12.7 mm
Type X gypsum board on wood I-joists. ...84 Figure 48. Average temperature increases – gypsum board/joist interface – 1 layer of 15.9 mm
Type X gypsum board on wood joists. ...85 Figure 49. Average temperature increases – gypsum board/cavity interface – 1 layer of 15.9 mm
Type X gypsum board on wood joists. ...85 Figure 50. Average temperature increases – gypsum board/joist interface – 1 layer of 15.9 mm
Type X gypsum board on wood I-joists. ...86 Figure 51. Average temperature increases – gypsum board/cavity interface – 1 layer of 15.9 mm
Type X gypsum board on wood I-joists. ...86 Figure 52. Average temperature increases – gypsum board/joist interface – 1 layer of Type X
Figure 53. Average temperature increases – gypsum board/cavity interface – 1 layer of Type X gypsum board on steel C-joists...87 Figure 54. Average temperature increases – gypsum board/joist interface – 2 layers of 12.7 mm Type X gypsum board on wood joists (various cavity insulations). ...88 Figure 55. Average temperature increases – gypsum board/cavity interface – 2 layers of
12.7 mm Type X gypsum board on wood joists (various cavity insulations). ...88 Figure 56. Average temperature increases – gypsum board/joist interface – 2 layers of
12.7 Type X gypsum board on wood joists (glass fibre insulation). ...89 Figure 57. Average temperature increases – gypsum board/cavity interface – 2 layers of
12.7 mm Type X gypsum board on wood joists (glass fibre insulation). ...89 Figure 58. Average temperature increases – gypsum board/joist interface – 2 layers of 12.7 mm Type X gypsum board on wood I-joists (various cavity insulations)...90 Figure 59. Average temperature increases – gypsum board/cavity interface – 2 layers of
12.7 Type X gypsum board on wood I-joists (various cavity insulations). ...90 Figure 60. Average temperature increases – gypsum board/joist interface – 2 layers of 12.7 mm Type X gypsum board on wood I-joists (glass fibre insulations). ...91 Figure 61. Average temperature increases – gypsum board/cavity interface – 2 layers of
12.7 mm Type X gypsum board on wood I-joists (glass fibre insulations)...91 Figure 62. Average temperature increases – gypsum board/joist interface – 2 layers of 12.7 mm Type X gypsum board on wood trusses (various cavity insulations)...92 Figure 63. Average temperature increases – gypsum board/cavity interface – 2 layers of
12.7 mm Type X gypsum board on wood trusses (various cavity insulations). ...92 Figure 64. Average temperature increases – gypsum board/joist interface – 2 layers of 12.7 mm Type X gypsum board on wood trusses (glass fibre insulation)...93 Figure 65. Average temperature increases – gypsum board/cavity interface – 2 layers of
12.7 mm Type X gypsum board on wood trusses (glass fibre insulation). ...93 Figure 66. Average temperature increases – gypsum board/joist interface – 2 layers of 15.9 mm Type X gypsum board on engineered wood joists...94 Figure 67. Average temperature increases – gypsum board/cavity interface – 2 layers of 15.9
mm Type X gypsum board on engineered wood joists...94 Figure 68. Average temperature increases – gypsum board/joist interface – 2 layers of 12.7 mm Type X gypsum board on steel C-joists...95 Figure 69. Average temperature increases – gypsum board/cavity interface – 2 layers of
12.7 mm Type X gypsum board on steel C-joists...95 Figure 70. Full-scale floor assembly tests with a single layer of Type X gypsum board – times at which 140C average and 180ºC single point temperature increases (Criteria 1) were reached. ...96 Figure 71. Full-scale floor assembly tests with a single layer of Type X gypsum board – times at
which 195C average and 250ºC single point temperature increases (Criteria 2) were reached. ...97 Figure 72. Full-scale floor assembly tests with a single layer of Type X gypsum board – times at which 250C average and 270C single point temperature increases (Criteria 3) were reached. ...98 Figure 73. Differences in times between Criteria 1 and Criteria 2 results for floor assemblies with
a single layer of Type X gypsum board. ...99 Figure 74. Differences in times between Criteria 1 and Criteria 3 results for floor assemblies with
a single layer of Type X gypsum board. ...100 Figure 75. Full-scale floor assembly tests with 2 layers of Type X gypsum board – times at
which 140C average and 180ºC single point temperature increases (Criteria 1) were reached. ...101
Figure 76. Full-scale floor assembly tests with a double layer of Type X gypsum board – times at which 195C average and 250ºC single point temperature increases (Criteria 2) were reached...102 Figure 77. Full-scale floor assembly tests with a double layer of Type X gypsum board – times
at which 250C average and 270ºC single point temperature increases (Criteria 3) were reached...103 Figure 78. Differences in times between Criteria 1 and Criteria 2 results for floor assemblies with
a double layer of Type X gypsum board...104 Figure 79. Differences in times between Criteria 1 and Criteria 3 results for floor assemblies with
a double layer of Type X gypsum board...105 Figure 80. Average temperature increases at the gypsum board/CLT interface (floors). ...117 Figure 81. Summary of results based on Criteria 3 for 1 layer of 12.7 mm thick Type X gypsum
board. ...123 Figure 82. Summary of results based on Criteria 3 for 1 layer of 15.9 mm thick Type X gypsum
board. ...124 Figure 83. Summary of results based on Criteria 3 for 2 layers of 12.7 mm thick Type X gypsum board. ...125 Figure 84. Summary of results based on Criteria 3 for 2 layers of 15.9 mm thick Type X gypsum board. ...126
LIST OF TABLES
Table 1. Times at which the temperature increases exceeded the three sets of temperature criteria: Small-scale wall assembly tests with 1 layer of 12.7 mm Type X gypsum board on exposed side of unloaded steel studs (gypsum board/stud and gypsum board/cavity interfaces). ...16 Table 2. Times at which the temperature increases exceeded the three sets of temperature
criteria: Small-scale wall assembly tests with 2 layers of 12.7 mm Type X gypsum board on exposed side of unloaded steel studs (gypsum board base layer/stud and base layer/cavity interfaces)...17 Table 3. Times at which the temperature increases exceeded the three sets of temperature
criteria: Small-scale wall assembly tests with 1 layer of 15.9 mm Type X gypsum board on exposed side of unloaded steel studs (gypsum board/stud and gypsum board/cavity interfaces). ...18 Table 4. Times at which the temperature increases exceeded the three sets of temperature
criteria: Small-scale wall assembly tests with 1 layer of 12.7 mm Type X gypsum board on exposed side of unloaded wood studs (gypsum board/stud and gypsum board/cavity interfaces). ...19 Table 5. Times at which the temperature increases exceeded the three sets of temperature
criteria: Small-scale wall assembly tests with 2 layers of 12.7 mm Type X gypsum board on unloaded wood studs (gypsum board base layer/stud and base layer/cavity interfaces). ...20 Table 6. Times at which the temperature increases exceeded the three sets of temperature
criteria: Small-scale unloaded wall assembly tests with 2 layers of 12.7 mm regular gypsum board on the exposed side (gypsum board base layer/stud and base
layer/cavity interfaces)...21 Table 7. Times at which the temperature increases exceeded the three sets of temperature
criteria: Full-scale wall assembly tests with Type X gypsum board on the exposed side on loaded wood studs (gypsum board/stud and gypsum board/cavity
interfaces). ...38 Table 8. Times at which the temperature increases exceeded the three sets of temperature
criteria: Full-scale wall assembly tests with 1 layer of 12.7 mm thick Type X gypsum board on the exposed side on unloaded steel studs (gypsum board/stud and gypsum board/cavity interfaces). ...39 Table 9. Times at which the temperature increases exceeded the three sets of temperature
criteria: Full-scale non-insulated wall assembly tests with regular gypsum board (gypsum board/stud and gypsum board/cavity interfaces)...40 Table 10. Times at which the temperature increases exceeded the three sets of temperature
criteria: Full-scale wall assembly tests with 12.7 mm Type X gypsum board and a wood shear panel as base layer on exposed side on loaded wood studs (12.7 mm Type X gypsum board/shear panel interface). ...57 Table 11. Times at which the temperature increases exceeded the three sets of temperature
criteria: Full-scale wall assembly tests with 12.7 mm Type X gypsum board and a wood shear panel as base layer on exposed side on loaded wood studs (shear panel/stud and shear panel/cavity interfaces)...57 Table 12. Times at which the temperature increases exceeded the three sets of temperature
criteria: Full-scale wall assembly tests with 1 layer of 12.7 mm Type X gypsum board on loaded wood studs (gypsum board/stud and gypsum board/cavity interfaces)...58 Table 13. Times at which the temperature increases exceeded the three sets of temperature
criteria: Full-scale wall assembly tests with 12.7 mm Type X gypsum board on loaded steel studs (face layer/base layer interface). ...59
Table 14. Times at which the temperature increases exceeded the three sets of temperature criteria: Full-scale wall assembly tests with 12.7 mm Type X gypsum board on loaded steel studs (base layer/stud and base layer/cavity interfaces). ...60 Table 15. Times at which the temperature increase exceeded the three sets of temperature
criteria: Full-scale test with 2 layers of 12.7 mm Type X gypsum board on a loaded CLT wall assembly (gypsum board base layer/CLT interface). ...71 Table 16. Full-scale loaded mid-rise wall assemblies with 2 layers of 12.7 mm Type X gypsum
board on both sides on wood studs...71 Table 17. Times at which the temperature increases exceeded the three sets of temperature
criteria: Full-scale mid-rise wall assembly tests with 2 layers of 12.7 mm Type X gypsum board on loaded staggered wood studs (Type X gypsum board face
layer/base layer interface). ...72 Table 18. Times at which the temperature increases exceeded the three sets of temperature
criteria: Full-scale mid-rise wall assembly tests with 2 layers of 12.7 mm Type X gypsum board on loaded staggered wood studs (Type X gypsum board base
layer/stud and base layer/cavity interfaces)...73 Table 19. Times at which the temperature increases exceeded the three sets of temperature
criteria: Full-scale floor assembly tests with 1 layer of 12.7 mm Type X gypsum board on loaded solid wood joists (gypsum board/joist and gypsum board/cavity
interfaces). ...106 Table 20. Times at which the temperature increases exceeded the three sets of temperature
criteria: Full-scale floor assembly tests with 1 layer of 12.7 mm Type X gypsum board on loaded wood I-joists (gypsum board/joist and gypsum board/cavity interfaces). .107 Table 21. Times at which the temperature increases exceeded the three sets of temperature
criteria: Full-scale floor assembly tests with 1 layer of 15.9 mm Type X gypsum board on loaded solid wood joists (gypsum board/joist and gypsum board/cavity
interfaces). ...108 Table 22. Times at which the temperature increases exceeded the three sets of temperature
criteria: Full-scale floor assembly tests with 1 layer of 15.9 mm Type X gypsum board on loaded wood I-joists (gypsum board/joist and gypsum board/cavity interfaces). 109 Table 23. Times at which the temperature increases exceeded the three sets of temperature
criteria: Full scale- floor assembly tests with 1 layer of Type X gypsum board on loaded steel C-joists (gypsum board/joist and gypsum board/cavity interfaces)...110 Table 24. Times at which the temperature increases exceeded the three sets of temperature
criteria: Full-scale floor assembly tests with 2 layers of 12.7 mm Type X gypsum board on loaded solid wood joists (gypsum board base layer/joist and base
layer/cavity interfaces)...111 Table 25. Times at which the temperature increases exceeded the three sets of temperature
criteria: Full-scale floor assembly tests with 2 layesr of 12.7 mm Type X gypsum board on loaded wood I-joists (gypsum board base layer/joist and base layer/cavity interfaces). ...112 Table 26. Times at which the temperature increases exceeded the three sets of temperature
criteria: Full-scale floor assembly tests with 2 layers of 12.7 mm Type X gypsum board on loaded wood trusses (gypsum board base layer/truss and base layer/cavity interfaces). ...113 Table 27. Times at which the temperature increases exceeded the three sets of temperature
criteria: Full-scale floor assembly tests with 2 layers of 15.9 mm Type X gypsum board on loaded engineered wood joists (gypsum board base layer/joist and base layer/cavity interfaces)...114 Table 28. Times at which the temperature increases exceeded the three sets of temperature
board on loaded steel C-joists (gypsum board base layer/joist and base layer/cavity interfaces). ...115 Table 29. Times at which the temperature increases exceeded the three sets of temperature
criteria: Full-scale tests of loaded CLT floor assemblies (gypsum board/CLT
interface)...118 Table 30. Encapsulation times based on Criteria 3 for 1 layer of 12.7 mm thick Type X gypsum
board...127 Table 31. Encapsulation times based on Criteria 3 for 1 layer of 15.9 mm thick Type X gypsum
board...128 Table 32. Encapsulation times based on Criteria 3 for 2 layers of 12.7 mm thick Type X gypsum board...129 Table 33. Encapsulation times based on Criteria 3 for 2 layers of 15.9 mm thick Type X gypsum board...130
SOLUTIONS FOR MID-RISE WOOD CONSTRUCTION:
ENCAPSULATION TIME DATA FROM NRC FIRE-RESISTANCE PROJECTS G.D. Lougheed, J.Z. Su and N. Bénichou
1 INTRODUCTION
The acceptable solutions provided in the 2010 National Building Code (NBC) Division B [1] limits the use of combustible (wood) construction based on building height. For example, for Group C (Residential), Group D (Business and Personal Services) and Group E (Mercantile) occupancies, combustible construction can be used up to 4 storeys, and up to 2 storeys for Group A – Division 2 (Assembly) occupancies. In addition to the building height limitation, there are also building area limitations in the 2010 NBC for the use of combustible construction for these occupancies. For buildings that exceed the height and area requirements for combustible construction, the prescriptive requirements in the 2010 NBC require that noncombustible construction be used for the primary structural elements.
The prescriptive construction requirements for fire safety and protection of buildings, which are dependent upon the building size and occupancy type, are provided in Subsection 3.2.2 of the 2010 NBC. This includes the identification of the buildings for which noncombustible
construction is required. The intent of the prescriptive requirements for noncombustible
construction as they relate to the NBC fire safety/fire protection of building objectives is “to limit
the probability that combustible construction materials within a storey of a building will be involved in a fire, which could lead to the growth of fire, which could lead to the spread of fire within the storey during the time required to achieve occupant safety and for emergency responders to perform their duties, which could lead to harm to persons/damage to the building”.
The 2010 NBC defines noncombustible construction as “that type of construction in which a
degree of fire safety is attained by use of noncombustible construction materials for structural members and other building assemblies” [1]. Article 3.1.5.1 requires that a building or part of a
building required to be of noncombustible construction be constructed using noncombustible materials. The intent of this requirement, as it relates to the NBC fire safety/fire protection of building objectives, is “to limit the probability that construction materials will contribute to the
growth and spread of fire, which would lead to harm to persons/damage to the building”.
The NBC does permit, as exceptions, an extensive use of combustible materials in buildings otherwise required to have their primary structural elements to be of noncombustible
construction. The allowed materials and associated limitations are primarily provided in Articles 3.1.5.2 to 3.1.5.21. Generally, the combustible elements permitted relate to interior finishes, gypsum board, combustible roofing materials, combustible plumbing fixtures, cabling, protected insulation, flooring, combustible glazing, combustible cladding systems, non-loadbearing framing elements in partitions, stairs in dwellings, and trim and millwork, among others. Divisions B of the NBC (the “acceptable solutions” portion of the Code) generally does not permit combustible materials to be used for the primary structural elements in buildings required to be of noncombustible construction. In the Scoping Study [2] for mid-rise and hybrid buildings, it was suggested that an alternative solution using wood construction may be developed to meet
As one approach, encapsulation materials could be used to protect the combustible (wood) structural materials for a period of time in order to delay the effects of the fire on the combustible structural elements, including delay of ignition. In delaying ignition, any effects of the
combustion of the combustible structural elements on the fire severity can be delayed. In some cases, and depending upon the amount of encapsulating material used (e.g. number of layers), ignition of the elements might be avoided completely. This scenario would primarily depend upon the fire event and the actual fire performance of the encapsulating materials used. A research project, Wood and Wood-Hybrid Midrise Buildings, was undertaken to develop information to be used as the basis for alternative/acceptable solutions for mid-rise construction using wood structural elements. One of the Tasks in the project was to investigate the
effectiveness of three materials for use as encapsulation materials for combustible structural elements: Type X gypsum board, cement board and gypsum-concrete. Cone calorimeter and intermediate-scale furnace tests were conducted for these materials. The results of the tests on these materials using the cone calorimeter and the intermediate-scale furnace are provided in References 3 and 4, respectively.
In addition to the tests for the three encapsulation materials, data from previous NRC fire-resistance projects were reviewed for data on the encapsulation time for structural elements afforded by gypsum board in the context of standard fire-resistance testing. In this report, the results of the data-mining from several of NRC’s fire-resistance testing projects are provided.
2 ENCAPSULATION
Encapsulation is frequently used to protect structural elements to increase their fire-resistance performance. For example, steel columns and beams can be encapsulated using materials with low thermal conductivity to increase the fire-resistance performance of the structural elements. Reinforced concrete is a composite material of steel and concrete and is usually protected by a non-loadbearing layer of concrete, referred to as “cover” of 20 to 35 mm thickness that protects the load-bearing composite structure. Also, encapsulation is used in lightweight wood- and steel-frame structural assemblies, to delay the effects of the fire on the structural elements to provide the required fire-resistance rating.
In Europe, the protection of combustible structural elements by encapsulation is used to delay the contribution of combustible building elements to a fire [5]. The structural building elements are encapsulated using a protective cover such as gypsum board or other lining material, which delays the effect of the fire on the combustible material and thus the contribution of the
combustible structural element to the fire.
The criteria used in Europe to assess the performance of an encapsulation system under standard time-temperature exposures are:
a) the average temperature rise at the interface between the encapsulation system and the protected structural element is limited to 250ºC, and
b) the maximum temperature rise at any point at the interface does not exceed 270ºC. These criteria are based on a charring temperature for structural timber of 300ºC [5 and 6].
In this report, the above-mentioned European criteria for evaluating the performance of encapsulation systems are one of three sets of criteria investigated (Criteria 3). The other two sets of criteria investigated are based on temperature criteria used in CAN/ULC-S101 [7] and CAN/ULC-S124 [8]:
1. Criteria 1.
a) The average temperature rise at the interface between the encapsulation system and the protected building element is limited to 140ºC, and
b) the maximum temperature rise at any point at the interface does not exceed 180ºC.
2. Criteria 2.
a) The average temperature rise at the interface between the encapsulation system and the protected building element is limited to 195ºC, and
b) the maximum temperature rise at any point at the interface does not exceed 250ºC.
3 NRC FIRE-RESISTANCE PROJECTS
Since the early 1990s, NRC has conducted a number of projects to develop data on the resistance performance of generic wall and floor assemblies in a standard CAN/ULC-S101
fire-resistance test [
7
]. These projects include:1. Walls Phase 1. In the early 1990s, small-scale [9, 10, 11 and 12] and full-scale [13, 14 and 15] fire-resistance tests were conducted on lightweight frame wall assemblies protected with gypsum board. Parameters that were varied included the type, number of layers and thickness of the gypsum board, stud type (steel and wood), type of cavity insulation (glass, rock and cellulose fibre) and installation of resilient channels.
2. Walls Phase 2. In the second phase of the wall project, full-scale fire-resistance tests investigated the fire-resistance performance of loadbearing, steel-frame wall assemblies [16], and the impact of using shear panels, or bracing, in combination with gypsum board, on the fire-resistance performance of loadbearing, wood-frame wall assemblies [17 and 18]. The parameters that were varied included stud arrangement, stud type (steel and wood), number of layers and thickness of the gypsum board, type of cavity insulation (glass, rock and cellulose fibre), and installation of shear panels and resilient channels.
3. Floors Phase 1. Floors Phase 1 was conducted in the late 1990s. In this project, full-scale fire-resistance tests were conducted on lightweight frame floor assemblies protected with gypsum board. Parameters that were varied included the thickness and number of layers of gypsum board, joist type (solid wood joist, wood I-joist, wood truss and steel C-joist), type of cavity insulation (glass, rock and cellulose fibre), and
installation of resilient channels, among others [19].
4. Floors Phase 2. In 2001, a second project to investigate the fire-resistance performance of full-scale floor assemblies was initiated [20]. The parameters that were varied
included joist type, floor cavity insulation type, number and thickness of gypsum board layers on ceiling, and installation of resilient channels, among others.
5. CLT Wall and Floor Assemblies. Fire-resistance tests were more recently conducted on full-scale wall and floor assemblies using cross-laminated timber (CLT) structural elements [21]. Some of these assemblies were conducted with exposed CLT structural elements. However, one wall assembly and one floor assembly were tested with the
addition, two floor assemblies were tested with a single layer of 15.9 mm thick Type X gypsum board.
6. Mid-rise Wall Assemblies. Five full-scale lightweight wood-frame wall assemblies using a staggered-stud configuration were tested as part of the Wood and Wood-hybrid Mid-rise Buildings project [22]. All the assemblies used 2 layers of 12.7 mm thick gypsum board on both the exposed and the unexposed side of the assembly. The parameters varied included stud size, stud spacing, single- and multiple-stud configurations, and installation of shear panels and resilient channels.
In all the tests of lightweight wood-frame assemblies in those projects, temperatures were measured at the interface between the gypsum board and the studs or joists, and at the
interface between the gypsum board and the cavity space on the exposed side of the assembly (at the interface between the gypsum board and the cavity insulation, when cavity insulation was present). For the CLT assembly tests, the temperatures were measured at the interface between the gypsum board and the CLT. The test data from these interface locations were analyzed to determine the ‘encapsulation time’ provided by the materials used on the exposed side of the test assembly based on the three sets of temperature increase criteria discussed in the previous section.
For assemblies with two layers of encapsulation materials, the temperatures were also
measured at the interface between the two layers. For selected assemblies, this data was also analyzed to determine an encapsulation time for the first layer of encapsulation material based on the three sets of temperature increase criteria.
4 SMALL-SCALE WALL ASSEMBLIES
In the early 1990s, a series of small-scale wall assembly tests [9, 10, 11 and 12] were
conducted using a propane-fueled fire-brick-lined vertical furnace with an 810 mm by 810 mm opening. The furnace temperature was measured by two 20 gauge shielded thermocouples, located near the vertical centerline of the furnace and 300 mm from the exposed surface of the assembly. The average of these two temperatures was used to control the furnace temperature to follow the standard time-temperature curve provided in CAN/ULC-S101 [7].
4.1 Small-scale Assemblies and Thermocouple Locations – Walls Phase 1
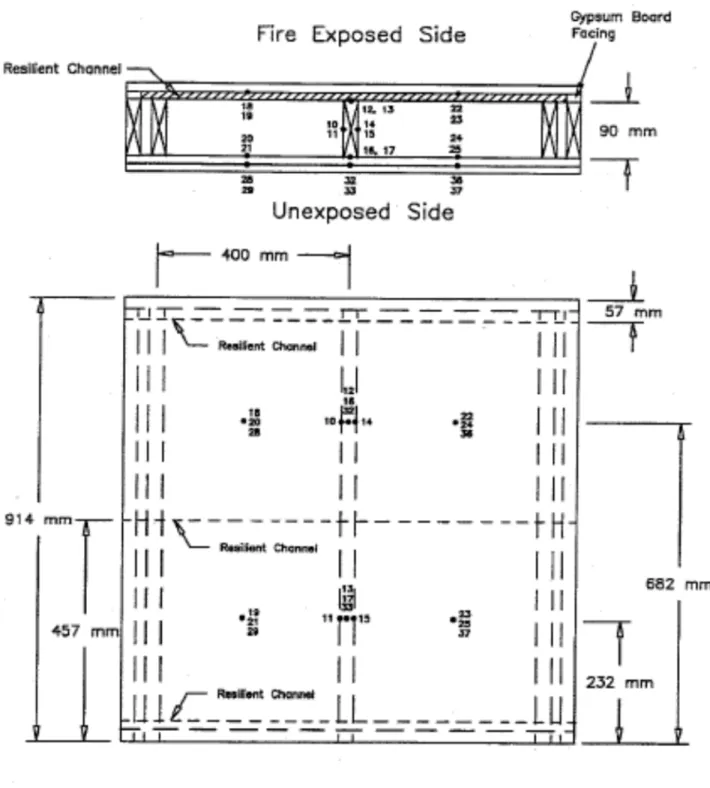
The test assemblies were 914 mm high by 914 mm wide with various depths depending on the number of layers of gypsum board. The parameters that were varied included the type of stud (steel and wood), type of insulation (no insulation, or glass fibre, rock fibre, dry blown and wet spray cellulose fibre insulations), type and thickness gypsum board (regular, 12.7 mm thick Type X and 15.9 mm thick Type X) and the number of layers of gypsum board on the exposed and unexposed sides of the assembly.
For the wood-frame wall assemblies, 38 mm by 89 mm studs were spaced at 400 mm O.C. (see Figure 1). To make up the required furnace width of 914 mm by 914 mm, an additional stud was added to each end. Top and bottom plates of 38 mm by 89 mm studs were then added to complete the frame assembly construction. The assemblies were not loaded during the test. For the steel-frame wall assemblies, the steel studs were spaced at 600 mm O.C. (see Figure 2). In order to complete the frame assembly, two end studs and top and bottom runners were added. The assemblies were not loaded during the test.
For the steel-frame test assemblies with resilient channels, three rows of channels were installed horizontally, across the width of the assembly, at 400 mm O.C. (see Figure 3). The channels were cut 39 mm shorter at both ends in order to avoid heat and flame transmission to the unexposed surface of the test assembly and the gaps were filled with strips of gypsum board screwed to the webs of the outside edge studs.
All the assemblies were instrumented with thermocouples located at various locations in the assembly. For this study, the thermocouples of interest are those located between the base layer of gypsum board on the exposed side of the assembly (the side facing the furnace) and the studs, and on the cavity side of the gypsum board base layer (at the interface between the gypsum board and the cavity insulation, when cavity insulation was present) on the exposed side.
For the wood-frame wall assemblies, two thermocouples were located on the center stud at 232 mm and 682 mm above the base of the assembly (Figure 1). Two thermocouples were also located on the base layer gypsum board in each cavity space formed by the wood studs. These thermocouples were 232 mm and 682 mm above the base of the assembly. For the wood-frame wall assemblies with resilient channels, the thermocouples at the gypsum board-stud interface were located on the stud (Figure 3).
For the steel-frame wall assemblies, two thermocouples were located on each steel stud 232 mm and 682 mm above the base of the assembly (Figure 2). Two thermocouples were located on the gypsum board at the mid-width of the assembly. These thermocouples were 232 mm and 682 mm above the base of the assembly. For the steel-frame wall assemblies with resilient channels, the thermocouples at the interface between the gypsum board and the stud were typically located on the unexposed side of the gypsum board.
4.2 Encapsulation Times Based on Temperature Increase Criteria – Small-scale Wall
Assemblies – Walls Phase 1
The data for each small-scale wall assembly test was analyzed to determine the times at which the temperature increases exceeded the three sets of temperature criteria: Criteria 1 – 140ºC average and 180 ºC single point; Criteria 2 – 195ºC average and 250 ºC single point; and Criteria 3 – 250ºC average and 270 ºC single point. The results of the analysis are grouped based on type, thickness and number of layers of gypsum board and the stud material (wood or steel) and test arrangement, as follows:
1. Table 1 provides results from small-scale tests with a single layer 12.7 mm thick Type X gypsum board on the exposed side of assemblies with steel studs.
2. Table 2 provides results from small-scale tests with two layers 12.7 mm thick Type X gypsum board on the exposed side of assemblies with steel studs.
3. Table 3 provides results for tests with a single layer of 15.9 mm thick Type X gypsum board on the exposed side of assemblies with steel studs.
4. Table 4provides results from small-scale tests with a single layer 12.7 mm thick Type X gypsum board on the exposed side of assemblies with wood studs.
5. Table 5 provides results for small-scale tests with 2 layers of 12.7 mm thick Type X gypsum board on the exposed side of assemblies with wood studs.
6. Table 6 provides results from small-scale tests with two layers 12.7 mm thick regular gypsum board on the exposed side of assemblies with steel studs and assemblies with
In addition to the data for the individual tests, the mean and standard deviation are provided for each temperature criterion. The mean and standard deviation results are shown in Figure 4, Figure 5 and Figure 6 for the three sets of temperature criteria.
Figure 7 and Figure 8 show the time differences between the Criteria 1 and 2 results and between the Criteria 1 and 3 results, respectively. These two time differences were selected to illustrate that the change in encapsulation times determined using the three criteria was small.
4.3 Results and Discussion – Small-scale Wall Assemblies – Walls Phase 1
Some general observations regarding the performance of a single layer of Type X gypsum board as an encapsulation material in the small-scale wall assembly tests are as follows:
1. The time to reach the selected criteria was consistent from test to test.
2. For the steel-frame wall assemblies, the time to reach the various criteria at the stud was comparable to that determined at the cavity space.
3. For the wood-frame wall assemblies, the time to reach the various criteria at the stud was longer than for the steel assemblies. Also, the times determined at the studs were slightly longer than those at the cavity.
4. The standard deviation for the results was higher for the wood-frame wall assemblies compared to that for the steel-frame wall assemblies. This is in part due to Test S-30 with cellulose fibre insulation (dry blown) and resilient channels, which had considerably longer times for the results at the stud than those for the other assemblies. One
possibility is that there was insulation in the space between the gypsum board and the thermocouple on the stud. The other tests with wood-frame assemblies with resilient channels on the exposed side had a much smaller increase in the time to reach the various criteria.
5. The increased time between the selected criteria’s results was small (< 2 min between Criteria 1 and Criteria 2 results, and < 4 min between Criteria 1 and Criteria 3 results). Some general observations regarding the performance of a double layer of Type X gypsum board as an encapsulation material in the small-scale wall assembly tests are as follows:
1. The time to reach the selected criteria was shorter at the stud than in the cavity for the steel-frame wall assemblies. In particular, the single point times at the stud were low at the stud compared with the average time and with the times for the cavity. This suggests there was localized heating near 1 or 2 thermocouples. For these assemblies, the screws fastening the face layer to the assembly did extend into the stud and were located near the thermocouples. One possibility is that heat conducted through the fasteners may have produced localized heating of the stud.
2. For the wood-frame wall assemblies, the time to reach the selected criteria was slightly longer at the stud than in the cavity space. Two of the three assemblies included resilient channels. The times were higher for these assemblies than for the assembly without resilient channels. (Note: The resilient channels were located at the bottom, mid-height and top of the assembly. The thermocouples were located on the studs at approximately ¼ and ¾ of the assembly heights.)
3. The increased times between the selected criteria’s results were higher than for the assemblies with a single layer of gypsum board. The increased time was considerably higher at the stud than at the cavity for the steel-frame wall assemblies, indicating that the phenomena producing the increased temperatures at the steel stud had more impact
at lower temperatures. The temperature increases between criteria were more consistent for the wood-frame wall assemblies.
Results are also provided for a series of tests conducted with 2 layers of regular gypsum board. The results are consistent for those assemblies with the same low density gypsum board. However, lower results were obtained for Test S-03 with a higher density gypsum board and higher results were obtained for Test S-49 with a second low density gypsum board.
Figure 1. Typical small-scale wall test assembly with wood studs and 2 layers of gypsum board.
Figure 2. Typical small-scale wall test assembly with steel studs and 2 layers of gypsum board.
Assembly Type 1x12.7 mm T-X SS 2x12.7 mm T-X SS 1x15.9 mm T-X SS 1x12.7 mm T-X WS 2x12.7 mm T-X WS 2x12.7 mm Reg SS&WS T im e (m in ) 0 10 20 30 40 50 60 70 Average Stud Single Point Stud Average Cavity Single Point Cavity
n x ##.# mm – Number of layers of gypsum board x Thickness of each layer of gypsum board
T-X Type X gypsum board Reg Regular gypsum board
SS Steel Stud WS Wood Stud SS&WS Both Steel Stud and Steel Stud
Figure 4. Small-scale wall assembly tests (Walls Phase 1) – times at which 140C average and 180ºC single point
Assembly Type 1x12.7 mm T-X SS 2x12.7 mm T-X SS 1x15.9 mm T-X SS 1x12.7 mm T-X WS 2x12.7 mm T-X WS 2x12.7 mm Reg SS&WS T im e (m in ) 0 10 20 30 40 50 60 70 Average Stud Single Point Stud Average Cavity Single Point Cavity
n x ##.# mm–Number of layers of gypsum board x Thickness of each layer of gypsum board T-X Type X gypsum board Regr Regular gypsum board
SS Steel Stud WS Wood Stud SS&WS Both Steel Stud and Steel Stud
Figure 5. Small-scale wall assembly tests (Walls Phase 1) – times at which 195C average and 250ºC single point
Assembly Type 1x12.7 mm T-X SS 2x12.7 mm T-X SS 1x15.9 mm T-X SS 1x12.7 mm T-X WS 2x12.7 mm T-X WS 2x12.7 mm Reg SS&WS T im e (m in ) 0 10 20 30 40 50 60 70 Average Stud Single Point Stud Average Cavity Single Point Cavity
n x ##.# mm – Number of layers of gypsum board x Thickness of each layer of gypsum board T-X Type X gypsum board Regular Regular gypsum board
SS Steel Stud WS Wood Stud SS&WS Both Steel Stud and Steel Stud
Figure 6. Small-scale wall assembly tests (Walls Phase 1) – times at which 250C average and 270C single point
Assembly Type 1x12.7 mm T-X SS 2x12.7 mm T-X SS 1x15.9 mm T-X SS 1x12.7 mm T-X WS 2x12.7 mm T-X WS 2x12.7 mm Reg SS&WS t ( m in ) 0 2 4 6 8 10 12 14 Average Stud Single Point Stud Average Cavity Single Point Cavity
n x ##.# mm–Number of layers of gypsum board x Thickness of each layer of gypsum board T-X Type X gypsum board Reg Regular gypsum board
SS Steel Stud WS Wood Stud SS&WS Both Steel Stud and Steel Stud
Assembly Type 1x12.7 mm T-X SS 2x12.7 mm T-X SS 1x15.9 mm T-X SS 1x12.7 mm T-X WS 2x12.7 mm T-X WS 2x12.7 mm Reg SS&WS t ( m in ) 0 2 4 6 8 10 12 14 16 Average Stud Single Point Stud Average Cavity Single Point Cavity
n x ##.# mm–Number of layers of gypsum board x Thickness of each layer of gypsum board T-X Type X gypsum board Regular Regular gypsum board
SS Steel Stud WS Wood Stud SS&WS Both Steel Stud and Steel Stud
Table 1. Times at which the temperature increases exceeded the three sets of temperature criteria: Small-scale wall assembly tests with 1 layer of 12.7 mm Type X gypsum board on exposed side of unloaded steel studs (gypsum board/stud and gypsum board/cavity interfaces).
Reference Test Other Parameters FEP Time Exceed T - Stud Time Exceed T - Cavity
(min) Average T (ºC) Single PointT (ºC) Average T (ºC) Single PointT (ºC)
140 195 250 180 250 270 140 195 250 180 250 270
(min) (min) (min) (min) (min) (min) (min) (min) (min) (min) (min) (min)
12 S-09 1x1, NI 46 15 16 18 15 17 17 15 16 18 15 17 20 12 S-14 1x1, RF 69 15 16 17 15 17 17 15 16 17 15 16 16 12 S-15 1x1, CI 69 15 17 18 16 17 18 17 18 20 17 18 18 12 S-22 1x1, GF 46 16 17 18 16 17 17 15 15 16 15 16 16 12 S-10 1x2, NI 86 15 17 18 15 17 18 15 17 18 16 18 19 12 S-18 1x2, CI 134 15 17 19 16 18 18 15 16 17 16 17 18 12 S-23 1x2, GF 93 16 17 18 16 17 17 15 16 16 15 16 16 12 S-26 1x2, RF 114 15 17 18 16 17 18 15 16 17 15 16 16 10 S-39 1x2, NI 89 15 16 18 15 17 18 15 16 18 15 17 18 12 S-46 1x2, CF 95 15 17 19 15 18 18 16 17 18 16 17 18 12 S-47 1x2, CF* 108 15 17 19 16 18 19 15 16 17 16 17 17 Mean 15.2 16.7 18.2 15.5 17.3 17.7 15.3 16.3 17.5 15.5 16.8 17.5 Standard Deviation 0.4 0.5 0.6 0.5 0.5 0.6 0.6 0.8 1.1 0.7 0.8 1.4
FEP – Fire-endurance period
nxn – Number of layers of gypsum board on exposed side x Number of layers of gypsum board on unexposed side
NI – No Insulation GF – Glass Fibre Insulation RF – Rock Fibre Insulation CI – Cellulose Fibre Insulation (dry blown)
Table 2. Times at which the temperature increases exceeded the three sets of temperature criteria: Small-scale wall
assembly tests with 2 layers of 12.7 mm Type X gypsum board on exposed side of unloaded steel studs (gypsum board base layer/stud and base layer/cavity interfaces).
Reference Test Other Parameters FEP Time Exceed T - Stud Time Exceed T - Cavity
(min) Average T (ºC) Single PointT (ºC) Average T (ºC) Single PointT (ºC)
140 195 250 180 250 270 140 195 250 180 250 270
(min) (min) (min) (min) (min) (min) (min) (min) (min) (min) (min) (min)
10 S-11 2x1, NI 86 32 40 45 28 36 38 41 45 51 43 48 52 10 S-12 2x2, NI 129 31 39 43 25 32 34 42 47 55 43 48 51 12 S-21 2x2, CI 157 32 37 43 26 35 36 42 43 46 44 46 47 12 S-25 2x2, GF 139 30 37 38 27 35 36 36 40 43 39 42 43 12 S-27 2x2, RF 160 29 38 43 28 35 36 38 40 42 39 41 42 Mean 30.8 38.2 42.4 26.8 34.6 36.0 39.8 43.0 47.4 41.6 45.0 47.0 Standard Deviation 1.3 1.3 2.6 1.3 1.5 1.4 2.7 3.1 5.5 2.4 3.3 4.5 FRR – Fire-endurance period
nxn – Number of layers of gypsum board on exposed side x Number of layers of gypsum board on unexposed side
Table 3. Times at which the temperature increases exceeded the three sets of temperature criteria: Small-scale wall assembly tests with 1 layer of 15.9 mm Type X gypsum board on exposed side of unloaded steel studs (gypsum board/stud and gypsum board/cavity interfaces).
Reference Test Other Parameters FEP Time Exceed T - Stud Time Exceed T - Cavity
(min) Average T (ºC) Single PointT (ºC) Average T (ºC) Single PointT (ºC)
140 195 250 180 250 270 140 195 250 180 250 270
(min) (min) (min) (min) (min) (min) (min) (min) (min) (min) (min) (min)
12 S-41 1x2, NI 136 20 22 24 20 22 23 21 22 24 21 23 24 12 S-42 1x2, RF 135 20 22 24 19 22 22 20 21 21 20 21 22 12 S-43 1x2, CI 113 20 22 24 21 23 24 21 22 24 22 23 24 12 S-44 1x2, GF 133 20 21 23 20 22 23 20 21 22 21 22 22 Mean 20.0 21.8 23.8 20.0 22.3 23.0 20.5 21.5 22.8 21.0 22.3 23.0 Standard Deviation 0.0 0.5 0.5 0.8 0.5 0.8 0.6 0.6 1.5 0.8 1.0 1.2
FEP – Fire-endurance period
nxn – Number of layers of gypsum board on exposed side x Number of layers of gypsum board on unexposed side
Table 4. Times at which the temperature increases exceeded the three sets of temperature criteria: Small-scale wall assembly tests with 1 layer of 12.7 mm Type X gypsum board on exposed side of unloaded wood studs (gypsum board/stud and gypsum board/cavity interfaces).
Reference Test Other Parameters FEP Time Exceed T - Stud Time Exceed T - Cavity
(min) Average T (ºC) Single PointT (ºC) Average T (ºC) Single PointT (ºC)
140 195 250 180 250 270 140 195 250 180 250 270
(min) (min) (min) (min) (min) (min) (min) (min) (min) (min) (min) (min)
9 S-05 1x1, NI, RE 98 15 17 18 16 17 17 15 17 21 15 17 18 9 S-06 1x1, NI, RU 102 16 17 18 16 18 19 15 17 19 15 16 17 9 S-07 1x1, NI, RE, RU 88 15 17 18 15 17 18 15 17 19 15 17 18 9 S-081 1x1, NI 74 16 18 21 16 19 20 15 16 19 15 17 17 9 S-352 1x1, NI 82 15 16 18 16 17 18 15 17 19 16 18 19 12 S-28 1x2, GF, RE 92 17 18 20 18 20 20 14 15 16 14 15 15 12 S-29 1x2, RF, RE 125 17 18 20 17 19 19 15 16 16 15 16 16 12 S-30 1x2, CI, RE 164 25 30 37 23 26 27 16 17 18 16 17 18 12 S-31 1x2, NI, RE 96 18 21 25 20 24 26 16 18 21 17 20 21 10 S-40 1x2, NI 86 16 18 19 17 19 20 15 16 18 15 17 18 Mean 17.0 19.0 21.4 17.4 19.6 20.4 15.1 16.6 18.6 15.3 17.0 17.7 Standard Deviation 3.0 4.1 5.9 2.4 3.1 3.4 0.6 0.8 1.7 0.8 1.3 1.6
FEP – Fire-endurance period
nxn – Number of layers of gypsum board on exposed side x Number of layers of gypsum board on unexposed side
NI – No Insulation GF – Glass Fibre Insulation RF – Rock Fibre Insulation CI – Cellulose Fibre Insulation (dry blown)
RE – Resilient channels on exposed side RU – Resilient channels on unexposed side
1Vertical gypsum board joint
Table 5. Times at which the temperature increases exceeded the three sets of temperature criteria: Small-scale wall assembly tests with 2 layers of 12.7 mm Type X gypsum board on unloaded wood studs (gypsum board base layer/stud and base layer/cavity interfaces).
Reference Test Other Parameters FEP Time Exceed T - Stud Time Exceed T - Cavity
(min) Average T (ºC) Single PointT (ºC) Average T (ºC) Single PointT (ºC)
140 195 250 180 250 270 140 195 250 180 250 270
(min) (min) (min) (min) (min) (min) (min) (min) (min) (min) (min) (min)
9 S-36 2x2, NI 104 40 44 48 42 48 49 42 47 55 43 50 54
9 S-37 2x2, NI, RE 87 47 54 63 49 58 62 38 43 50 40 47 50
9 S-38 2x2, NI, RE, RU 146 47 54 63 49 58 62 42 48 59 44 53 58
Mean 44.7 50.7 58.0 46.7 54.7 57.7 40.7 46.0 54.7 42.3 50.0 54.0
Standard Deviation 4.0 5.8 8.7 4.0 5.8 7.5 2.3 2.6 4.5 2.1 3.0 4.0
FEP – Fire-endurance period
nxn – Number of layers of gypsum board on exposed side x Number of layers of gypsum board on unexposed side
NI – No Insulation RE – Resilient channels on exposed side RU – Resilient channels on unexposed side
1Vertical gypsum board joint
Table 6. Times at which the temperature increases exceeded the three sets of temperature criteria: Small-scale unloaded wall assembly tests with 2 layers of 12.7 mm regular gypsum board on the exposed side (gypsum board base layer/stud and base layer/cavity interfaces).
Reference Test Other Parameters FEP Time Exceed T - Stud Time Exceed T - Cavity
(min) Average T (ºC) Single PointT (ºC) Average T (ºC) Single PointT (ºC)
140 195 250 180 250 270 140 195 250 180 250 270
(min) (min) (min) (min) (min) (min) (min) (min) (min) (min) (min) (min)
11 S-01 2x2, SS, RL, NI 82 33 38 42 33 36 38 37 38 41 38 40 41 11 S-02 2x2, WS, RL, NI 88 31 35 41 28 30 30 36 37 39 35 37 38 11 S-32 2x2, SS, RL, GF 74 31 35 37 32 33 34 30 32 34 32 34 34 11 S-33 2x2, SS, RL, RF 98 30 34 38 28 32 33 33 35 37 34 36 37 11 S-34 2x2, SS, RL, CI 102 35 38 41 33 37 38 35 37 39 36 38 38 11 S-03 2x2, SS, RH, NI 104 25 28 32 25 29 30 31 33 36 32 36 37 11 S-49 2x2, WS, RL*, NI 87 38 40 41 39 40 41 35 38 42 36 39 41 Mean 31.9 35.4 38.9 31.1 33.9 34.9 33.9 35.7 38.3 34.7 37.1 38.0 Standard Deviation 4.1 3.9 3.5 4.6 4.0 4.3 2.6 2.4 2.8 2.2 2.0 2.4
FEP – Fire-endurance period
nxn – Number of layers of gypsum board on exposed side x Number of layers of gypsum board on unexposed side
NI – No Insulation GF – Glass Fibre Insulation RF – Rock Fibre Insulation CI – Cellulose Fibre Insulation (dry blown)
RL – Low density regular gypsum board with glass fibre (7.35 kg/m2)
RL* – Low density regular gypsum board with no glass fibre (7.27 kg/m2)
5 FULL-SCALE WALL ASSEMBLIES
Since the early 1990s, four projects were conducted in which the fire-resistance performance of full-scale assemblies were evaluated. The projects were:
1. Walls Phase 1. In the early 1990s, full-scale [13, 14 and 15] fire-resistance tests were conducted on lightweight frame wall assemblies protected with gypsum board.
Parameters that were varied included the type, number of layers and thickness of the gypsum board, stud type (steel and wood), type of cavity insulation (glass, rock and cellulose fibre) and installation of resilient channels.
2. Walls Phase 2. In the second phase of the wall project, full-scale fire-resistance tests investigated the fire-resistance performance of loadbearing steel-frame wall assemblies [16], and the impact of using shear panels, or bracing, in combination with gypsum board, on the fire-resistance performance of loadbearing wood-frame wall assemblies [17 and 18]. The parameters that were varied included stud arrangement, stud type (steel and wood), number of layers and thickness of the gypsum board, type of cavity insulation (glass, rock and cellulose fibre), and installation of shear panels and resilient channels.
3. CLT Wall. Fire-resistance tests were more recently conducted on full-scale wall
assemblies using cross-laminated timber (CLT) structural elements [21]. Some of these assemblies were conducted with exposed CLT structural elements. However, one wall assembly was tested with the structural CLT element protected by 2 layers of 12.7 mm thick Type X gypsum board.
4. Mid-rise Wall Assemblies. Five full-scale lightweight wood-frame wall assemblies using a staggered-stud configuration were tested as part of the Wood and Wood-hybrid Mid-rise Buildings project [22]. All the assemblies used 2 layers of 12.7 mm thick gypsum board on both the exposed and the unexposed side of the assembly. The parameters that were varied included stud spacing, single- and multiple-stud configurations, and installation of shear panels and resilient channels.
The full-scale tests for wall assemblies were conducted using a full-scale propane-fueled fire-brick-lined vertical furnace covered with 25.4 mm thick ceramic fibre insulation. The furnace temperature was measured by nine 20 gauge shielded thermocouples, located 300 mm from the exposed surface of the test assembly. The average of these nine temperatures was used to control the furnace temperature to follow the standard time-temperature curve provided in CAN/ULC-S101 [7].
5.1 Walls Phase 1
In the early 1990s, a series of full-scale tests for wall assemblies [13, 14 and 15] were
conducted in Walls Phase 1. Parameters that were varied included the type, number of layers and thickness of the gypsum board, stud type (steel and wood), type of cavity insulation (glass, rock and cellulose fibre), and installation of resilient channels.
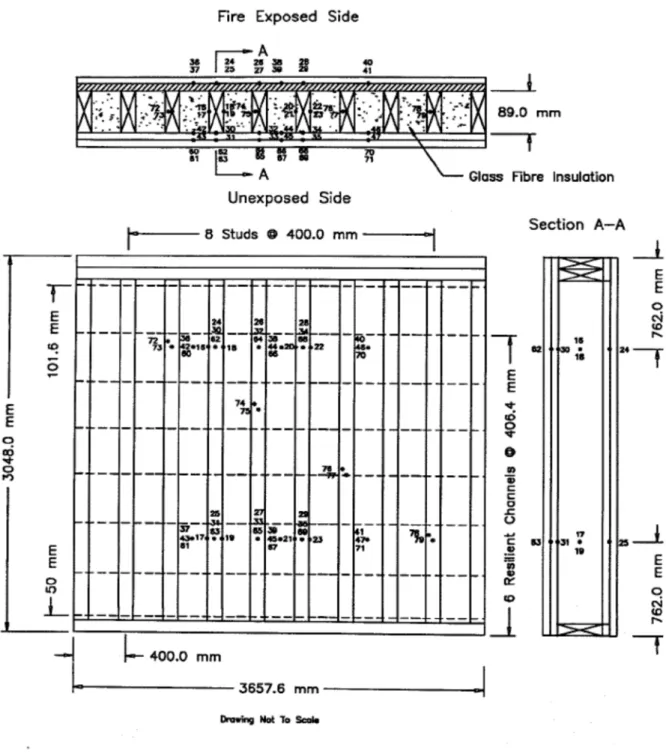
5.1.1 Full-scale Wall Assemblies and Thermocouple Locations – Walls Phase 1
The test assemblies were 3048 mm high by 3658 mm wide with various depths depending on the number of layers of gypsum board. The parameters that were varied included the type of stud (steel and wood), type of insulation (no insulation, glass fibre, rock fibre, dry blown and wet
sprayed cellulose fibre insulations), type and thickness gypsum board (12.7 mm thick regular, 12.7 mm thick Type X and 15.9 mm thick Type X) and the number of layers of gypsum board on the exposed and unexposed sides of the assembly. Resilient channels were also installed on either the exposed or unexposed side of some of the wood-frame wall assemblies.
For the wood-frame wall assemblies, 38 mm by 89 mm studs were spaced at 400 mm O.C. (see Figure 9). The wood-frame wall assemblies were loaded during the test. For the steel-frame wall assemblies, the steel studs were spaced at 600 mm O.C. (see Figure 10). All the steel-frame wall assemblies were not loaded during the test.
In asymmetrical wall assemblies (referred to as “1x2”), the exposed side had one gypsum board layer and the unexposed side had two gypsum board layers: base and face layers. All the steel-frame wall assembly tests with Type X gypsum board were asymmetrical and had 1 layer of 12.7 mm thick Type X gypsum board on the exposed side and 2 layers of 12.7 mm thick Type X gypsum board on the unexposed side. A detailed description of the steel frame wall assemblies is provided in Reference 13.
In “double layer” wood-frame wall assemblies, both the exposed and unexposed sides had two gypsum board layers: base and face layers. When used, the resilient channels were attached to either the exposed or unexposed side of the wood studs and the gypsum board was attached to the resilient channels. Eight rows of channels were installed horizontally, perpendicular to the studs at 400 mm O.C. (see Figure 9). A detailed description of the the wood frame assemblies is provided in Reference 14.
All the assemblies were instrumented with thermocouples located at various locations in the assembly. For this study, the thermocouples of interest are those located between the base layer of gypsum board on the exposed side of the assembly and the stud, and on the cavity side of the base layer of gypsum board on the exposed side.
For the wood-frame wall assemblies, six thermocouples (TCs) were located at studs (TCs 24-29 in Figure 9). Three thermocouples were located 762 mm above the base of the assembly and 3 thermocouples were located 762 mm below the top of the assembly. For the tests with resilient channels, these thermocouples were located on the unexposed side of the gypsum board. For the tests without resilient channels, the thermocouples were located between the gypsum board and the wood stud. Six thermocouples were also located at the gypsum board/cavity interface (TCs 36-41 in Figure 9) with three thermocouples located 762 mm above the base of the assembly and three thermocouples located 762 mm below the top of the assembly.
For the steel-frame wall assemblies, four thermocouples were located on steel studs (TCs 18, 19, 24 and 25 in Figure 10). Two thermocouples were located 762 mm above the base and 2 thermocouples were located 762 mm below the top of the assembly. Six thermocouples were located on the gypsum board (TCs 28, 29, 32, 33, 36, and 37 in Figure 10) at the mid-width of 3 cavity spaces formed by the steel studs. These thermocouples were located 762 mm above the base and 762 mm below the top of the assembly.
A detailed description of the assemblies with 12.7 mm thick regular gypsum board is provided in Reference 13. The thermocouple locations were similar to those used in the tests with Type X gypsum board. However, in some tests, additional thermocouples were added between the gypsum board and the stud and on the cavity side of the gypsum board. These thermocouples were located at the mid-height of the assembly.
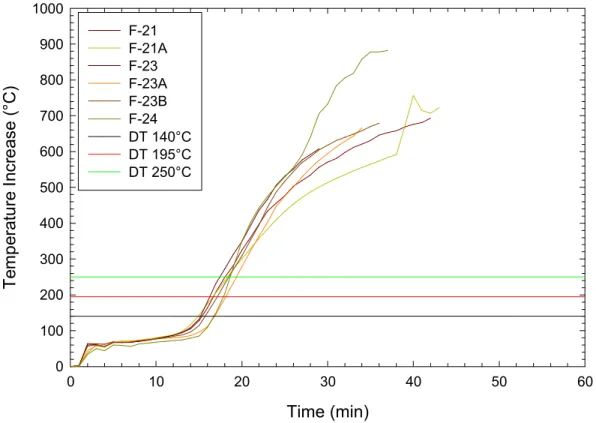
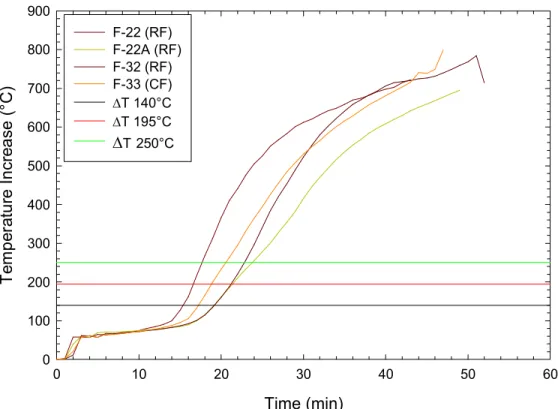
5.1.2 Average Temperature Increase Profiles – Full-scale Wall Assemblies – Walls Phase 1 The average temperature increases measured between the gypsum board and the stud and at the interface between the gypsum board and the wall cavity was determined. The average temperature increase profiles at the two locations were grouped based on type of gypsum board and the type of stud (wood and steel), as follows:
1. For full-scale tests of wall assemblies with Type X gypsum board and wood studs, the average temperature increases measured between the gypsum board and the stud, and between the gypsum board and the cavity, are shown in Figure 11 and Figure 12, respectively.
2. For full-scale tests of wall assemblies with one layer of 12.7 mm thick Type X gypsum board on the exposed side and steel studs, the average temperature increases
measured between the gypsum board and the stud and between the gypsum board and the cavity are shown in Figure 13 and Figure 14, respectively.
3. For full-scale tests of wall assemblies with 12.7 mm thick regular gypsum board, the average temperature increases measured between the gypsum board and the stud and between the gypsum board and the cavity are shown in Figure 15 and Figure 16, respectively.
The temperature profiles measured on the unexposed side of the base layer of gypsum board show a similar trend of 4 distinct phases. In Phase 1 (< 3 min), there was a rapid temperature increase to 60 – 80ºC. This was followed by a second phase with a slow temperature increase to approximately 100ºC during the calcination of the gypsum board and the vaporization of the bonded water in the gypsum board. The duration of Phase 2 depended on the thickness and the number of layers of gypsum board. Subsequently, there was a more rapid increase in
temperature to > 600ºC during Phase 3, after which the temperatures remained steady or slowly increased (Phase 4). Similar temperature profiles were found for the tests with encapsulation materials conducted using the cone calorimeter [3] and the intermediate-scale furnace [4]. Some general observations based on the average temperature increase profiles are as follows:
1. Full-scale wood-frame wall assemblies with Type X gypsum board:
a. For the tests of with a single layer of gypsum board on the exposed side, the temperature profiles were comparable at the gypsum board/stud location for temperature increases up to 300ºC for the assemblies with glass and rock fibre insulation (Figure 11). The average temperature increase profile was different for the test with cellulose fibre insulation, with a faster temperature increase during Phase 2 than for the other 2 assemblies. This assembly had the resilient
channels located on the unexposed side of the assembly with the thermocouples located between the gypsum board and the stud. The other two assemblies had the resilient channels on the exposed side and the thermocouples were attached to the gypsum board. The latter arrangement would allow for some temperature loss to the cavity.
b. There was some variation in the temperature increase profiles measured at the gypsum board/cavity interface during Phase 2 and Phase 3, depending on the insulation used in the cavity (Figure 12). The slowest temperature increase was for the assembly with rock fibre insulation and the fastest for the assembly with glass fibre insulation.
c. The two assemblies with a single layer of 15.9 mm thick Type X gypsum board on the exposed side were the same and the temperature increase profiles were comparable for the two tests for temperature increases < 300ºC.
d. The time at which the transition between Phase 2 and Phase 3 occurred
depended on the thickness and number of layers of gypsum board. The transition occurred between 12 and 14 min for the 12.7 mm thick gypsum, between 18 and 20 min for the 15.9 mm thick gypsum board and between 38 and 40 min for the double layer of 12.7 mm gypsum board. There was some variation depending on the type of insulation used in the cavity. However with the limited number of tests, it is impossible to determine a pattern.
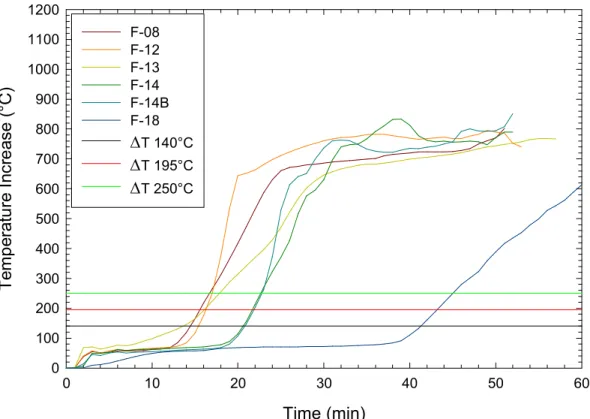
2. Full-scale steel-frame wall assemblies with Type X gypsum board:
a. All the tests had a single layer of 12.7 mm thick Type X gypsum board on the exposed side of the assembly. The insulation used in the cavity was varied (no insulation, glass fibre, rock fibre and wet sprayed cellulose fibre). The average temperature increase profiles at both the gypsum board/stud interface and the gypsum board/cavity were comparable for all except the assembly with wet sprayed cellulose fibre insulation. For this assembly, there was a delay in the temperature increase reaching Phase 3 particularly for the temperature increase measured at the stud. The reason for this delay is not known.
b. For the three assemblies other than the one with wet sprayed cellulose fibre insulation (Test F-11), the transition between Phase 2 and Phase 3 occurred between 10 and 12 min. This is comparable to but slightly earlier than with the wood studs.
3. Full-scale wood- and steel-frame wall assemblies with regular gypsum board:
a. There were two assemblies tested with a single layer of regular gypsum board on the exposed side of the assembly. There was a small difference in the
temperature increase profile for the two assemblies at the gypsum board/stud interface after the transition to Phase 3 (Figure 15 and Figure 16). The assembly with the slower temperature increase had a higher density gypsum board
installed. The temperature profiles at the gypsum board/cavity interface were comparable for temperatures < 300ºC. The transition between Phase 2 and Phase 3 occurred between 10 and 12 min. This is comparable to the results for the assemblies with a single layer of 12.7 mm Type X gypsum board.
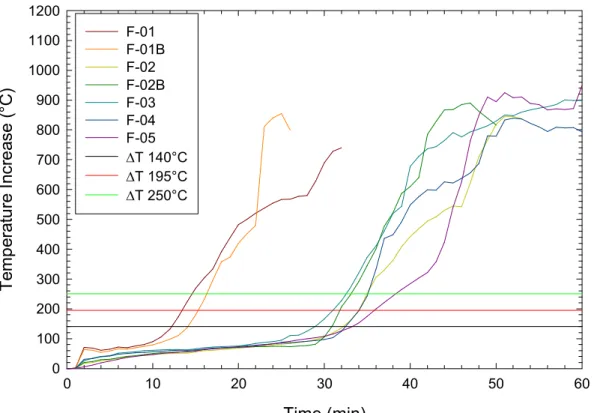
b. Five tests were conducted for assemblies with two layers of regular gypsum board on the exposed side. The density and composition of the gypsum board was varied as well as the type of stud. The temperature increase profiles were comparable up to 25 min. Test F-03 with steel studs had an earlier transition to Phase 3 than for the 3 assemblies with the same gypsum board and wood studs. Test F-05 had a denser gypsum board and had the slowest temperature increase of the five assemblies. The gypsum board used in Test F-05 did not have any fibre in the gypsum core, whereas the gypsum board used for the four other assemblies included glass fibres. With the limited number of tests, it is not possible to determine whether the gypsum board density or its composition resulted in the differences in the temperature increase profiles. The transition between Phase 2 and Phase 3 occurred between 26 and 34 min.