Publisher’s version / Version de l'éditeur:
Journal of the Acoustical Society of America, 125, 5, pp. 3038-3051, 2009-01-01
READ THESE TERMS AND CONDITIONS CAREFULLY BEFORE USING THIS WEBSITE. https://nrc-publications.canada.ca/eng/copyright
Vous avez des questions? Nous pouvons vous aider. Pour communiquer directement avec un auteur, consultez la première page de la revue dans laquelle son article a été publié afin de trouver ses coordonnées. Si vous n’arrivez pas à les repérer, communiquez avec nous à [email protected].
Questions? Contact the NRC Publications Archive team at
[email protected]. If you wish to email the authors directly, please see the first page of the publication for their contact information.
NRC Publications Archive
Archives des publications du CNRC
This publication could be one of several versions: author’s original, accepted manuscript or the publisher’s version. / La version de cette publication peut être l’une des suivantes : la version prépublication de l’auteur, la version acceptée du manuscrit ou la version de l’éditeur.
For the publisher’s version, please access the DOI link below./ Pour consulter la version de l’éditeur, utilisez le lien DOI ci-dessous.
https://doi.org/10.1121/1.3097771
Access and use of this website and the material on it are subject to the Terms and Conditions set forth at
Some spatial and temporal effects on the speech privacy of meeting
rooms
Bradley, J. S.; Apfel, M.; Gover, B. N.
https://publications-cnrc.canada.ca/fra/droits
L’accès à ce site Web et l’utilisation de son contenu sont assujettis aux conditions présentées dans le site LISEZ CES CONDITIONS ATTENTIVEMENT AVANT D’UTILISER CE SITE WEB.
NRC Publications Record / Notice d'Archives des publications de CNRC:
https://nrc-publications.canada.ca/eng/view/object/?id=7357e19c-02f9-4f0d-8c7d-62f4dd51bcf4 https://publications-cnrc.canada.ca/fra/voir/objet/?id=7357e19c-02f9-4f0d-8c7d-62f4dd51bcf4
http://www.nrc-cnrc.gc.ca/irc
Som e spa t ia l a nd t e m pora l e ffe c t s on t he spe e c h priva c y of m e e t ing
room s
N R C C - 5 3 5 5 9
B r a d l e y , J . S . ; A p f e l , M . ; G o v e r , B . N .
A u g u s t 2 0 1 0
A version of this document is published in / Une version de ce document se trouve dans:
Journal of the Acoustical Society of America, 125, (5), pp. 3038-3051, January
01, 2009, DOI:
10.1121/1.3097771The material in this document is covered by the provisions of the Copyright Act, by Canadian laws, policies, regulations and international agreements. Such provisions serve to identify the information source and, in specific instances, to prohibit reproduction of materials without written permission. For more information visit http://laws.justice.gc.ca/en/showtdm/cs/C-42
Les renseignements dans ce document sont protégés par la Loi sur le droit d'auteur, par les lois, les politiques et les règlements du Canada et des accords internationaux. Ces dispositions permettent d'identifier la source de l'information et, dans certains cas, d'interdire la copie de documents sans permission écrite. Pour obtenir de plus amples renseignements : http://lois.justice.gc.ca/fr/showtdm/cs/C-42
Some spatial and temporal effects on the speech privacy of
meeting rooms
John S. Bradley,a兲 Marina Apfel, and Bradford N. Gover
National Research Council, 1200 Montreal Road, Ottawa K1A 0R6, Canada
共Received 16 December 2008; revised 19 February 2009; accepted 19 February 2009兲
This paper reports on initial experiments concerning how key spatial and temporal effects in rooms influence the speech privacy provided by enclosed rooms. The first part of the work demonstrates that for the same signal-to-noise ratio, the intelligibility of speech and the threshold of intelligibility are significantly different for transmission between real rooms than in the previous results in approximately free-field conditions 关B. N. Gover and J. S. Bradley, J. Acoust. Soc. Am. 116, 3480–3490 共2004兲兴. The second part investigates the influence of aspects of the spatial and temporal components of sound fields in typical rooms, to explain these differences for transmission between real rooms. These components included the separate effects of early-arriving and later-arriving reflected speech sounds. They also included the effects of spatially separated speech and noise sources as well as more diffuse noise representative of typical meeting rooms. In realistic combinations these effects are of practical importance and can change privacy criteria by 5 dB or more. Ignoring them could lead to costly over-design of the sound insulation required to achieve adequate speech privacy. 关DOI: 10.1121/1.3097771兴
PACS number共s兲: 43.55.Hy 关NX兴 Pages: 3038–3051
I. INTRODUCTION
Most previous work has assumed that speech privacy is only influenced by the signal-to-noise ratio of the speech and the concurrent ambient noise. The primary importance of signal-to-noise ratios 共SNRs兲, as determinants of speech pri-vacy, was established by the pioneering work of Cavanaugh
et al.1 on speech privacy of enclosed offices, which related privacy ratings to articulation index values. A more recent study2found a uniformly weighted signal-to-noise ratio mea-sure 共SNRuni32兲 to be a good predictor of ratings of both the
audibility and intelligibility of speech sounds from an adja-cent room. Although it is well known that the intelligibility of speech can be reduced by reverberation3and increased by the spatial separation of speech and noise sources,4 these effects have not previously been considered in studies of the speech privacy of enclosed rooms.
This new work is an initial investigation of the key spa-tial and temporal effects in rooms on the audibility and in-telligibility of speech in noise for conditions representative of typical rooms where speech privacy is required. The new work includes two studies. The first more exploratory study 共Sec. III兲 demonstrates that the intelligibility of speech and the threshold of intelligibility are significantly different for propagation between real rooms than in the previous results for simulated conditions in approximately free-field conditions.2 The second part of the work 共Sec. IV兲 investi-gates the magnitude of the effects of each aspect of the spa-tial and temporal components of sound fields in typical rooms. These included the separate effects of early-arriving and later-arriving reflected sounds. They also included the
effects of spatially separated speech and noise sources as well as more diffuse noise representative of typical meeting rooms.
There have been many previous studies related to under-standing the temporal and spatial effects of room acoustics on our ability to understand speech heard in combination with competing sounds. It is often considered that reduced speech intelligibility corresponds to increased speech pri-vacy, but in some situations higher degrees of privacy might require speech to be inaudible. Classical room acoustics studies have long identified optimum reverberation times for maximizing the intelligibility of speech.3Earlier work to ex-plain spatial effects was concerned with exex-plaining our abil-ity to understand speech in the presence of other interfering speech sounds, the so-called cocktail party effect.5 There have been at least two reviews of the many studies related to the cocktail party effect.6,7
Interfering sounds can mask the target speech sounds 共that we wish to hear兲 and reduce the intelligibility of the speech. The intelligibility of speech is first a SNR issue and the work of French and Steinberg,8which led to the articu-lation index, can explain the monaural signal-to-noise effects on speech intelligibility. Masking is influenced by both mon-aural and binmon-aural effects. Even for monmon-aural listening, head shadow effects can influence the intelligibility of speech as a function of the relative directions of the target speech and interfering sounds.
It is usually possible to better understand the target speech mixed with interfering sounds by listening binaurally. The benefit of listening binaurally rather than monaurally is referred to as a binaural advantage. Many studies have tried to explain the cause of binaural advantages and have shown interaural level, time, and phase differences to be important.9 These interaural differences vary with the direction of the sound source relative to the head of the listener and hence a兲
Author to whom correspondence should be addressed. Electronic mail: [email protected]
can help us to discriminate among spatially separated sound sources.
Although many of the earlier studies focused on the ef-fect of interfering speech sounds on the target speech, inter-fering noises can lead to larger reductions in intelligibility. For example, with a single interfering talker, it is possible for listeners to hear the target speech in the gaps of the interfer-ing speech. This is not possible with more or less constant noises such as ventilation type noise common in buildings. When the interfering speech is made up of a number of talk-ers, the masking effect of the speech tends to be similar to that of noise with a similar spectrum and level.10
The masking effect of an interfering sound is greatly influenced by the direction of arrival of the masking sound relative to that of the target speech. Experiments in free-field conditions have shown that separating the target speech and masking sound by as little as 10° is detectable, and that a 20° difference leads to quite significant increases in the intelligi-bility of the target speech.4Systematic studies have reported the resulting increased intelligibility as a function of the angle of separating the speech and noise sources.6,11 This reduction in the masking effect of the interfering noise by spatially separating the noise and the speech sources is re-ferred to as a spatial release from masking.
Studies of spatial effects have mostly been conducted in free-field conditions and have not often included the effects of reverberation. Where reverberation has been included, it has been shown to reduce the magnitude of the spatial re-lease from masking,12 indicating that in typical rooms with reverberant sound, listeners are less able to benefit from a spatial release from masking when the target speech source and the interfering sound source are spatially separated. Plomp13 systematically investigated the combined effects of varied reverberation time with varied separation of the speech and interfering noise sources. Although based on sub-jective ratings of the intelligibility rather than on intelligibil-ity test scores, the study showed a gradual decrease in the spatial release from masking as reverberation time was in-creased.
Most of the studies to date have focused on understand-ing individual parts of the overall issue of spatial and tem-poral effects of room acoustics and have most often been carried out in free-field conditions. Only a few studies have included the effects of room reverberation and usually the term reverberation has been used loosely to include all types of reflected sound. Most often the interfering signal has been speech14,15 and not typical room noises such as that from ventilation systems.
II. COMMON EXPERIMENTAL PROCEDURES FOR EXPERIMENTS
This paper describes two different studies to investigate the effects of room acoustics on the speech privacy of meet-ing rooms. The first investigation was intended to explore how closely the results of previous tests in approximately free-field conditions2 could be replicated in more realistic acoustical conditions. In these validation tests subjects lis-tened to speech transmitted through real walls from an adja-cent room. The second series of tests was carried out in
simulated sound fields to determine the effects of various details of the spatial and temporal characteristics of speech and noise sounds on the intelligibility of speech for speech privacy situations. Although the experimental setups and goals of each investigation were different, many aspects of the experimental procedure were the same.
Experimental conditions were characterized in terms of uniformly weighted 共over speech frequencies兲 SNRs as de-fined by the following:
SNRuni32=
1 16f=160
兺
5000
兵Ls共f兲 − Ln共f兲其−32 共dB兲, 共1兲
where Ls共f兲 and Ln共f兲 are the 1 / 3-octave band speech and
noise levels at the listener’s position. The −32 indicates that differences in the brackets are clipped so that they can never be less than −32 dB. SNRuni32 values were previously
shown2to be the most successful compromise for predicting subjective judgments of both the audibility and the intelligi-bility of speech when rating the speech privacy of meeting rooms.
Conditions were subjectively evaluated using speech tests to determine the audibility and intelligibility of speech for each test condition following procedures similar to those in the initial study.2 Recordings of the Harvard sentences16 were used as the speech test material. They were high quality digital recordings spoken by a male talker in an anechoic room. The Harvard sentences are phonetically balanced and of low predictability, which is necessary for conditions of low intelligibility for which guessing could distort the scores in some other types of speech intelligibility tests.
The test protocol consisted of first turning on the noise signal and then a few seconds later playing one sentence. After the noise had stopped, the subject could tell the experi-menter what they had heard, using a microphone to commu-nicate with the researcher who was outside the test room. The subjects first did a practice test consisting of ten sen-tences that included SNRuni32 values distributed over the
complete range included in the full test.
Because in some cases no screening of subjects for ing sensitivity was possible, some may have had some hear-ing loss. In addition, others may not have had English as their first language. Therefore, the data analyses are based on the results of the listeners with the ten highest intelligibility scores over all conditions of the test. Using only the best ten listeners was expected to exclude listeners with less sensitive hearing or others who may have not been sufficiently fluent in English.
Subjects were all adults and were employees of the Na-tional Research Council who volunteered to participate after being contacted by electronic mail. They did not receive any compensation for their participation. The tests were approved by the Ethics Review Board of the National Research Coun-cil 共Protocol No. 2006-06兲 and each subject signed a consent form after all of the details of the experiment were explained to them.
III. TWO-ROOM VALIDATION TEST A. Procedure
The initial tests2 had included a wide range of speech and noise levels but were carried out in approximately free-field conditions with spatially separated speech and noise sources. The test subjects listened to speech sounds, modified to represent transmission through one of several walls, from a loudspeaker system in front of them. At the same time they heard ambient noises from a second loudspeaker system lo-cated above them. These conditions were intended to repre-sent a worst-case condition 共i.e., minimum speech privacy兲 in which it would be most easy to understand speech. The new two-room validation tests17 were intended to explore how the results might differ for more typical room acoustics conditions.
In the new validation tests, speech was radiated into one room and listeners heard it while located close to the com-mon wall in an adjacent room. The recorded test sentences were reproduced using a dodecahedron loudspeaker located approximately 2 m from the center of the test wall in a large 共250 m3兲 reverberation chamber. The speech sounds were
naturally transmitted through the test wall into the adjacent room 共140 m3兲 where the listener was located. The
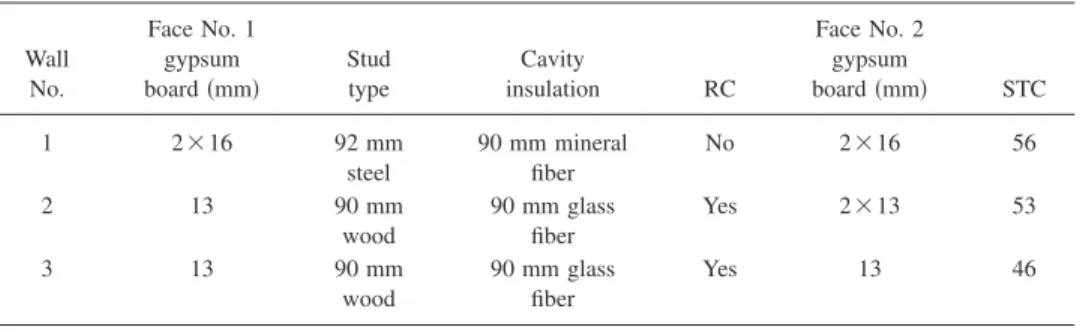
construc-tions of the three walls are described in TableIand they had sound transmission class 共STC兲 values of 46, 53, and 56.
Sound absorbing material was added to both rooms to reduce the reverberation times 共averaged over frequencies from 160 to 5000 Hz兲 in the receiving room to 0.64 s and in the source room to 0.80 s. With the added sound absorbing material present, the listeners heard speech sounds in realis-tic conditions representative of typical meeting rooms and heard speech sounds that had been transmitted through real walls.
The integrated 1 / 3-octave band levels of each test sen-tence were obtained as room average levels in the source room. The attenuation of speech sounds was determined us-ing a broadband white noise test signal, as the difference between the average level in the source room and the level at a point 0.25 m from the test wall in the receiving room 共similar to the procedure of ASTM E2638-08兲.18The average levels of each test sentence in the source room and the mea-sured attenuations were used to determine the speech levels in the receiving room at the location of the listener 0.25 m from the test wall. This was a more accurate estimate of the
speech levels at the receiver position than would be possible by directly measuring the, often low level, transmitted speech sounds.
Ambient noise was added to the receiving room from a single loudspeaker located across the room from the listener. Random noise, which was equalized to have an approxi-mately −5 dB/octave spectrum shape representative of typi-cal ventilation noise,14,15was used. The ambient noise levels were measured using a single microphone at the location of the listener’s head. Three different ambient noise levels were used: 24, 29, and 34 dBA. These were selected so that at the listener’s position, speech sounds varied from barely audible to completely intelligible.
From the transmitted speech levels and the ambient noise levels at the location of the listener’s head, SNRuni32
values were calculated. For each of three test walls, speech and noise levels were adjusted to give the most useful range of SNRuni32values. The intention was that the SNRuni32
val-ues should be evenly distributed over conditions from, not audible to most listeners, to quite intelligible to most listen-ers. An even distribution of SNRuni32values from just below
−25 dB to a maximum of about −3 dB was used.
The test protocol consisted of first turning on the noise signal and then a few seconds later playing one sentence. A few seconds after the end of the sentence, the noise stopped. In this experiment the start and stop of the noise was marked by a chime sound so that subjects did not miss the start of the often very low levels of noise. In a few cases there was no sentence present to minimize the probability of subjects al-ways guessing that they did hear some speech. After the noise had stopped, the subject told the experimenter what they had heard using a microphone to communicate with the researcher who was outside the test rooms. The subject first said whether any speech sounds were audible, and then if some speech was audible said whether they could hear the cadence or rhythm of the speech. Finally if they had heard the cadence, they repeated the words that they had under-stood back to the experimenter.
After all subjects had listened to all sentences, it was possible to calculate the fraction of the subjects, for each test sentence, who were able to hear any speech sounds, and determine an estimate of the audibility threshold as the SNRuni32 value for which 50% could just hear some speech
sound. Similarly, from the number of subjects who were able to hear the cadence of the speech, an estimate of the
thresh-TABLE I. Construction details of the three walls used in the two-room validation tests, 共RC, resilient channels; STC, sound transmission class兲.
Wall No. Face No. 1 gypsum board 共mm兲 Stud type Cavity insulation RC Face No. 2 gypsum board 共mm兲 STC 1 2 ⫻ 16 92 mm steel 90 mm mineral fiber No 2 ⫻ 16 56 2 13 90 mm wood 90 mm glass fiber Yes 2 ⫻ 13 53 3 13 90 mm wood 90 mm glass fiber Yes 13 46
old of the cadence was determined. The intelligibility thresh-old was determined as the point at which 50% of the subjects could just understand at least one word of each test sentence and the speech intelligibility score was determined as the fraction of the words correctly understood.
B. Results
The scores were first plotted versus SNRuni32 values
separately for each wall tested. However, it was not possible to detect systematic differences among the results for the different walls and the data for all three wall tests were com-bined.
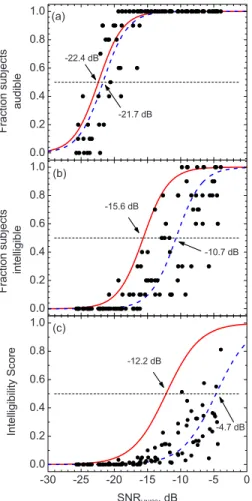
The upper part of Fig. 1 plots the fraction of listeners indicating that they heard some speech sounds versus SNRuni32values for the combined data from all three walls.
Each point indicates the fraction of the ten best listeners who heard speech sound for that particular condition. The solid line in this plot is the best-fit regression line obtained in the previous work.2The dashed line is the same form of curve but shifted to the right to better fit the new measured data. The point at which 50% of the subjects found the speech to be just audible was described as the threshold of audibility of
the speech and corresponded to a SNRuni32 of −22.4 dB in
the initial study. The best-fit lines were Boltzmann equations given by
y = 共A1− A2兲
1 + e共x−x0兲/dx+ A2, 共2兲 where y is the fraction responding or intelligibility score, x is the corresponding SNR, x0is the SNR for a y value of 0.5,
dx is related to the slope of the midportion of the curve, A1is
the minimum y value= 0.0, and A2is the maximum y value
= 1.0.
The regression fits to the new data were obtained by shifting the corresponding regression line from the initial study2to the right an amount that minimized the rms devia-tion about the regression line for the new data. Thus the dx parameter was not changed and only the x0 value was
changed corresponding to shifting the regression line hori-zontally.
Table II lists the x0 and dx parameters for each of the
regression lines in Fig.1. For the audibility scores, the shift between the new results and the previous results for the threshold of audibility was only 0.7 dB 共i.e., −22.4 to − 21.7 dB兲.
To examine the significance of the differences between the initial study results and the new results, the standard deviations of the measured values about the new best-fit line in terms of SNRuni32values were calculated. This cannot be
done for scores of either 0 or 1 for which SNRuni32values are
not defined for this type of equation. However, the standard deviation of the data points about the new best-fit line was calculated for all other points to give an indication of the relevance of the shift between the two best-fit lines. For the results in Fig.1, the standard deviation of the remaining data points 共excluding points with scores of 0 or 1兲 about the new best-fit line was ⫾2.2 dB in terms of SNRuni32values. This is
much larger than the 0.7 dB shift, and indicates that within the limits of the data, the new audibility data replicate and hence validate the previous results with respect to the audi-bility of transmitted speech sounds.
Figure 1共b兲 plots the fraction of listeners who under-stood at least one word versus SNRuni32 values. For these
data the new best-fit line that is shifted 4.9 dB to the right
-30 -25 -20 -15 -10 -5 0 0.0 0.2 0.4 0.6 0.8 1.0 -4.7 dB -12.2 dB (c) In te lli g ib ili ty Sco re SNRUNI32, dB 0.0 0.2 0.4 0.6 0.8 1.0 -10.7 dB -15.6 dB (b) F ra ct io n s u b je ct s in te lli g ib le 0.0 0.2 0.4 0.6 0.8 1.0 F ra ct io n su b je ct s a u d ib le (a) -22.4 dB -21.7 dB
FIG. 1. 共Color online兲 Comparison of results of initial study in approxi-mately free-field conditions 共solid line兲 共Ref.2兲 with the results of a two-room validation study 共data points and dashed line兲: 共a兲 fraction of subjects finding some speech audible, 共b兲 fraction of subjects able to understand at least one word, and 共c兲 speech intelligibility scores, all plotted versus values of the uniformly weighted signal-to-noise ratio 共SNRuni32兲. The decibel
val-ues and arrows on each plot indicate the various threshold valval-ues 关共a兲 and 共b兲兴 and speech reception threshold 共c兲.
TABLE II. Regression coefficients for the Boltzmann best-fit equations in Fig. 1. “Initial” identifies results from the previously published 共Ref.2兲 initial study and “validation” results form the new two-room validation study 共Ref.17兲. Response Expt. dx x0 Threshold of audibility Initial 1.8053 −22.41 Validation 1.8053 −21.70 Threshold of cadence Initial 1.4037 −20.05 Validation 1.4037 −17.50 Threshold of intelligibility Initial 1.8379 −15.64 Validation 1.8379 −10.70 Speech intelligibility score Initial 2.5259 −12.19 Validation 2.5259 −4.65
minimizes the vertical deviations of the data about the line. This is a quite large shift and almost all of the data points are to the right of the previous best-fit line 共the solid line in this figure兲. The standard deviation of the data about the new best-fit line in terms of SNRuni32 values was ⫾3.0 dB. The
shift in the new best-fit line relative to the initial best-fit line is much larger than the scatter of the data about the new best-fit line. For these data, listeners were much less likely to understand at least one word for a given SNRuni32value than
in the previous work. These results do not replicate the pre-vious work and indicate a greater degree of speech privacy for a given SNRuni32value than did the previous results.
Ac-cording to the new results, the threshold of intelligibility 共the point where 50% of the subjects could just understand at least one word兲 corresponds to a SNRuni32 value of −11 dB
rather than the −16 dB value from the initial work.
The fractions of the best ten subjects indicating that they heard the cadence of the speech sounds versus SNRuni32
val-ues were also determined.17 For these data the new regres-sion line was shifted 2.5 dB to the right to best fit the new data and the threshold of cadence was shifted from −20.0 to − 17.5 dB. This shift was intermediate to that for the audibility threshold and that for the intelligibility thresh-old.
The speech intelligibility scores are plotted versus SNRuni32values in Fig.1共c兲. The results are quite similar to
those for the speech intelligibility threshold 共SIT兲 in Fig.
1共b兲 in that a quite large shift is required to align the new best-fit regression line with the measured speech intelligibil-ity scores. In this case the new best-fit line was shifted 7.5 dB to the right relative to the previous best-fit line shown in Fig. 1共c兲. The standard deviation about the new best-fit line in Fig. 1共c兲 in terms of SNRuni32 values was ⫾2.9 dB.
Again the new results cannot be said to replicate the old results. The new data indicate much lower speech intelligi-bility scores at a given SNRuni32value.
C. Discussion of results of validation tests
The main purpose of these listening tests was to com-pare the results of the initial study with the new results ob-tained in a more realistically valid acoustical environment. The new results presented here do partially agree with the previous results, but also indicate some significant differ-ences.
There were not significant differences between the audi-bility threshold results from the previous work and the new results presented here. These new results validate the previ-ous threshold of audibility of speech sounds and confirmed it to be a SNRuni32value of −22 dB.
On the other hand, the mean trends for the threshold of intelligibility and for the speech intelligibility scores indicate differences of 5 – 7 dB relative to the previous studies. These are large and important differences that could lead to requir-ing walls with STC values 5–7 points larger than necessary. Such a large difference could lead to significant additional construction costs and it is essential to understand the cause of these differences.
There are many possible sources of error that could
in-fluence the results. For example, there could be errors in the measurement of speech and noise levels. However, this is unlikely to be the cause of the differences, since the same SNR values were used for both the audibility threshold and for the intelligibility threshold results. Since there is good agreement for the threshold of audibility results, it is reason-able to assume that the speech and noise level measurements were correct in both studies and that the subjects were ca-pable of hearing the speech sounds.
It is likely that the differences in intelligibility results are due to factors that would affect the understanding of speech and not the simple perception of the presence of speech sound as in the audibility test. Perhaps the most obvious factor is reverberation. It is well known that the intelligibility of speech is influenced by both the SNR and the reverbera-tion time of the listening space. However, the effects of re-verberation on speech intelligibility at the very low SNRs that are of concern in speech privacy issues are not well defined. In our new two-room validation experiment, the subjects listened to just audible speech modified by the re-verberation of both the source and the receiving rooms, but no measure of the effects of reverberation was included in determining the SNRuni32values.
One other possible contributing factor was the differ-ences in the spatial characteristics of the speech and noise sounds to which the listeners were exposed, which are well known to influence the intelligibility of speech.6,7In the ini-tial work2subjects listened in approximately free-field con-ditions. The speech sounds arrived from a loudspeaker sys-tem directly in front of the seated subject and the noise sounds arrived from another loudspeaker system directly overhead. Such conditions would maximize a listener’s abil-ity to understand speech.
In the new tests, speech sounds were radiated into one room with an average reverberation time of 0.80 s 共averaged over the frequencies 160– 5000 Hz兲; they traveled through a real wall and from the wall a further 0.25 m to the listener’s ear. Other speech sounds would reflect about the rooms and arrive a little later at the listener’s ears. The noise source was located at the opposite side of the room to the listener and hence the direct speech and noise sounds were spatially sepa-rated. However, the noise source was in a room with an average reverberation time over speech frequencies of 0.64 s and the listener would hear reflected noise sounds from many directions.
Although the conditions in the new experiment were more realistic and more representative of listening in real rooms, it is not known how the differences in added reflected speech and noise sounds would each affect speech intelligi-bility scores. Small amounts of reverberant sound do not usually have large effects on the intelligibility of speech. However, it is possible that we are more sensitive to the negative effects of reverberation for the very low signal-to-noise conditions in these experiments. Our knowledge of the effects of the spatial separation of speech and noise sources is almost entirely based on the perception of only the direct sounds in free-field conditions.6,7It is quite possible that the addition of reflected sound to the speech and noise signals considerably modifies these effects.
IV. INVESTIGATIONS OF SPATIAL AND TEMPORAL EFFECTS
A. Procedure
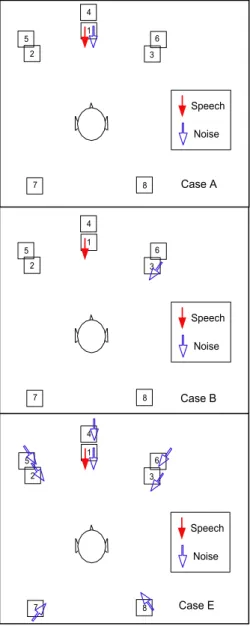
A second series of four experiments19was carried out to better understand the magnitude of particular details of the spatial and temporal differences in the sound fields of the initial tests and the new two-room validations tests. The ex-periments were mostly carried out in simulated sound fields in an anechoic room using an eight-channel simulation sys-tem. The eight loudspeakers of the system were positioned around the subject at angles listed in TableIIIand illustrated in Fig.2. Five of the loudspeakers 共1, 2, 3, 7, and 8兲 were in the horizontal plane of the listener’s ears and the other three were raised up above this plane. The listener sat facing loud-speaker No. 1, which reproduced the direct sound.
The signals to each loudspeaker were processed by four Yamaha DME32 digital signal-processing units connected together to function as one large unit. Speech and noise sig-nals were separately processed and mixed together for each loudspeaker. The loudspeakers were Tannoy model 800A units with concentric drivers so that all frequencies were ra-diated from the same location. In some cases all loudspeak-ers radiated speech and noise signals and in other cases only selected loudspeakers were used depending on the purpose of each test condition. For the noise signals, large delays were introduced between the signals to the different loud-speakers so that they arrived at the listener incoherently and when all eight loudspeakers were used conditions were per-ceived as very diffuse.
Because early-arriving sounds are perceived differently than later-arriving sounds,20early- and later-arriving speech sounds were varied independently. Each loudspeaker could reproduce simulations of four early-arriving sounds for a to-tal of 32 early-arriving sounds. The first early-arriving sound arrived from loudspeaker No. 1 共see TableIII兲 to simulate the direct sound. The other early-arriving sounds arrived within a 50 ms interval after the arrival of the simulated direct sound and were intended to simulate various early-arriving reflections. Digital reverberator components in the DME32 units were used to simulate the many later-arriving reflec-tions that would occur in a room.
One of the new experiments was carried out in the same conditions as the initial study2so that the same geometry of speech and noise sources could be included. This is a sound
isolated, quiet 共background level of 13 dBA兲, and acousti-cally dead space. In this space, speech sounds were repro-duced by loudspeakers approximately 2 m in front of the listener and located behind a curtain. A second set of loud-speakers in the ceiling void above the subject was used to produce simulated ventilation noise. In some cases the loud-speakers in front of the subject were used to reproduce both speech and noise sounds. A Yamaha DME32 unit was used to control the sounds to each of the loudspeaker systems. Each set of loudspeakers consisted of two Paradigm Compact Monitors and a Paradigm PW sub-woofer with a response corrected to be flat ⫾1 dB from 60 to 12 000 Hz at the lis-tener’s position.
In some cases speech sounds were filtered by the DME32 unit to represent transmission through a wall. A wall consisting of 16 mm gypsum board on both sides of light-weight 90 mm steel studs and with glass fiber material in the
TABLE III. Horizontal and vertical angles of the loudspeakers relative to the listener’s head. Angle 0,0 is straight ahead of the listener’s head.
Loudspeaker Horizontal angle 共deg兲 Vertical angle 共deg兲 1 Center 0 0 2 Left −32 0 3 Right +32 0 4 Center high 0 25 5 Left high −37 28 6 Right high +37 28 7 Left rear −115 0 8 Right rear +115 0 1 4 6 3 8 7 2 5 Speech Noise Case A 1 4 6 3 8 7 2 5 Speech Noise Case B 1 4 6 3 8 7 2 5 Speech Noise Case E
FIG. 2. 共Color online兲 Plan of loudspeaker locations and descriptions of simulated sound fields: Case A: speech and noise only from the same loud-speaker 共No. 1兲 directly in front of the listener, case B: speech and noise only from two separate loudspeakers 共Nos. 1 and 3兲, and case E: speech from ahead only and noise from all loudspeakers.
cavity was simulated. This construction would correspond to a STC rating of 47 and is typical of many interior office walls.
For these experiments ambient noise with an approxi-mately −5 dB per octave spectrum shape was again used with an overall level of 45 dBA. This is often referred to as “neutral” sounding and is representative of typical indoor noise spectra.14,15
To focus on the main differences between the two pre-vious studies, in these tests only speech intelligibility scores were obtained. A number of spatially different combinations of speech and noise sources were compared as well as dif-ferences in added reflected sounds. These are later described with the results of each comparison. For each configuration, tests were carried out at two different SNRs. To make it possible to combine the results for two different SNRs all speech intelligibility scores were converted to speech recep-tion threshold 共SRT兲 values. The SRT is the SNR for which the mean intelligibility score is 50%. This provides more accurate descriptors of the intelligibility scores for each con-figuration by basing the results on a larger number of re-sponses because the results of two SNRs could be combined. SRT values were calculated using the same Boltzmann equations described previously. When plotting speech intel-ligibility scores versus SNRuni32values, the SRT value is the
x0 value in Eq.共2兲. Using the same dx values as in the
pre-vious studies 共TableII兲, the SRT can be calculated using the Boltzmann equation and the mean intelligibility scores with the corresponding SNRuni32values from each test. The results
were obtained in four separate experiments, which are de-scribed in Table VII in the Appendix along with the SRT values for each configuration tested.
B. Simple spatial release from masking
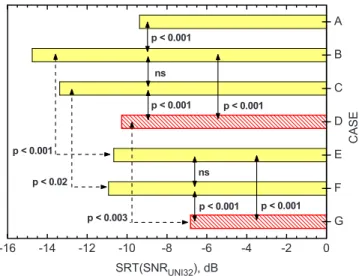
The first tests demonstrated simple spatial release from masking effects to confirm the validity of the new results as well as to serve as a reference case with which subsequent results can be compared. Configurations A, B, and E are described in Fig.2and TableIV. Figure2shows a top down view of the subject and loudspeakers with solid arrows indi-cating sources of speech sounds and open arrows for sources of simulated ventilation noise. As illustrated in Fig.2, speech and noise were produced by only loudspeaker No. 1 directly in front of the subject in case A. In case B the speech and noise sources were separated in the horizontal plane so that
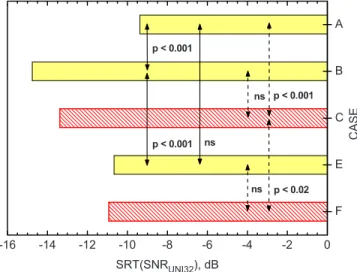
the speech came from only loudspeaker No. 1 共directly in front of the subject兲 and the noise came from only loud-speaker No. 3 共32° to the right of straight ahead兲. In case E, the speech again came from only loudspeaker No. 1 but the noise was radiated from all eight loudspeakers. Because of the large delays between the noise signals to each loud-speaker, the subject experienced a very diffuse noise sound. The SRT values for these three cases are compared in the filled bars of Fig.3. 共SRT values and details of all cases are summarized in Table in the Appendix兲. Of the three, case A has the highest SRT value 共−9.37 dB兲 indicating the lower intelligibility scores that result when the speech and noise come from exactly the same source location. Case B has a much lower SRT value 共−14.75 dB兲, indicating a spatial re-lease from masking when the sources of the speech and the noise are spatially separated. However, when the noise comes from all directions, as in case E, the SRT 共−10.67 dB兲 is similar to that for case A.
A oneway analysis of variance for the experiment No. 1 results, which included these three conditions, indicated sig-nificant variations in SRT values 共F = 25.15, p ⬍ 0.001兲. A post hoc Bonferroni test of the individual differences indi-cated that cases A and B were significantly different 共p ⬍ 0.001兲 as were cases B and E 共p ⬍ 0.001兲. However, the difference between the SRT values for cases A and E was not statistically significant.
When the noise source was separated from the speech source by 32° in the horizontal plane the SRT decreased by 5.4 dB, which agrees with previously published results.6,11 The comparisons with case E results suggest that a diffuse masking noise arriving from all directions leads to results that are quite similar to the case of coincident speech and noise sources 共case A兲 and in this experiment cases A and E were not significantly different. That is, in real rooms with at least somewhat diffuse noise, and where the listener is in the reverberant field of the talker, we would expect less spatial release from masking for separated speech and noise sources.
TABLE IV. Descriptions of cases A, B, and E to demonstrate simple spatial release from masking and cases C, D, and F to demonstrate the effects of added early-arriving reflections of speech sounds.
Case Speech Noise Wall
A Direct from No. 1 Direct from No. 1 None B Direct from No. 1 Direct from No. 3 None C Direct+ early reflections Direct from No. 3 None D Direct+ early+ T60= 1 Direct from No. 3 None
E Direct from No. 1 Diffuse from all None F Direct+ early reflections Diffuse from all None G Direct+ early+ T60= 1 Diffuse from all None
-16 -14 -12 -10 -8 -6 -4 -2 0 F E C B A ns p < 0.001 p < 0.001 ns p < 0.02 C A S E SRT(SNRUNI32), dB p < 0.001 ns
FIG. 3. 共Color online兲 SRT values for cases A, B, C, E, and F with configu-rations illustrated in Fig.2and described in TableIV. Arrows indicate the two cases for which significance of the difference is given. Solid filled bars: simple spatial release from masking cases. Hatched bars: cases with added early-arriving reflections.
C. Effects of early-arriving reflections of speech
Early-arriving reflections were radiated from all eight loudspeakers, so that they arrived within about 50 ms after the direct sound and decreased realistically in amplitude with increasing time. Such early-arriving reflections have been shown to increase speech intelligibility equivalent to increas-ing the level of the direct sound by the increase in energy added by the early-arriving reflections.20 In these experi-ments the speech levels were adjusted to be the same for both with and without early-arriving reflections cases. Case C included direct speech and early reflections 共ERs兲 of speech from all loudspeakers combined with simulated ven-tilation noise from only loudspeaker No. 3. Case F was simi-lar to case C but included simulated ventilation noise arriv-ing diffusely from all eight loudspeakers 共as in case E兲.
Figure 3 compares the SRT values for cases C and F 共hatched bars兲 with those configurations previously de-scribed 共solid filled bars兲. Case C is essentially the result of adding ERs to the conditions of case B without any change in the overall speech level. Figure 3 indicates a small in-crease in SRT value for case C relative to case B. Case F is essentially the result of adding early-arriving reflections of speech sounds to case E. The results in Fig. 3 indicate a small decrease in the SRT value for case F relative to case E. A oneway analysis of variance on the experiment No. 1 conditions showed a statistically significant pattern of varia-tions in SRT values 共F = 25.25, p ⬍ 0.001兲 but a post hoc Bonferroni test showed that the SRT values for cases B and C 共with added ERs兲 were not significantly different. Simi-larly the SRT values for cases E and F were not significantly different.
Although not statistically significant, adding ERs, while maintaining the same overall speech level, did increase the SRT value a little for case C compared to case B. This may have been because the speech energy in the ERs included some speech from the same direction as the noise, which might tend to increase the SRT a little for this case. When ERs were added to configurations in which the noise came from all eight loudspeakers, the added early-arriving speech reflections decreased the SRT slightly but not significantly 共cases E and F兲. In both cases adding ERs of the speech energy was largely equivalent to increasing the level of the direct speech sound as was expected. ERs did not signifi-cantly affect spatial unmasking effects in these simulations.
D. Added effects of reverberant speech
The digital reverberators in the DME32 units were used to add a reverberant decay of the speech sounds after the early-arriving reflections, but with the overall speech level not varied. In the configurations presented here, the reverber-ant sound had a mid-frequency reverberation time of 1.0 s. Figure 4 compares the resulting SRT values with those for the previously described cases.
Case D was constructed by adding a reverberant decay to the case C configuration, which had included direct speech, early-arriving reflections of the speech sounds, and noise from only loudspeaker No. 3. When reverberant speech was added to case C, the SRT was increased from
−13.78 to − 10.27 dB and this difference was statistically significant 共oneway F = 25.25, p ⬍ 0.001, post hoc Bonferroni
p ⬍ 0.001兲.
Similarly, for the cases with diffuse noise from all loud-speakers, adding reverberant sound increased the SRT from −10.93 dB for case F to −6.82 dB for case G. This difference was statistically significant 共oneway F = 25.25, p ⬍ 0.001, post hoc Bonferroni p ⬍ 0.001兲.
While adding ERs of the speech did not significantly change the SRT 共for constant speech level兲, adding reverber-ant speech increased the SRT by 3 – 4 dB independent of the spatial differences in the simulated ambient noise. The addi-tion of reverberant speech adds to the masking of the speech independently from that of adding diffuse noise.
E. Effects of varied reverberation time
The effect of reverberant speech was further investigated by comparing conditions with reverberation times of 0.5, 1.0, and 2.0 s. All cases included direct speech and early-arriving reflections with added reverberant speech with one of three different reverberation times. These comparisons were also repeated with and without modifications to the spectrum of the speech sound to simulate the effect of propagation through the wall.
Case P corresponded to no wall, and speech with added ERs. Speech and noise sounds were reproduced by all eight loudspeakers. This base case without reverberant sound was compared with cases Q, R, and S, which had added reverber-ant speech with reverberation times of 0.5, 1.0, and 2.0 s, respectively. The resulting mean SRT values for each case are given in Fig.5共see TableV兲.
For the cases without a simulated wall, adding reverber-ant speech with a 0.5 s reverberation time 共case Q兲 to case P 共which had only ERs of the speech兲 only increased the SRT by a small amount and the difference was not statistically significant. However, adding more reverberant speech corre-sponding to a 1.0 s reverberation time 共case R兲 and a 2.0 s reverberation time 共case S兲 produced larger and statistically
-16 -14 -12 -10 -8 -6 -4 -2 0 G F E D C B A p < 0.003 p < 0.02 p < 0.001 ns p < 0.001 p < 0.001 p < 0.001 p < 0.001 C A S E SRT(SNRUNI32), dB p < 0.001 ns
FIG. 4. 共Color online兲 SRT values for cases A–G with configurations illus-trated in Fig.2. Solid filled bars are repeated from previous figure. See Table
IVfor descriptions of cases.
significant increases in SRT values 共oneway on the experi-ment No. 4 data: F = 94.15, p ⬍ 0.001, post hoc Bonferroni,
p ⬍ 0.001兲.
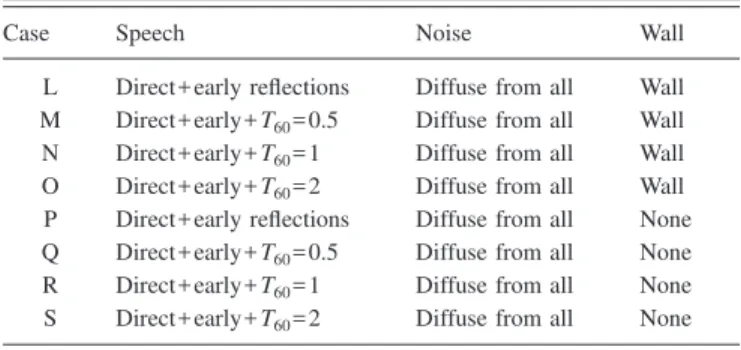
Case L was similar to case P but with the inclusion of filtering to simulate transmission through a wall for the speech sounds. The SRT value from case L is compared with those for cases M, N, and O with reverberation times of 0.5, 1.0, and 2.0 s, respectively, in Fig.5. All of these cases in-cluded simulated transmission through a wall for the speech sounds.
When a simulated wall was included, the results of cases L, M, N, and O showed a similar progression of changes in the SRT values. Adding only reverberant speech with a 0.5 s reverberation time 共case M兲 led to a non-significant change. However, adding reverberant speech with a 1.0 or a 2.0 s reverberation time each led to large and statistically signifi-cant increases in SRT values 共oneway on the experiment No. 3 data: F = 31.51, p ⬍ 0.001, post hoc Bonferroni p ⬍ 0.001兲. For these cases with reverberation times of 0.5, 1.0, and 2.0 s, the corresponding with-wall and without-wall cases were not significantly different 共independent t-test兲 共indi-cated by the solid U-shaped arrows in Fig.5兲.
In order to better understand the changes in SRT values caused by increasing the reverberant speech sound, the mean SRT values are plotted versus the logarithm of the reverbera-tion time in Fig.6. The data for the cases with only ERs are included with a reverberation time of 0.5 s because these
results were not statistically different than the results for a 0.5 s reverberation time. On this plot the SRT values are seen to increase linearly as the logarithm of the reverberation time increased. The results for the with and without a simulated wall cases led to very similar results. The two regression equations and an average for all data are
SRT = 8.602 log10共T60兲 − 6.407 共no wall兲, 共3兲
SRT = 9.774 log10共T60兲 − 6.201 共with wall兲, 共4兲
SRT = 9.187 log10共T60兲 − 6.304 共all data兲. 共5兲
These can be used to predict the effects of reverberation in meeting rooms on the SRT of the transmitted speech.
F. Effects of horizontal and vertical separations of speech and noise sources
Figure3 showed the results of separating single speech and noise source by 32° in the horizontal plane. Because the initial study2included vertically separated speech and noise sources, such cases were repeated here both with and without a simulated wall. The SRT values for the horizontally and the vertically separated conditions are compared in Fig.7. In all cases separating speech and noise sources led to a highly significant decrease in SRT values 共p ⬍ 0.001兲. A comparison of the SRT values for cases A and B indicated a 5.4 dB shift in SRT values when the speech and noise sources were sepa-rated by 32° horizontally.
Case I was essentially a repeat of case A except in a completely different experiment and test facility. In both cases speech and noise sounds came from only the loud-speaker directly in front of the listener. The difference be-tween the SRT values of cases A and I was very small and was not statistically significant. This makes it possible to compare the effects of horizontal separation of speech and noise sources 共cases A and B兲 with vertical separation 共cases H and I兲. In case H the speech and noise sources were sepa-rated by 90° in the vertical plane but the spatial release from
-12 -10 -8 -6 -4 -2 0 S R Q P O N M L ns ns ns T60=2.0 T60=1.0 p < 0.001 ns p < 0.001 p < 0.001 p < 0.001 p < 0.001 p < 0.001 p < 0.001 p < 0.001 p < 0.001 C A S E SRT(SNRUNI32), dB p < 0.001 ns T60=0.5
FIG. 5. 共Color online兲 SRT values for cases L–S, all with speech and noise sounds from all eight loudspeakers. Bars with hatched lines show cases with varied reverberation time. See TableVfor descriptions of cases.
TABLE V. Descriptions of the effects of added reverberation: cases P, Q, R, and S without a wall and cases L, M, N, and O with a wall.
Case Speech Noise Wall
L Direct+ early reflections Diffuse from all Wall M Direct+ early+ T60= 0.5 Diffuse from all Wall
N Direct+ early+ T60= 1 Diffuse from all Wall
O Direct+ early+ T60= 2 Diffuse from all Wall
P Direct+ early reflections Diffuse from all None Q Direct+ early+ T60= 0.5 Diffuse from all None
R Direct+ early+ T60= 1 Diffuse from all None
S Direct+ early+ T60= 2 Diffuse from all None
0.1 1 10 -10 -9 -8 -7 -6 -5 -4 -3 SR T (SN RU N I3 2 ), d B T60, s
FIG. 6. 共Color online兲 Mean SRT values plotted versus the logarithm of the reverberation time 共T60兲 of the simulated speech sounds. Dashed line and
open symbols: no wall; solid line and filled symbols: speech transmission through a wall.
masking 共decrease in SRT value兲 was a little less than when speech and noise sources were separated by 32° in the hori-zontal plane 共cases A and B兲.
Comparing SRT values for cases K and J indicates a similar spatial release from masking when the speech and noise were separated by 90° in the vertical plane and when speech sounds were in both cases modified to represent transmission through a wall. The SRT values tended to be slightly higher than for the corresponding cases without a simulated wall. However, the differences were not statisti-cally significant. 共It is interesting to note that the SRT value for case J was −12.46 dB, which was very similar to the value of −12.19 obtained previously.2兲
G. Effects of single, diffuse, and semi-diffuse noise sources
The difference between the masking effects of ambient noise from a single noise source, which was spatially sepa-rated from the speech source, and speech with a diffuse noise from all eight loudspeakers represents two extremes. It is likely that in real rooms intermediate cases are found for which the noise might be described as “semi-diffuse.” Such semi-diffuse conditions were produced by radiating the simulated ambient noise predominantly from three adjacent loudspeakers. Because one case included a cluster of noise sources from the rear side of the listener, a single rear-side noise source was also tested as a reference case. These new noise source conditions were compared with the previously described conditions that included either a single noise source or diffuse noise from all eight loudspeakers.
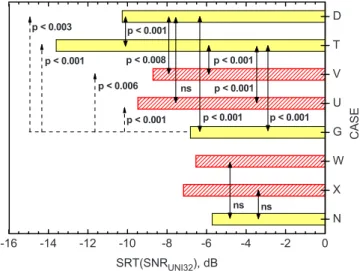
Figure8compares SRT values for varied noise masking configurations. The upper five configurations 共D, T, V, U, and G兲 on the graph are for conditions that did not include a simulated wall. Conditions, which included a simulated wall, are in the lower three bars of the graph 共W, X, and N兲. The speech signal in all conditions included direct sound, ERs, and reverberant speech with a 1 s reverberation time to rep-resent conditions in a real room.
Comparing SRT cases D and T shows that the single noise source from the rear side 共case T with noise from only loudspeaker No. 8兲 led to a larger spatial release from mask-ing 共i.e., lower SRT兲 than for a smask-ingle noise source from the front side 共case D兲 and the difference was highly significant 共independent t-test, p ⬍0.001兲. SRT case V for a semi-diffuse noise from the front side has a higher SRT than the single noise source from the front side 共i.e., case D兲 共inde-pendent t-test, p ⬍ 0.008兲. Similarly, a semi-diffuse noise source from the rear side 共SRT case U兲 had a higher SRT than the single noise source from the rear side 共SRT case T兲 共independent t-test, p ⬍0.001兲. However, SRT case G, with diffuse noise from all eight loudspeakers, had the highest SRT of all the cases without a simulated wall.
The semi-diffuse conditions 共cases U and V兲 were inter-mediate to the single separated noise source conditions 共cases D and T兲 and the all eight loudspeaker noise source condition 共case G兲. Noise sources to the rear side 共cases T and U兲 led to lower SRT values than the corresponding noise sources from the front side 共cases D and V兲. As shown in Fig. 8 all of the differences due to changes in either the direction or diffuseness of the noise were statistically signifi-cant.
The lower three bars of Fig.8共configurations W, X, and N兲 include results for similar conditions except that the speech sounds were filtered to simulate transmission through the wall. These results show a little higher SRT values than the corresponding cases without walls. Although the corre-sponding conditions seemed to have higher SRT values when a simulated wall was included, none of the differences be-tween the with- and without-wall cases were statistically sig-nificant. That is, cases with semi-diffuse noise from the front side 共cases V and W兲 were not significantly different and neither were the two semi-diffuse noise from the rear-side conditions 共cases U and X兲. Similarly, the two cases with all eight loudspeaker radiating noise 共cases G and N兲 were not significantly different. From these results one must conclude
-16 -14 -12 -10 -8 -6 -4 -2 0 J K H I B A ns ns p < 0.001 p < 0.001 p < 0.001 p < 0.02 C A S E SRT(SNRUNI32), dB ns
FIG. 7. 共Color online兲 SRT values for cases A, B, I, H, K, and J with separations of speech and noise in the horizontal plane 共hatched bars兲 and in the vertical plane 共solid filled bars兲.
-16 -14 -12 -10 -8 -6 -4 -2 0 N X W G U V T D ns p < 0.001 ns p < 0.001 p < 0.001 p < 0.001 p < 0.001 p < 0.003 p < 0.001 p < 0.006 p < 0.001 C A SE SRT(SNRUNI32), dB p < 0.008 ns
FIG. 8. 共Color online兲 SRT values for cases D, G, N, T, U, V, W, and X with varied masking noise configurations. Cases D, T, V, U, and G do not include a simulated wall; cases W, X, and N include a simulated wall. 共Bars with hatched lines are semi-diffuse cases.兲
that there is no proof of an effect of transmission though a wall when conditions are described in terms of SNRuni32
val-ues.
H. Changes in speech intelligibility thresholds
The main focus of this work was on speech intelligibility scores expressed in terms of SRT values. However, previ-ously established criteria for acceptable speech privacy were in terms of the SIT values.2The SIT is the SNR for which 50% of a panel of listeners can just understand at least one word of a test sentence. For approximately free-field condi-tions, the threshold of intelligibility was found to correspond to a SNRuni32value of −16 dB.
2
However, in the two-room validation tests 关see Fig.1共b兲兴, the threshold of intelligibility was increased by 4.9 dB to a SNRuni32 value of
approxi-mately −11 dB.
To determine threshold of intelligibility values requires data for conditions with a significant number of responses with low intelligibility scores extending down to zero. In most of the new tests such conditions were deliberately avoided to provide data mostly in the range 10%–90% intel-ligibility scores. However, one series of conditions with var-ied reverberation times and with ambient noise coming from all eight loudspeakers did include a significant number of low intelligibility cases from which SITs could be deter-mined. These data were for natural speech without simulated transmission through a wall and were used to determine new estimates of the effects of reverberation and diffuse noise on the SIT criteria.
Values of the threshold of intelligibility were calculated in a manner similar to the calculation of SRT values de-scribed in Sec. IV A of this paper. The fraction of the listen-ers indicating at least one word was undlisten-erstood for each test configuration was considered in terms of plots of these val-ues versus SNRuni32values. A Boltzmann equation was fitted
to the data using the same dx value as previously obtained for SITs 共Ref. 2兲 corresponding to a value of 1.8739 共see TableII兲. SIT values were calculated using Eq.共2兲and using
dx = 1.8739. The fraction of subjects understanding at least
one word was y and x0was the threshold of intelligibility. As
before, x was the SNRuni32 value corresponding to the y
value. The resulting SIT values are given in Table VI. The other information in TableVI is repeated from the descrip-tion of configuradescrip-tions in TableVIIVIIin the Appendix.
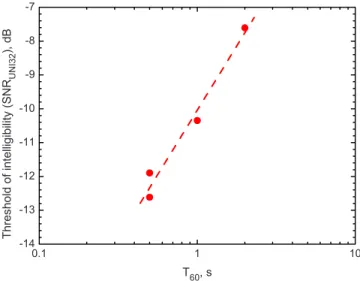
The calculated SITs are plotted versus the logarithm of
T60 values in Fig.9. The SIT values are approximately
lin-early related to the logarithm of the reverberation time simi-lar to the plot of SRT values versus T60 in Fig.6. As in Fig.
6, the case with only ERs was plotted as having a T60 value
of 0.5 s.
Figure 9 suggests that for a typical meeting room, the SIT would be approximately a SNRuni32 value of −11 dB,
corresponding to a T60 value of 0.75 s. A little lower or
higher values are indicated for lower or higher reverberation times. The criterion for the SIT should be raised from −16 dB for free-field conditions with spatially separated speech and noise sources,2 to −11 dB for conditions where there is reverberant speech and diffuse ambient noise as found in most meeting rooms. This agrees well with the re-sult from the two-room validation study as shown in Fig.
1共b兲. Small adjustments for differences in reverberation times could be made if needed but are usually not justified.
V. DISCUSSION
The new results clearly demonstrate that temporal and spatial effects influence speech privacy in that they can sig-nificantly change the intelligibility of speech and the thresh-old of intelligibility. Both the results in Sec. IV H and the results of the two-room validation study indicate that shifts in the threshold of intelligibility of 5 dB or more are pos-sible. Ignoring these effects could lead to a 5 dB over-design of the sound insulation of the meeting room.
The SRT 共expressed in terms of SNRuni32values兲 for the
various conditions similarly indicate that speech intelligibil-ity scores can be significantly affected by spatial and tempo-ral effects of room acoustics. These results can be used to explain the difference between the initial results in approxi-mately free-field conditions2 and the new two-room valida-tion study results. In the initial study, subjects heard speech
TABLE VI. SITs in terms of SNRun132values in decibels. “ER,” direct sound and early-arriving reflections;
“T60= 0.5,” direct sound early-arriving reflections and reverberant sound with a 0.5 s reverberation time.
SRT case Wall Speech Noise
SIT 共dB兲 Expt. P No wall ER All −12.62 4 Q No wall T60= 0.5 All −11.89 4 R No wall T60= 1 All −10.35 4 S No wall T60= 2 All −7.61 4 0.1 1 10 -14 -13 -12 -11 -10 -9 -8 -7 T h re s h o ld o f in te lli g ib ili ty (SN RU N I3 2 ), d B T60, s
FIG. 9. 共Color online兲 SIT versus T60for unmodified speech 共i.e., no
simu-lated wall兲 and diffuse noise.
sounds from only directly in front of them and simulated ventilation noise from only above them. Going from this 共case J兲 to the co-located speech and noise configuration 共case K兲 decreased the SRT by 4.45 dB. Going from a co-located speech and noise configuration to a condition with diffuse noise would increase SRT by a further 1.30 dB. Com-bining these two differences would give a total SRT change of 3.15 dB. Finally adding on the effects of room reverbera-tion from Fig.9leads to a further increase in SRT of 3.03 dB to give a total expected increase in SRT of 6.18 dB between the conditions of the initial study2and those of the two-room validation tests. This is reasonably close to the 7.5 dB differ-ence in SRT values seen in Fig. 1共c兲.
Clearly these results can be used to estimate the effects for other conditions including varied sound diffusion of the rooms, varied reverberation times, and the effects of various spatial separations of speech and noise sources in spaces with high sound absorption. In spaces that are highly absorp-tive, listeners will benefit from spatial separation of speech and noise sources and speech privacy will be reduced. Strong early-arriving reflections of the speech sound will increase the effective speech level because the early-arriving reflec-tions are not perceived as spatially or temporally separated from the direct sound and are equivalent to increasing the level of the direct sound. However, reverberant sound will minimize any spatial release from masking and lead to de-creased intelligibility and hence inde-creased speech privacy.
It is difficult to precisely compare the new results with those from the many previous studies in the literature be-cause of the methodological differences among the various investigations. For example, subjective ratings of conditions have frequently been used rather than speech intelligibility scores.11,13Kollmeier and Wesselkamp21showed that the re-sults of these two approaches are correlated but there are differences in the magnitude of the effects and the form of the trends with varying SNR can also be different. A number of studies have used such subjective ratings in an iterative procedure to determine SRT values. In their tests, the subject heard the same speech material repeatedly and decided when it appeared to be just intelligible. This is quite different than listening to each test sentence only once and counting the fraction of words correctly understood, as in the current work.
No previous work has examined the separate effects of early-arriving reflections of speech sounds on the various spatial effects. Descriptions of room acoustics conditions and reverberation are often not very detailed and conditions with as little as a 0.4 s reverberation time have been tested as a reverberant extreme.12In previous studies interfering sounds have most frequently been speech and much of the work was focused on explaining the cocktail party effect. Where the interfering sound has been noise, it has most often been noise with a speech spectrum shape. At least one study used white noise22 but none have used noise representative of typical indoor ambient noises.
The initial test results comparing SRT cases A and B confirmed the expected spatial release from masking when the speech and noise sources were horizontally separated by 32° in free-field conditions. The 5.4 dB difference in SRT
values for these two cases is of similar magnitude to results in several previous studies.4,11,13 In Bronkhorst’s review6he indicated that values between about 4 and 6 dB occur for this angular separation. The decreased SRT for the rear-side noise source 共case T兲 is also supported by the results in Bronkhorst’s summary6 that indicate maximum spatial re-lease from masking when the interfering source is at an angle of 110°–120° from straight ahead. A 90° vertical separation of the speech and noise sources 共speech from in front of the listener and noise from overhead, as in cases H and I兲 had a 4.7 dB spatial release from masking, a little smaller than the 5.4 dB difference for the 32° horizontal separation. No pre-vious measurements of the effect of a vertical separation of speech and noise sources were found.
There are very few previous results that can be com-pared with the diffuse interfering noise in the present study where the noise came incoherently from all eight loudspeak-ers as in case E of the present work. This resulted in a SRT only 1.3 dB lower than the case of coincident speech and noise sources 共case A兲. That is, with diffuse noise, there is very little spatial release from masking. Some previous work has showed that the magnitude of the spatial release from masking decreases as the number of spatially separated noise sources increases.11 In a similar manner, the semi-diffuse cases in the present work show that the spatial release from masking is significantly reduced when there were three spa-tially close masking sources compared to a single noise source.
Adding ERs to the speech sounds did not significantly change measured SRT values either with a horizontally sepa-rated speech and noise or with noise from all loudspeakers. This extends our understanding of the beneficial effects of early-arriving reflections on the intelligibility of speech20and it can be said that early-arriving reflections of speech sounds do not reduce our ability to benefit from spatially separated speech and noise sources. In rooms, the addition of early-arriving reflections will increase the effective SNR and en-hance the intelligibility of speech.
Adding reverberant speech sound does degrade the in-telligibility of speech in noise. The addition of reverberant speech with a 1 s reverberation time had about the same magnitude of increase in SRT as did adding diffuse noise to the case B results with neither reverberation nor diffuse noise. That is, although they are completely independent ef-fects, adding diffuse noise or adding reverberant speech in these cases led to about the same 4 dB increase in SRT val-ues. When both diffuse noise and reverberant speech were included 共case G兲, then the SRT was increased by about 8 dB or approximately the sum of the individual effects.
The effect of adding reverberant speech increased lin-early with the logarithm of the reverberation time above a reverberation time of about 0.5 s. The addition of reverberant sound with a 0.5 s reverberation time did not significantly change the measured SRT relative to the case with only early-arriving reflections added to the speech sound. It is only for more reverberant conditions that the negative effects of reverberation became significant. In these experiments adding ERs and reverberation to the speech was accom-plished while maintaining a constant overall speech level at
the position of the listener. In a real room, the addition of reflected sound would increase the overall level of the speech, which could further modify the intelligibility of speech depending on the relative amounts of early-arriving and later-arriving speech sounds.
In some cases the speech sounds were modified to simu-late propagation through a wall and cases were compared both with and without the effect of a simulated wall. When this was done for cases with varied reverberation time and also for varied noise diffusion, there were no significant ad-ditional effects of adding a simulated wall. That is, the re-sults apply equally well to natural speech as they do to speech filtered by propagation through a wall. Similarly in the validation study, there were no differences for the results using three different walls. However, this was only true when results were considered in terms of uniformly weighted signal-to-noise ratio 共SNRuni32兲 values and not for SNR
mea-sures with other frequency weightings.19 The uniform fre-quency weighting of the SNRuni32measure seems to make it
an ideal measure for assessing speech privacy conditions.
VI. CONCLUSIONS
Although speech privacy may be primarily a signal-to-noise issue, it is also significantly influenced by the spatial
and temporal characteristics of sound in rooms. The two-room validation study results and the subsequent investiga-tions of the various combinainvestiga-tions of speech and noise showed that SRTs can be changed by 5 dB or more by the differences in the spatial relationships between speech and noise sources as well as the effects of reflected sound in rooms. As speech privacy is most often considered to corre-spond to reduced speech intelligibility, these effects are prac-tically important and ignoring them could lead to expensive over-design of the sound insulation of meeting rooms, to provide the required speech privacy against eavesdroppers.
These new results have made it possible to revise previ-ous estimates of the threshold of intelligibility from a SNRuni32 value of −16 to a value of −11 dB to be more
representative of conditions in typical meetings rooms. The new results also make it possible to estimate further modifi-cations to speech privacy criteria to better suit particular combinations of room reverberation and spatial separations of speech and noise sources.
These results do not suggest that the audibility of speech in noise is influenced by the same spatial and temporal room acoustics effects. That is, the threshold of audibility of
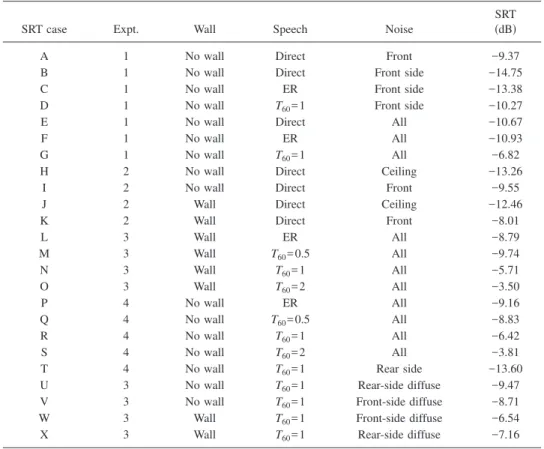
TABLE VII. SRT values and descriptions of conditions for 24 test configurations. Column “Expt.” indicates to which of the four experiments each case belonged 共each experiment used different subjects兲. Column “Wall” indicates whether a simulated wall was included or not. Column “Speech” indicates the composition of the speech signal: “Direct,” direct sound only; “ER,” direct sound and early-arriving reflections, “T60= 0.5,” direct
sound early-arriving reflections and reverberant sound with T60= 0.5 s; “T60= 1,” direct sound early-arriving
reflections and reverberant sound with T60= 1.0 s; “T60= 2,” direct sound early-arriving reflections and
rever-berant sound with T60= 2.0 s. Column “Noise” indicates the composition of the noise signal: “Front,” from only
loudspeaker No. 1 directly in front of subject; “Front side,” from only loudspeaker No. 3; “All,” uncorrelated noise from all eight loudspeakers; “Ceiling,” from only immediately overhead; “Rear side,” from only loud-speaker No. 8; “Front-side diffuse,” predominantly from loudloud-speaker Nos. 1, 3, and 6; and “Rear-side diffuse,” predominantly from loudspeaker Nos. 6, 8.
SRT case Expt. Wall Speech Noise
SRT 共dB兲
A 1 No wall Direct Front −9.37
B 1 No wall Direct Front side −14.75
C 1 No wall ER Front side −13.38
D 1 No wall T60= 1 Front side −10.27
E 1 No wall Direct All −10.67
F 1 No wall ER All −10.93
G 1 No wall T60= 1 All −6.82
H 2 No wall Direct Ceiling −13.26
I 2 No wall Direct Front −9.55
J 2 Wall Direct Ceiling −12.46
K 2 Wall Direct Front −8.01
L 3 Wall ER All −8.79 M 3 Wall T60= 0.5 All −9.74 N 3 Wall T60= 1 All −5.71 O 3 Wall T60= 2 All −3.50 P 4 No wall ER All −9.16 Q 4 No wall T60= 0.5 All −8.83 R 4 No wall T60= 1 All −6.42 S 4 No wall T60= 2 All −3.81
T 4 No wall T60= 1 Rear side −13.60
U 3 No wall T60= 1 Rear-side diffuse −9.47
V 3 No wall T60= 1 Front-side diffuse −8.71
W 3 Wall T60= 1 Front-side diffuse −6.54
X 3 Wall T60= 1 Rear-side diffuse −7.16