Publisher’s version / Version de l'éditeur:
Proceedings of the ASME Internal Combustion Engine Division Fall Technical
Conference ICEF 2009, 2009
READ THESE TERMS AND CONDITIONS CAREFULLY BEFORE USING THIS WEBSITE.
https://nrc-publications.canada.ca/eng/copyright
Vous avez des questions? Nous pouvons vous aider. Pour communiquer directement avec un auteur, consultez la première page de la revue dans laquelle son article a été publié afin de trouver ses coordonnées. Si vous n’arrivez pas à les repérer, communiquez avec nous à [email protected].
Questions? Contact the NRC Publications Archive team at
[email protected]. If you wish to email the authors directly, please see the first page of the publication for their contact information.
NRC Publications Archive
Archives des publications du CNRC
This publication could be one of several versions: author’s original, accepted manuscript or the publisher’s version. / La version de cette publication peut être l’une des suivantes : la version prépublication de l’auteur, la version acceptée du manuscrit ou la version de l’éditeur.
Access and use of this website and the material on it are subject to the Terms and Conditions set forth at
A study on the performance of combustion in a HCCI engine using
n-heptane by a multi-zone model
Guo, Hongsheng; Li, Hailin; Neill, W. Stuart
https://publications-cnrc.canada.ca/fra/droits
L’accès à ce site Web et l’utilisation de son contenu sont assujettis aux conditions présentées dans le site LISEZ CES CONDITIONS ATTENTIVEMENT AVANT D’UTILISER CE SITE WEB.
NRC Publications Record / Notice d'Archives des publications de CNRC:
https://nrc-publications.canada.ca/eng/view/object/?id=2579f7f1-7267-4480-9be6-ed3ca770f0bf https://publications-cnrc.canada.ca/fra/voir/objet/?id=2579f7f1-7267-4480-9be6-ed3ca770f0bfProceedings of the ASME Internal Combustion Engine Division 2009 Fall Technical Conference ICEF2009 September 20-24, 2009, Lucerne, Switzerland
ICEF2009-14117
A STUDY ON THE PERFORMANCE OF COMBUSTION IN A HCCI ENGINE USING
N-HEPTANE BY A MULTI-ZONE MODEL
Hongsheng Guo
Institute for Chemical Process and Environmental Technology, National Research Council of
Canada,
Ottawa, Ontario, Canada K1A 0R6
Hailin Li
West Virginia University Morgantown, WV 26506, USA
W. Stuart Neill
Institute for Chemical Process and Environmental Technology, National Research Council of Canada,
Ottawa, Ontario, Canada K1A 0R6
ABSTRACT
A study of n-heptane combustion in an HCCI engine was carried out by a multi-zone numerical simulation that covers a complete engine cycle. A reaction mechanism that includes 177 chemical species and 1638 reactions was used. The results of the numerical simulations were compared to existing experimental data for a range of air/fuel ratios, compression ratios and engine speeds.
It is shown that the numerical simulation is able to reasonably capture the experimental cylinder pressure data over a wide range of operation conditions. It also provides a qualitative trend of CO emissions. The numerical simulation overpredicted the combustion at some operating conditions, such as at extremely high air/fuel ratios and higher engine speeds.
Some differences were observed between the experimental and numerical data for NOX emissions. The numerical simulation predicted a monotonic decrease in NOX emissions as air/fuel ratio increased or compression ratio decreased, while an increase in NOX emissions was observed experimentally when combustion became very weak at extremely high air/fuel ratios or low compression ratios. It is suggested that further experiments and numerical simulations should be performed to explain this discrepancy.
INTRODUCTION
Since it was initially introduced about 30 years ago [1-3], Homogeneous Charge Compression Ignition (HCCI) engine technology has attracted the attention of many scientists and
engineers. Especially in recent years, more and more studies are being conducted for this advanced engine combustion concept due to its significant advantage in improving fuel efficiency and reducing pollutant emissions.
Combustion in engines under HCCI conditions may offer the opportunity to virtually eliminate NOX emissions from engine combustion. Meanwhile, since usually operated at extremely lean or highly diluted conditions, particulate matter (PM) emissions are also very low. The disadvantages of HCCI combustion are high carbon monoxide (CO) and unburned hydrocarbon emissions, along with high peak pressures and high rates of heat release [4]. It is of great importance to control the combustion of a HCCI engine so that the advantages can be maintained while the disadvantages are overcome as much as possible.
Similar to the study of other combustion processes, numerical simulation plays a significant role in the study of HCCI combustion. The modeling study of HCCI combustion can be classified to two categories: zone model and detailed complex Computational Fluid Dynamics (CFD) model. The former focuses on the detailed chemical kinetics process inside cylinder, but usually simplifies the treatment of fluid mechanics and heat transfer. In contrast, the latter pays more attention to the fluid mechanics and heat transfer processes while usually employs simplified/skeletal chemical mechanisms for kinetics process due to the significant computational cost. Since it has been well accepted that HCCI combustion is mainly controlled by chemical kinetics [3] and less affected by fluid mechanics
inside cylinder, more numerical studies on HCCI combustion have been conducted by zone model.
Zone model includes single-zone and multi-zone models. In a single-zone model, the entire cylinder is treated as a homogeneous reactor with a variable volume [3,5-7]. Therefore, the biggest advantage of single-zone model is that the computational cost is low. However, since it ignores the inhomogeneity in composition and temperature inside cylinder, the combustion duration is usually underestimated and peak pressure is overpredicted [6]. In addition, start of combustion cannot be correctly predicted at some extreme conditions, such as extremely lean and high Exhaust Gas Recirculation (EGR) conditions.
To take into account the inhomogeneity inside a cylinder, multi-zone model divides a cylinder into several zones, each of which has different composition and temperature. The interaction between zones exists due to exchanges of heat, mass and work. Various multi-zone models have been developed and applied based on different strategies to treat the exchanges of heat, mass and work among zones. Aceves et al. [8, 9] first used a multi-zone model for prediction of HCCI combustion and emissions. They assumed that there was no mixing, diffusion or heat transfer between zones. The only interaction between zones in this early model is work. The model did reasonable job at predicting peak pressure, burn duration and combustion efficiency. However, the predictions of CO and unburned hydrocarbon were not satisfied. Mehl et al. [10] recently developed a similar multi-zone model for HCCI combustion with detailed chemical kinetics. The model predicted reasonable profiles of temperature and species inside cylinder.
Easley et al. [11] developed a multi-zone model which accounted for not only the interaction due to work, but also the mass exchange between zones. Similar approach has also been employed by Ogink and Golovitchev [12,13].
The multi-zone model developed by Komninos et al. [14,15] accounted for both heat and mass exchange between zones. Similar strategies were employed by Kongsereeparp et al. [16] and Kongsereeparp and Checkel [17] in their multi-zone model.
Each of those previous multi-zone models has its advantages for the predictions of some parameters and may not be good enough for the predictions of other parameters. The selection of a strategy to build a multi-zone model depends on the purpose of the study and the computational cost allowed.
The purpose of this paper is to develop a multi-zone model to investigate the performance of a HCCI engine operated with n-heptane. The focus is on the performance of the multi-zone model in predicting the effects of various parameters on the engine operation. The details of the multi-zone model are described first, followed by the description of the studied engine. Then the results from simulation are compared against the existing experimental data, and finally some conclusions are drawn.
MODEL DESCRIPTION
We first describe the main assumptions for the model in this section. Then, the zone specification method is provided. The section ends with the descriptions of governing equations, various sub-models and the employed chemical mechanism.
Assumptions
The working fluid is assumed to be an ideal gas. The model simulates a full cycle of engine operation, starting from the top dead center (TDC) during the exhaust process and finishing at the same point after the processes of intake, compression, combustion and exhaust, i.e. from -360 degrees to 360 degrees ATDC. The pressure in cylinder is assumed to be uniform and only a function of time.
The gas exchange during the intake and exhaust processes is included in the model. However, a single-zone model is employed for the gas exchange processes (intake and exhaust). The multi-zone calculation starts from the intake valve closing (IVC) and finishes at the exhaust valve open (EVO). Such a combination of single- and multi-zone model simulation for the full circle of engine can provide a reasonable estimate of various parameters at IVC, while does not need significantly extra computational cost. Meanwhile the inhomogeneity inside cylinder is considered during compression, combustion and expansion processes.
The model assumes that the cylinder pressure at TDC (the starting point of the simulation) during the exhaust process equals the exhaust tank pressure which usually can be easily obtained from experiment. For every case, iteration calculation is conducted for the full engine circle. The composition and temperature from the previous iteration are used as the input for the next iteration. The simulation stops until the differences in composition and temperature between two consecutive iterations are smaller than specified values.
In previous studies, three kinds of strategies have been employed to deal with the interaction between zones. The first kind of strategy only considers the interaction due to work exchange [8-10], while the second kind takes into account both work and mass exchanges [11-13] between zones. The third kind of models accounts for the exchanges of work, mass and heat between zones [14-17]. It has been shown that the sole inclusion of work exchange in the model might cause significant error in the predictions of CO, unburned hydrocarbon and even pressure. The effect of mass exchange is negligible, but the effect of heat exchange is significant. Therefore, to simplify the calculation and obtain relatively reasonable prediction, the model in this paper accounts for the exchanges of work and heat between zones. The mass exchange between zones is neglected. As a result, the mass fraction of each zone is kept constant during the whole multi-zone simulation process.
The result from single-zone calculation for intake process provides pressure, mean composition and mean temperature inside cylinder at IVC. Then the multi-zone calculation starts by assuming a temperature distribution around the mean value
obtained from the single-zone calculation. Details of zone temperature specification will be discussed later. Mehl et al. [10] showed that the stratification of composition had negligible effect on calculation result. Therefore, the stratification of composition at IVC is neglected in the current model, i.e. assuming the composition of each zone is the same as that obtained from the single-zone calculation for intake process. The multi-zone calculation ends at EVO, followed by another single-zone calculation for the exhaust process until TDC is reached. The input for the single-zone calculation of the exhaust process is the mean result from multi-zone calculation at EVO.
Zone Specification
During the compression, combustion and expansion processes (from IVC to EVO), cylinder is divided into three types of zones: one crevice zone, one boundary zone, and six core zones. The crevice zone represents a fraction of gas trapped by all the crevices in the cylinder. It has been assumed that the mass in the crevice zone takes into account 2.5% of total mass in the cylinder. Boundary zone is the region around the cylinder wall. Heat transfer between cylinder and wall happens through this boundary zone due to convection. Other zones are core zones that are surrounded by boundary zone. Each core zone exchanges heat with its neighboring zones due to conduction and with cylinder wall due to radiation. The shape of boundary and core zones is cylindrical. In the current model, six core zones are used. The schematic shapes of zones are shown in Fig. 1.
Crevice zone (1) Boundary zone (2) Zone 3 Zone 4 Zone 5
Zone 6 Zone 7 Zone 8
Piston
Fig. 1 Schematic zone geometry.
Ogink and Golovitchev [13] indicated that chemical reaction never happens in crevice zone due to the large ratio of surface area to volume. Therefore, the model assumes that the temperature of crevice zone is always lower than or equal to cylinder wall temperature. The mass distribution in boundary and core zones is assumed to be a normal distribution, as shown in Fig. 2, where zone 1 represents crevice zone, zone 2 represents boundary zone and others represent core zones. Zone
5 is the middle zone which has the most mass inside cylinder and whose temperature is the average temperate at IVC.
Zone number 1 2 3 4 5 6 7 8 M a s s f ra c tion , % 0.0 5.0 10.0 15.0 20.0 25.0 30.0
Fig. 2 Mass distribution inside cylinder. Zone 1 is crevice zone, zone 2 is boundary zone, and others are core zones.
Temperature inhomogeneity is caused by the mixing between residual gas and intake gas. As Kongsereeparp et al. [17] indicated, colder gas usually appears near cylinder wall region while hotter gas exists in cylinder center region. The model assumes that at IVC, temperature is the lowest in the crevice and boundary zones (zone 1 and 2) and hottest in the cylinder center zone (zone 8). The temperature of middle zone (zone 5) is supposed to be the mean cylinder temperature which is obtained by the single-zone calculation during intake process. From zone 5 to zone 2, temperature evenly decreases from mean cylinder temperature to intake temperature. In contrast, temperature from zone 5 to zone 8 evenly increases from mean temperature to the highest temperature, with the temperature of zone 8 equalling 2Tmean Tintake, where Tmean and Tintake are the
mean temperature at IVC and the intake temperature, respectively. The temperature of crevice zone is assumed to be identical to the intake temperature.
Governing Equations
Conservation of Species Mass
Based on fundamental mass conservation law, species mass conservation can be described by:
, , , 1 ( ) JJ k i k i i j j i k i k k k j dY M me Y Y dt v (1)
where subscript i, k, and j represents species number, zone number and mass exchange port number (intake or exhaust), respectively. Y is species mass fraction, ω the formation rate (mole/cm3s) of a species, M the molecular weight (g/mole), ρ the density (g/cm3), v the volume of a zone, and me the mass flow rate (g/s) from a mass exchange port (intake or exhaust).
Conservation of Energy
Energy conservation equation of each zone can be obtained from the first law
k K
k
dQ dH dp v
dt dt dt (2a)
where Qk is the heat obtained by zone k due to heat exchange
with other zones and cylinder wall, Hk is the total enthalpy of
zone k, vk is the volume of zone k, and p is cylinder pressure.
The calculation of Qk will be discussed later.
Equation 2a can be re-written as:
1 2 , , 1 , , , 2 1 1 1 1 1 1 1 N N l l l l l KK KK l k i k i l k i k k k l k l k k p k i N N N k i i k l l i i k l l l l l l l l l l m dT m dM T M dt dt h dY M Y dT dQ RT dV R m T C dt m dt M dt M m V dt m M M m T T T M M M
(2)
where Tk/l is the temperature of zone k/l, subscript l inside
summation calculation represent zone number (similar to k), hk,i
is specific enthalpy of species i in zone k, R is universal gas constant, mk/l is the mass of zone k/l, N is total number of zone
(8 for multi-zone model in this paper), Cp,k,i is specific heat of
species i in zone k, Ml is the mean molecular weight of zone l,
and V is cylinder volume. Note that the ideal gas state equation
and the correlation , ,
1 KK k i k k k i i i Y H m h
M have been used for the
conversion from Eqs. 2a to 2.
Global Pressure Change
The rate of pressure change inside the cylinder can be obtained by differentiating the ideal gas state equation
2 1 1 N N k k k k k k k k k m dT m dM dp R p dV R T dt V M dt V dt V M dt (3)
Please note that Eqs. 1-3 also apply to single-zone model when N equals unity. Therefore, an entire engine cycle can be simulated using Eqs. 1-3, with N = 1 for intake and exhaust processes and N > 1 for compression, combustion and expansion processes. This set of equations is solved by an ODE solver [18]. Thermal properties and chemical reaction rates in these equations are calculated by the algorithms given in [19].
Heat Transfer Model
The quantity Qk in Eq. 2 represents heat obtained by zone
k. It consists of convective heat transfer to cylinder wall, heat
exchange with other zones due to conduction, and heat loss to cylinder wall due to radiation, i.e.
, , cond k r k k dQ dQ dQ dQc dt dt dt dt (4) where dQcond k, dt , , r k dQ dt and c dQ
dt are the heat exchange rates
due to conduction, radiation and convection, respectively, in zone k.
The convective heat transfer to cylinder wall only happens for the boundary zone. It is calculated by
( ) c h w b dQ A T T dt (4a)
where h is heat transfer coefficient, Tw and Tb are temperatures
of wall and boundary zone, respectively, and A is cylinder wall (including piston and cylinder top) area. The widely applied Woschni model [20] is used to calculate heat transfer coefficient
h.
Radiation heat loss of a zone is calculated by an optically thin model [21] , 4 4 4 ( ) r k k p w k dQ v k T T dt
(4b)
where σ is the Stefan Boltzmann constant, and kp is the Planck
mean absorption coefficient that is calculated by the method recommended by Tien [22], considering the radiating species: CO2, H2O and CO.
Heat exchange between a zone and its neighboring zones due to conduction is calculated by a method suggested by Komninos et al. [14]. Heat is conducted to zone k from zones
k+1 and k-1. The conduction heat flux obtained by zone k is
obtained by: , , ( 1/ 1 ) cond k cond k tot k k k dQ A K T T dt
(4c)
where Acond,k is the interface area between zone k and its
neighboring zone k+1/k-1, Ktot is the thermal conductivity,
thermal conductivity Ktot consists of laminar and turbulent
thermal conductivities, i.e.
tot l t
K K K (4d)
The laminar thermal conductivity Kl of each zone is
calculated by the algorithm given in [23] based on the composition and temperature. The turbulent thermal conductivity Kt is calculated by assuming that turbulent Prandtl
number equals the laminar Prandtl number. Therefore:
t
t l
l
K K
(4e)
where μt and μl are the turbulent and laminar dynamic
viscosities, respectively. Similarly, the laminar dynamic viscosity is calculated according to mixture composition by the algorithm described by Kee et al. [23]. Then the turbulent viscosity is obtained by [24]: 1 exp( 2 ) t n n l y y (4f) and * 0 n y n n w u y dy (4g)
where κ = 0.41 is the Karman constant, μw is the dynamic
viscosity at wall, u* is the friction velocity, and yn is the normal
distance from the wall. The quantity is a constant equal to 0.06. The friction velocity is supposed to be proportional to piston speed as:
*
p
u cV (4h)
where Vp is piston speed (cm/s), and c is a constant equal to
0.05 in this paper.
Gas Exchange
The gas exchange during intake and exhaust processes is calculated by a one-dimensional quasi-steady flow model [6, 25]. The intake and exhaust system pressures are taken from experimental data. Since the discharge coefficient is not known, it has been assumed to be unity in the current model. However, the flow area is calculated based on the three stages of valve lift [25].
Chemical Kinetics
The chemical kinetics of n-heptane combustion has been relatively extensively studied. Detailed and reduced mechanisms for combustion of n-heptane have been developed by various groups. This paper investigates the combustion of n-heptane in a HCCI engine by a multi-zone model. A reduced mechanism is preferred to decrease the computational cost. Two reduced mechanisms developed by Seiser et al. [26] and Golovichev [27] were tested.
It was found that the former includes more species and provides more reasonable qualitatively prediction for CO and pollutant emission. However, it predicts a later start of combustion and lower peak pressure. The reason may be that the mechanism in [26] was validated by a counterflow flame in which high temperature ignition dominates. Therefore, some features of low and intermediate temperature ignition might have been neglected. The mechanism developed by Golovichev [27] provides better prediction for the start of combustion and peak pressure. However, its capability to predict pollutant and CO emissions is relatively poor.
Therefore, the mechanism developed by Seiser et al. [26] has been selected as the primary mechanism. However, the rate data of several reactions for low and intermediate temperature ignition have been slightly modified based on those in the mechanism developed by Golovichev [27]. The reactions whose rates were modified include: NC7H16 + OH = C7H15-1 + H2O, NC7H16 + OH = C7H15-2 + H2O, NC7H16 + OH = C7H15-3 + H2O, NC7H16 + OH = C7H15-4 + H2O, OH + OH (+M) = H2O2 (+M).
The original mechanism in [26] does not include NOX chemistry, while that in [27] includes an over-simplified NOX chemistry that is not enough to provide reasonable prediction of NOX emission. Therefore, the NOX chemistry in the GRI Mech3.0 mechanism [28] was added to the above modified mechanism to model NOX emissions. The final mechanism used in this paper includes 177 species and 1638 reactions.
Cylinder Bore 82.55 mm
Stroke 114.3
Displacement Volume 611.7 cc Connection Road Length 254 mm
Compression Ratio 4.6 ~ 16 Combustion Hammer Pancake shape
Intake valve open Intake valve close Exhaust valve open Exhaust valve close
10 CA ATDC 34 CA ABDC 40 CA BBDC 5 CA ATDC Fuel System Air-assisted port fuel
injection
ENGINE DESCRIPTION
Our previous experimental data [7,29] obtained by a Co-operative Fuel Research (CFR) engine were used to validated the modeling results in this paper. This engine is a single-cylinder, variable compression ratio, four-stroke engine. Table 1 provides the basic specifications of the CFR engine. More details about the engine and data acquisition system can be found elsewhere [7,29].
RESULTS AND DISCUSSION
The multi-zone model developed above was used to investigate the effects of various parameters on the performance of a HCCI engine operated by n-heptane. The calculated results were compared to the data previously measured in our laboratory [7,29].
As described above, the inputs to the model include compression ratio, engine speed, exhaust pressure and parameters (pressure, temperature and composition) of intake mixture. The data from experiments [7] for these parameters have been used, with a slight adjustment for intake temperature. The intake temperature used in the model is 10K higher than that in experiments for all simulations at different operating conditions. The purpose of the adjustment is to match the position of peak pressure. It should be noted that this is the only adjustment in the simulation and should be acceptable given the uncertainty in experiments.
Effect of Air/Fuel Ratio
Similar to spark ignition and diesel engines, air/fuel ratio (AFR) is an important parameter to control the combustion of a HCCI engine. The effect of air/fuel ratio on the combustion of the HCCI engine was investigated first. Figure 3 shows the variation of pressure calculated by this paper and measured previously [7,27] at air/fuel ratios (mass based) of 45, 50 and 55, when other parameters are constant. It is observed that simulation successfully captured the experimental phenomena for all three air/fuel ratios. The start of combustion, the peak pressures and the positions of peak pressure were reasonably calculated. These imply that the multi-zone model developed in this paper is able to predict the primary phenomena of HCCI combustion using n-heptane.
Both simulation and experiment results demonstrate the well known two stage ignition phenomenon for n-heptane, i.e. the pressure experiences a first quick rise relative to the increase due to compression at about -10 degrees ATDC and then another quick rise until peak pressure is reached. As has been extensively discussed in the literature, the first quick pressure rise is due to the low temperature heat release (LTHR) and the second one is caused by the main combustion stage.
The experiment and simulation also show that decreasing air/fuel ratio advances the position of peak pressure and increases the peak pressure. This is because the air/fuel mixture
approaches stoichiometric conditions when the air/fuel ratio is decreased. Moreover, it is noted that the variation of air/fuel ratio causes more significant changes in peak pressure and its position, while has relatively less effect on low temperature heat release stage.
Crank angle, degrees
-60 -40 -20 0 20 40 60 P re s s u re , b a r 0 10 20 30 40 50 Measured, AFR45 Measured, AFR50 Measured, AFR55 Calculated, AFR45 Calculated, AFR50 Calculated, AFR55
Fig. 3 Effect of air/fuel ratio on HCCI combustion. Compression ratio (CR) = 10, intake temperature (Tintake) = 40 C, intake pressure (Pintake) = 95 kPa, exhaust tank pressure (Pexthaust) = 104 kPa, engine speed (n) = 900 RPM.
Figure 4 displays the variation of CO concentration in exhaust gas when air/fuel ratio changes. It is noted that although there is a difference between numerical and experimental results, they are qualitatively consistent. Both the experimental and simulation results demonstrate that when air/fuel ratio increases from about 33 to 50, CO emissions only slightly changes. However, with further increasing air/fuel ratio to higher values, CO emissions significantly increase. This is a result of incomplete combustion inside cylinder at extremely lean conditions. Air/fuel ratio 30 35 40 45 50 55 60 65 C O, p p m 0 5000 10000 15000 20000 Measured Calculated
Fig. 4 Effect of air/fuel ratio on CO emission. CR = 10, Tintake = 40 C, Pintake = 95 kPa, Pexthaust = 104 kPa, n = 900 RPM.
However, we also note from Fig. 4 that the measured CO emissions reaches its maximum at an air/fuel ratio of around 57, while the calculated keeps increasing until the maximum air/fuel ratio (about 63) in the simulation is reached. The experimentally observed decrease in CO emissions at extremely high air/fuel ratios is a result of failure of ignition and combustion inside cylinder. The difference between experimental and simulation data at those extremely high air/fuel ratios suggests that the current multi-zone model fails/overpredicts the lean limit of ignition/combustion in a HCCI engine using n-heptane. The numerical simulation was not conducted for cases with air/fuel ratio higher than 63, since the calculated cylinder pressure significantly oscillates at these conditions and it is hard to get a converged solution. Therefore, further improvement is needed in the future to reasonably predict CO emissions and lean limit of ignition/combustion.
Figure 5 shows the effect of air/fuel ratio on NOX emissions. It is found that the simulation captured the qualitative trend of experimental data when air/fuel ratio is smaller than 50, i.e. increasing air/fuel ratio leads to a decrease in NOX emission. However, when air/fuel ratio further increases from 50, the experiment showed a slight increase in NOX emissions, while simulation predicted a monotonic decrease.
AFR 30 35 40 45 50 55 60 65 NO X c on c en tr ation, pp m 0 50 100 150 200 Measured Calculated
Fig. 5 Effect of air/fuel ratio on NOX emission. CR = 10, Tintake = 40 C, Pintake = 95 kPa, Pexthaust = 104 kPa, n = 900 RPM.
It is not difficult to understand the mechanism of the decrease in NOX emissions with increasing air/fuel ratio when air/fuel ratio is smaller than 50. This is due to the decrease of temperature in cylinder when air/fuel ratio is increased. However, it is not clear what caused the slight increase in NOX emissions at higher air/fuel ratios during the experiment. Although it was suggested [29] that the slight increase in NOX emissions might be due to the significantly increased unburned hydrocarbon that caused the increase in the formation rate of NOX by the prompt route, the current simulation cannot confirm this. The predicted monotonic decrease of NOX emissions at higher air/fuel ratios is a result of the continuous temperature decrease with further increasing air/fuel ratio, which causes the decrease in NOX formation from all possible routes. The NOX
formation mechanism used in this paper [28] includes all the four possible NOX formation routes, i.e. the thermal route, the prompt route, the N2O and NNH intermediate routes [30]. The inconsistency between the experiment and simulation suggests that either the current understanding on NOX formation is not sufficient or the method used to measure NOX concentration in experiment is questionable under lean conditions. Therefore, further study is needed in the future for NOX emissions at extremely high air/fuel ratio conditions from both experimental and simulation.
Effect of Compression Ratio
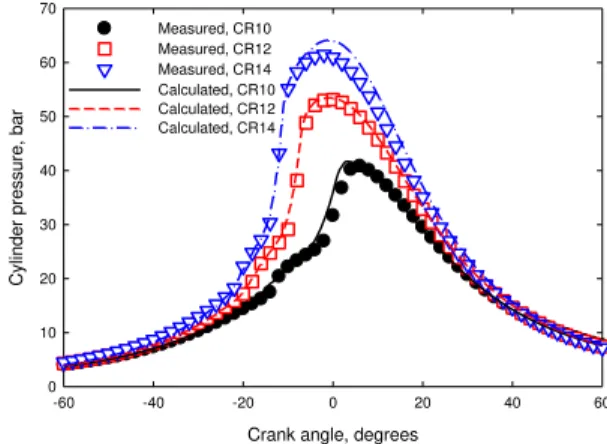
Figure 6 displays the calculated and measured variations of cylinder pressure at three compression ratios. It shows that the calculated and measured data agree well for three compression ratios. The increase in compression ratio increases the peak pressure and advances the position of peak pressure. This is because a higher compression ratio causes higher compression temperature and pressure, which in turn shortens the ignition delay and intensifies combustion process inside cylinder. The fact that the three pressure curves in Fig. 6 start to deviate at earlier compression stage (starting from about -50 CA) than those in Fig. 3 clearly shows this.
Crank angle, degrees
-60 -40 -20 0 20 40 60 C y lin d e r p re s s u re , b a r 0 10 20 30 40 50 60 70 Measured, CR10 Measured, CR12 Measured, CR14 Calculated, CR10 Calculated, CR12 Calculated, CR14
Fig. 6 Effect of compression ratio. AFR = 50, Tintake = 40 C, Pintake = 95 kPa, Pexthaust = 104 kPa, n = 900 RPM.
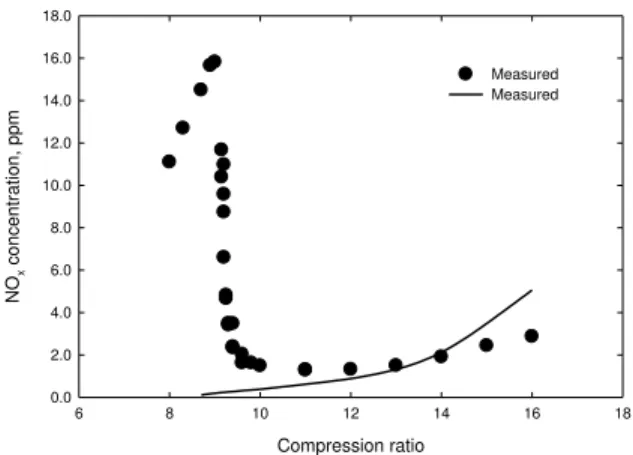
Figure 7 displays the variation of NOX emissions when compression ratio changes. It is noted that there is some difference between experimental and simulation results. The experimental result shows that NOX emissions first decreases, then quickly increases and finally decreases again with decreasing compression ratio. In contrast, simulation shows a monotonic decrease in NOX emissions with decreasing compression ratio.
As has been indicated above, decreasing compression ratio reduces the combustion inside cylinder. Therefore, both simulation and experimental results show a decrease in NOX emissions when compression ratio decreases from 16 to 11.
Compression ratio 6 8 10 12 14 16 18 NO x c oncentration, ppm 0.0 2.0 4.0 6.0 8.0 10.0 12.0 14.0 16.0 18.0 Measured Measured
Fig. 7 Effect of compression ratio on NOX emission. AFR = 50, Tintake = 40 C, Pintake = 95 kPa, Pexthaust = 104 kPa, n = 900 RPM.
However, it is not clear why NOX emissions increased in experiment when the compression ratio decreased from 11 to lower values, since combustion intensity inside cylinder became weaker for lower compression ratio cases, as shown in Fig. 6. This inconsistency between experimental and numerical data is similar to that observed above for higher air/fuel ratio cases, suggesting that further study is needed for the cases at extreme conditions when combustion intensity is relatively weak or near misfire. Crank angle -60 -40 -20 0 20 40 60 Pr es s ur e, ba r 0 10 20 30 40 50 Measured, RPM600 Measured, RPM900 Measured, RPM1200 Measured, RPM1400 Calculated, RPM600 Calculated, RPM900 Calculated, RPM1200 Calculated, RPM1400
Fig. 8 Effect of engine speed. AFR = 50, Tintake = 40 C, Pintake = 95 kPa, Pexthaust = 104 kPa, CR = 10.
Effect of Engine Speed
Figure 8 shows the measured and calculated variation of cylinder pressure when engine speed is increased from 600 to 1400 rpm. It is found that the calculated and measured data agree well until an engine speed of 1200 rpm is reached. At an engine speed of 1400 rpm, simulation overpredicted the cylinder peak pressure. We have noted from experiment that at the engine speed of 1400 rpm and other parameters investigated, engine is near a condition at which ignition and
combustion fail. Therefore, the overprediction of peak pressure at the engine speed of 1400 rpm suggests that current multi-zone model overpredicts the combustion intensity at some extreme conditions. This is similar to the failure of the model at extremely high air/fuel ratio conditions.
Both experiments and the numerical simulation show that increasing engine speed causes the decrease in peak pressure and the delay in the position of peak pressure. Relatively, the effect of engine speed on low temperature heat release stage is weak.
The effect of engine speed on the combustion of a HCCI engine could be caused by two possible factors. Firstly, the increase in engine speed intensifies the heat transfer to cylinder wall and thus increases heat loss. In addition, the increase in engine speed also results in the decrease in residence time of mixture inside cylinder, which may also lead to the delay of ignition and weaken the combustion process.
CONCLUSIONS
A multi-zone model for HCCI combustion has been developed and used to simulate n-heptane combustion in an HCCI engine. The numerical simulations were compared with previous experimental data collected over a wide range of air/fuel ratios, compression ratios and engine speeds. The multi-zone model was able to reasonably capture the experimentally-measured cylinder pressure variations over a range of operation conditions. It also provided qualitative trends of CO emissions. The numerical simulation overpredicted the combustion completeness at extremely high air/fuel ratios and higher engine speeds.
As for the prediction of NOX emissions, the model predicted a monotonic decrease in NOX emissions, when air/fuel ratio increased or compression ratio decreased. However, the previous experiment observed an increase in NOX emissions when combustion became very weak at extremely high air/fuel ratio or low compression ratio conditions. It is not clear what caused the difference between experiment and simulation in NOX emission, although various possible NOX formation mechanisms have been included in the chemical mechanism employed. It is suggested that further study on NOX emissions is needed in the future from both experiment and simulation sides.
REFERENCES:
1. Noguchi, M., Tanaka, Y., Tanaka, T., and Takeuchi, Y., “A study on gasoline engine Combustion by Observation of Intermediate Reactive Products during Combustion”, SAE paper 79-0840, 1979.
2. Onishi, S., Jo, S.H., Shoda, K., Jo, P.D., and Kato, S., Active thermo-atmosphere combustion (ATAC) - a new combustion process for internal combustion engines”, SAE paper 79-0501, 1979.
3. Najt, P.M., and Foster, D.E., “Compression ignited homogeneous charge combustion”, SAE paper 83-0264, 1983.
4. Westbrook, C.K., “Chemical kinetics of hydrocarbon ignition in practical combustion systems”, Proc. Comb. Inst. 28 (2000) 1563-1577.
5. Aceves, S.M., Smith, J.R., Westbrook, C.K., Pitz, W.J., “Compression Ratio effect on methane HCCI combustion”, Journal of Engineering for Gas Turbines and Power 121 (1999) 569-574.
6. Fiveland, S.B., Assanis, D.N., “A four-stroke homogeneous charge comp ression ignition engine simulation for combustion and performance studies”, SAE paper 2000-01-0332.
7. Li, H., Guo, H., Neill, W.S., and Taylor, J.D., “An experimental and modeling study of HCCI combustion using n-heptane”, Journal of Engineering for Gas Turbines and Power (2009, in press).
8. Aceves, S.M., Flowers, D.L., Westbrook, C.K., Smith, J.R., Pitz, W., Robert Dibble, R., Christensen, M., and Johansson, B., “A Multi-Zone Model for Prediction of HCCI Combustion and Emissions”, SAE paper 2000-01-0327, 2000.
9. Aceves, S.M., Martinez-Frias, J., Flowers, D.L., Smith, J.R., Dibble, R.W., Wright, J.F., Hessel, R.P., “A decoupled model of detailed fluid mechanics followed by detailed chemical kinetics for prediction of iso-octane HCCI combustion”, SAE paper 2001-01-3612.
10. Mehl, M., Tardani, A., Faravelli, T., Ranzi, E., D’ Errico, G., Lucchini, T., onorati, A., Miller, D., Cernansky, N., “A multizone approach to the detailed kinetic modeling of HCCI combustion”, SAE paper 2007-24-0086.
11. Easley, W.L., Agarwal A., and Lavoie, G.A., “Modeling of HCCI combustion and emissions using detailed chemistry”, SAE paper 2001-01-1029. 12. Fiveland, S.B., and Assanis, D.N., “Development of a
two-zone HCCI combustion model accounting for boundary layer effects”, SAE paper 2001-01-1028. 13. Ogink, R., and Golovitchev, V., “Gasoline HCCI
modeling: an engine cycle simulation code with a multi-zone combustion model” SAE paper 2002-01-1745.
14. Komninos, N.P., Hountalas, D.T., and Kouremenos, D.A., “Development of a new multi-zone model for the description of physical processes in HCCI engines”, SAE paper 2004-01-0562.
15. Komninos, N.P., Hountalas, D.T., and Kouremenos, D.A., “Description of in-cylinder combustion processes in HCCI engines using a multi-zone model”. SAE paper 2005-01-0171.
16. Kongsereeparp, P., Kashani, B., and Checkel, D., “A stand-alone multi-zone model for combustion in HCCI engines”, ASME Internal Combustion Engine Division
2005 Fall Technical Conference, paper number ICEF2005-1241, Ottawa, Canada, 2005.
17. Kongsereeparp, P., and Checkel, D., “Novel method of setting initial conditions for multi-zone HCCI combustion modeling”, SAE paper 2007-01-0674. 18. P. N. Brown, G. D. Byrne, and A. C. Hindmarsh,
“VODE: A Variable Coefficient ODE Solver”, SIAM J. Sci. Stat. Comput., 10 (1989), pp. 1038-1051. 19. R.J. Kee., J.A. Miller, T.H. Jefferson, A
General-Purpose, Problem-Independent, Transportable, Fortran Chemical Kinetics Code Package, Report No. SAND 80-8003, Sandia National Laboratories, 1980.
20. Woschni, G., “A universally applicable equation for the instaneous heat transfer coefficient in the internal combustion engine”, SAE paper 670931, 1967. 21. Guo, H., Ju, Y., Maruta, K., Niioka, T., Liu, F.,
“Radiation Extinction Limit of Counterflow Premixed Fuel-Lean Methane-Air Flame”, Combust. Flame 109 (1997) 639-646.
22. Tien, C. L., “Thermal radiation properties of gases”, Adv. Heat Transfer 5, 253-324, 1968.
23. R.J. Kee., J. Warnatz, J.A. Miller, A Fortran Computer Code Package for the Evaluation of Gas-Phase Viscosities, Conductivities, and Diffusion Coefficients, Report No. SAND 83-8209, Sandia National Laboratories, 1983.
24. Yang, J., Martin, J.K., “Approximate solution – one-dimensional energy equation for transient, compressible, low Mach number turbulent boundary layer flows”, Journal of Heat Transfer 111 (1989) 619-624.
25. Heywood, J.B., Internal Combustion Engine Fundamentals (p.226), McGraw-Hill, 1988.
26. Seiser, H., Pitsch, H., Seshadri, H., Pitz, W.J., and Curran, H.J., “Extinction and autoignition of n-heptane in counterflow configuration”, Proc. Comb. Inst. 28
(2000) 2029-2037.
27. Golovichev, V.,
http://www.tfd.chalmers.se/~valeri/MECH.html.
28. Smith, G.P., Golden, D.M., Frenklach, M., Moriarty, N.W., Eiteneer, B., Goldenberg, M., Bowman, C.T., Hanson, R.K., Song, S., Gardiner, W.C., Jr., Lissianski,
V.V., and Qin, Z.,
http://www.me.berkeley.edu/gri_mech/.
29. Li, H., Neill, W.S., Guo, H., Chippior, W., “The NOx and N2O emission characteristics of HCCI engine operated with n-heptane”, ASME Internal Combustion Engine Division 2007 Fall Technical Conference, paper No. ICEF2007-1758, October 14~17, 2007, Charleston, SC, USA.
30. Guo, H., Smallwood, G. J., Liu, F., Ju, Y., and Gülder, Ö.L., “The Effect of Hydrogen Addition on Flammability Limit and NOx Emissions in Ultra Lean Counterflow CH4/Air Premixed Flames”, Proc. Comb. Inst. 30 (2005) 303-311.