Publisher’s version / Version de l'éditeur:
Building Research and Information, 36, March 2, pp. 159-174, 2008-03-01
READ THESE TERMS AND CONDITIONS CAREFULLY BEFORE USING THIS WEBSITE.
https://nrc-publications.canada.ca/eng/copyright
Vous avez des questions? Nous pouvons vous aider. Pour communiquer directement avec un auteur, consultez la première page de la revue dans laquelle son article a été publié afin de trouver ses coordonnées. Si vous n’arrivez pas à les repérer, communiquez avec nous à [email protected].
Questions? Contact the NRC Publications Archive team at
[email protected]. If you wish to email the authors directly, please see the first page of the publication for their contact information.
NRC Publications Archive
Archives des publications du CNRC
This publication could be one of several versions: author’s original, accepted manuscript or the publisher’s version. / La version de cette publication peut être l’une des suivantes : la version prépublication de l’auteur, la version acceptée du manuscrit ou la version de l’éditeur.
For the publisher’s version, please access the DOI link below./ Pour consulter la version de l’éditeur, utilisez le lien DOI ci-dessous.
https://doi.org/10.1080/09613210701549748
Access and use of this website and the material on it are subject to the Terms and Conditions set forth at
Current daylighting design practice: a survey
Galasiu, A. D.; Reinhart, C. F.
https://publications-cnrc.canada.ca/fra/droits
L’accès à ce site Web et l’utilisation de son contenu sont assujettis aux conditions présentées dans le site LISEZ CES CONDITIONS ATTENTIVEMENT AVANT D’UTILISER CE SITE WEB.
NRC Publications Record / Notice d'Archives des publications de CNRC:
https://nrc-publications.canada.ca/eng/view/object/?id=e0834163-b362-45b9-9910-e00b9a842018 https://publications-cnrc.canada.ca/fra/voir/objet/?id=e0834163-b362-45b9-9910-e00b9a842018
http://irc.nrc-cnrc.gc.ca
C u r r e n t d a y l i g h t i n g d e s i g n p r a c t i c e : a s u r v e y
N R C C - 4 9 4 6 0
G a l a s i u , A . D . ; R e i n h a r t , C . F .
A version of this document is published in / Une version de ce document se trouve dans: Building Research & Information, v. 36, no. 2, March 2008, pp. 159-174 doi:
10.1080/09613210701549748
The material in this document is covered by the provisions of the Copyright Act, by Canadian laws, policies, regulations and international agreements. Such provisions serve to identify the information source and, in specific instances, to prohibit reproduction of materials without written permission. For more information visit http://laws.justice.gc.ca/en/showtdm/cs/C-42
Les renseignements dans ce document sont protégés par la Loi sur le droit d'auteur, par les lois, les politiques et les règlements du Canada et des accords internationaux. Ces dispositions permettent d'identifier la source de l'information et, dans certains cas, d'interdire la copie de documents sans permission écrite. Pour obtenir de plus amples renseignements : http://lois.justice.gc.ca/fr/showtdm/cs/C-42
Current Daylighting Design Practice: A Survey
Anca D. Galasiu, Christoph F. Reinhart
Anca D. Galasiu (corresponding author)
Tel: +1 (613) 993-9670
E-mail: [email protected] National Research Council Canada Institute for Research in Construction Indoor Environment Program
Building M-24, 1200 Montreal Road Ottawa, ON, Canada, K1A 0R6
Christoph F. Reinhart
Tel: +1 (613) 993-9703
E-mail: christoph.reinhart @nrc-cnrc.gc.ca National Research Council Canada Institute for Research in Construction Indoor Environment Program
Building M-24, 1200 Montreal Road Ottawa, ON, Canada, K1A 0R6
Current Daylighting Design Practice: A Survey (Word count: ~8500)
Abstract
This paper presents the results of an online survey that examined current daylighting design practices among design teams with an explicit interest in sustainable design. The goal of the survey was to: (1) understand which daylight performance indicators and design tools are currently used by design practitioners to integrate daylighting in their projects; (2) identify the additional information needed beyond that available in current design guides; and (3) advise on the content and format of a new daylighting design guide that addresses these needs.
The responses obtained from 177 participants showed that over 90% of the practitioners surveyed support the development of a new daylighting design guide that would provide online access to both simple calculation methods as well as more advanced daylighting design tools. Survey results also showed that a variety of non-standardized daylight prediction methods – primarily rules of thumb – are currently being used, and that there is no commonly acknowledged method of how to assess the performance and quality of a daylighting system in terms of energy savings, glare prevention, daylight factors, and view to the outside.
Keywords: daylighting, daylighting design guide, daylighting survey, daylighting
metrics, daylighting performance indicators.
1. Introduction
‘Well daylit’ is a desired design attribute for just about any contemporary, new commercial building. Given that the interaction of (day)light and building form is a key contributor to the aesthetic experience of a space, one is actually unlikely to find
a designer who explicitly does not desire to consider daylighting. Enhanced occupant satisfaction and lighting energy savings are among the widely touted benefits of daylighting, which makes it an attractive design feature for building occupants and operators alike (Guzowski, 1999). Despite, or maybe because, of these wide ranging potential benefits of daylighting, there is no widely accepted comprehensive system of metrics available that defines good daylighting. Green building rating systems
such as LEED1 (US Green Building Council, 2006) currently express the attributes
and characteristics of daylighting in terms of a building’s daylight factor distribution (LEED-NC 2.1) or glazing factor distribution (LEED-NC 2.2), and view-to-the-outside. Climate-based daylighting metrics have been suggested as an alternative to these conventional daylighting metrics (Reinhart et al., 2006) and one of these metrics, the daylight saturation percentage, has been included into the CHPS (Collaborative for High Performance Schools, 2007) and the LEED for Schools (US Green Building Council, 2007) rating systems. In spite of these advances, the discussion within the scientific community as to which metric and benchmarks to use is likely to continue for a number of years. This discussion will hopefully result in a set of coherent daylighting metrics that measure the various daylit qualities of a space. Until that day, however, building design teams have to work with the variety of design tools that are available today (design guides, simulation programs, and rules-of-thumb).
This paper provides an overview of these design tools and a snapshot of current daylighting design practices, primarily in the United States, Australia, and Canada, based on an online survey that examined how daylighting related issues are currently addressed in design practice. The survey, whose main focus audience
1
LEED stands for Leadership in Energy and Environmental Design and is a green building rating system promoted through the Canadian and US Green Building Councils.
comprised design practitioners already involved in “green” building projects, was part of a larger effort to develop a new online daylighting design guide that will help design practitioners with an interest in daylighting and sustainable design, but no expert knowledge of daylighting concepts and technologies, to effectively implement daylighting in their projects. The survey results may equally be of interest to building design practitioners who are interested in what their peers are doing, as well as to other researchers working on comparable design guidelines for the construction and design industry.
This survey builds on a prior survey conducted in 2004 by the second author, which specifically investigated the use of computer simulation tools for daylighting design (Reinhart and Fitz, 2006). The earlier survey identified which daylighting design software packages were typically used internationally, which simulation outputs were routinely calculated, and how the simulation results were used to influence design decisions. The responses from 193 participants revealed a strong bias towards Radiance-based simulation tools with over 50% of the simulation software used by the participants incorporating it (Ward and Shakespeare 1998). The survey further showed that while daylight factors and interior illuminance were the most commonly calculated simulation outputs, the type and control of shading devices was the design aspect most frequently influenced by the daylighting analysis. This finding was somewhat surprising since there is no commonly accepted method that describes how to use either daylight factors or illuminance levels to determine the effectiveness of shading devices (especially movable ones such as Venetian blinds). The survey also showed that ‘experience from previous work’ and ‘rules-of-thumb’ were the daylighting assessment tools most widely used during the schematic design phase. The rules-of-thumb quoted by the participants were
non-standardized and seemed to be ‘home made’ with little reference to existing design guides. The 2004 survey also included a literature review of earlier surveys on the use of building simulation tools. The review covered the period between 1985 to 2004 and complements the current work.
The 2004 survey indicated that computer simulations represent only one component of the daylighting design process, which tends to be invoked at later design stages. The present survey was designed to learn more about general daylighting design practices. While the previous survey targeted simulation experts (participants had mainly been recruited through building simulation mailing lists), the focus audience for the present survey was widened to include design teams with an interest in sustainability. As described below, the questionnaire was more broadly phrased and placed less emphasis on computer simulations. The specific objectives of the new survey were to:
• understand which daylight performance indicators, rules-of-thumb, and design tools practitioners currently use to integrate daylighting;
• identify which additional information is needed by design practitioners with an interest in daylighting, beyond that available in the current generation of design guides;
• propose the content and format of a new daylighting design guide that addresses the above needs.
2. Methodology
The survey was administered from June 1 to July 21st 2005. Because the
design, the primary focus group consisted of design professionals who routinely use LEED or other sustainable building design rating systems. Survey participants were recruited via e-mail through personal contacts, and professional and interest-groups mailing lists. Specific email invitations were sent to:
• Members of the US and Canadian Green Building Councils;
• Newsletters of the Royal Canadian Institute of Architecture and the American Institute of Architects;
• e-bulletin announcements to the Ontario Association of Architects; • Big Green forum ([email protected]);
• Selected schools of architecture;
• Radiance Online and Building Simulation mailing lists.
The survey was developed and administered using an Oracle database
located on an NRC2 web server. Similar to the 2004 survey, data was collected
using a branched questionnaire, as an effective and inexpensive way to reach a large audience, engage the participants in “conversations” through frequent open-text boxes where they could provide information beyond predefined answers, and present the participants with follow-up questions depending on their answers (e.g. a participant would be asked which design guide he or she used only if design guides was among the list of daylighting tools previously chosen by the participant).
The e-mail invitations included general information about the content of the survey and the rights of the participants, and those who agreed to participate were directed to the survey’s website. The only incentive offered to individuals for
2
participating was the opportunity “to influence the development of a daylighting design guide that will better address their needs”.
The survey questions were geared toward gathering information related to: • General attitudes towards daylighting in buildings;
• The building types participants considered as having the largest daylighting energy saving potential;
• The type of analysis tools they used for daylighting design; • The performance metrics and design criteria they applied;
• The building design choices that were directly affected by their daylighting analysis;
• The commissioning procedures they used to implement their daylighting designs; • The most appropriate format of a daylighting design guide that would best suit
their needs.
Once the individuals consented to participate in the survey, the questionnaire began with general inquiries concerning the participants’ profession, types of projects they worked on, and the country in which these projects were located. The participants were also asked which commercial building spaces were the most relevant to their work, and which they considered as having the largest daylighting potential in terms of energy savings and technical ease for implementation.
Then, survey branching separated those participants who considered daylighting in their designs from those who did not, as shown in Figure 1. For the latter, the next question was geared towards understanding the reasons for not considering daylighting.
• How much time they dedicated usually to daylighting design on any given project and how they assessed the overall quality and performance of their designs; • Which daylight prediction tools they routinely used to implement daylighting; • Which building design aspects were affected by their daylighting analyses; • Which type of shading and lighting controls they specified in daylighting projects.
A series of questions that followed aimed at understanding how design decisions are routinely being made by design practitioners:
• Who did the participants think mostly influenced daylight-related design decisions;
• Which barriers to daylighting they mostly encountered;
• How did they ensure that their daylighting designs were properly implemented and commissioned during and after construction;
• Which were the main challenges when commissioning a daylighting project. At the end of the survey the participants were invited to express their opinion on what they thought was missing in current daylighting design guides and the format for a guide that would be most useful to them. Depending on the answers given, the questionnaire varied in length from 14 to 35 questions. To answer the questions, the participants were presented with both predefined answers and open-text fields, and for most questions they could either select more than one item, or continue to the next question without answering.
Figure 1: Overview of the survey flow. Participants followed one of the 2 main branches depending on whether they considered daylighting in their design or not. The numbers in the rectangular boxes correspond to the number of participants who went through a particular survey branch.
3. Survey results
A total of 177 individuals completed the survey. Of those, 158 (89%) implemented daylighting in their designs.
3.1 Participants’ background
Table 1 shows the professions participants selected out of the 8 occupations they were presented with. Participants could select more than one occupation and 63 of them selected two or more. In order to detect potential variations in the responses based on occupational differences, participants were grouped into three main professional groups: designers, engineers, and researchers. The designers
group includes the individuals who selected architects, lighting designers and interior
designer as their main occupation, and represents 44% of the total number of survey participants. The engineers group includes the individuals who chose energy consultants and engineers, and represents 27% of the sample. The researchers
group represents 18% of the sample. When a participant selected two or more
occupations that fell under two different professional groups, the grouping followed this order: researcher, engineer, designer (e.g., if both researcher and engineer were selected, the person was placed in the researchers group; if both engineer and designer were selected, the person was placed in the engineers group, etc.). Seventeen participants did not fall into any of the three professional groups, selecting either manufacturer or other as their only occupation. Three did not answer the question.
Table 1: Professions of participants*.
Profession No. of selections Professional Group No. of participants
Architect 85
Lighting designer 23 Designers 78 (44%)
Interior designer 6
Energy consultant 34 Engineers 48 (27%)
Engineer 49 Researcher 31 Researchers 31 (18%) Manufacturer 8 Other 20 (11%) Other 28
*Because some participants selected more that one profession, the numbers in the profession table (left) do not add up to the numbers in the professional group table (right); See text for grouping criteria.
Participants indicated that their projects were located in 26 countries around the globe: 28% in the USA, 24% in Australia, 19% in Canada, and 29% in another 23 countries (e.g., Germany, Great Britain and Italy, each 3%; China and Denmark, each 2%, etc.).
Out of the 96 participants from Canada and the United States, 48% were LEED accredited professionals, 26% were planning to get LEED accredited in the near future, and 14% said that they were not LEED accredited but used LEED as a tool during project design. This strong bias towards LEED among North American participants was in line with the desired focus group for the survey.
Figures 2 and 3 show that the participants mostly worked on small and large office buildings (31%) and educational facilities (16%), and that the spaces most
relevant to their work (rated as either 1st or 2nd priority) were open plan offices (67%)
Other 5%
Warehouse 5% Hospital and extended
care 9% Hotel 5% Educational facilities 16% Residential, multi-unit 12% Residential, small 9% Retail 8% Office, small 16% Office, large 15%
What type of projects do you mostly work on?
Figure 2: Building types participants mostly worked on.
0 20 40 60 80 100 open plan office classrooms conference rooms
atrium retail space circulation
area (aisle; staircases)
private office other hospital
ward
Percentage of participants who selected this option [%
]
1st priority (174) 2nd priority (174) Which commercial building spaces are the most relevant to your work?
Figure 3: Building spaces participants rated as being the most relevant to their work. The numbers in brackets indicate the total number of participants who answered the question. The figure shows that 67% of all 174 participants selected open-plan offices to be either their 1st or 2nd work priority , followed by 46% who reported working on classrooms/conference rooms.
When asked which commercial/industrial building spaces they thought as having the largest daylighting potential in terms of energy savings and technical ease
for implementation, open plan offices were again the front-runner receiving either 1st
and 2nd priority from 72% of the participants, followed by classrooms/conference
rooms (44%), atrium spaces (25%), retail spaces (18%), circulation areas (17%), and private offices (13%). 0 20 40 60 80 100 open plan office classrooms conference rooms
atrium retail space circulation area (aisle; staircases) private office other hospital ward
Percentage of participants who selected this option [%
]
1st priority (174) 2nd priority (173) Which commercial/ industrial building spaces do you think have the largest daylighting potential in term of energy savings and technical ease for implementation?
Figure 4: Building spaces participants rated as having the largest daylighting potential. The numbers in brackets indicate the total number of participants who answered the question.
3.2 Participants’ general approach to daylighting
In order to better understand the participants general approach to daylighting, they were asked to select from five definitions of daylighting (see Table 2) the one which they considered to be the most relevant to them (participants could not see the definition titles). As shown in Figure 5, the engineers were generally more inclined to describe daylighting in regards to its energy-saving potential and cost, whereas the designers gravitated towards the aesthetic aspects of daylighting along with the
benefits for the building occupants. This choice is not surprising giving the two professions varying roles within the design process. Out of a total of 172 participants who answered this question, only three chose the load management definition (two designers and one researcher).
Table 2: Five sample definitions of daylighting3.
Architectural definition: the interplay of natural light and building form to provide a visually stimulating, healthful, and productive interior environment
Lighting Energy Savings definition: the replacement of indoor electric illumination needs by daylight, resulting in reduced annual energy consumption for lighting
Building Energy Consumption definition: the use of fenestration systems and responsive electric lighting controls to reduce overall building energy requirements (heating, cooling, lighting)
Load Management definition: dynamic control of fenestration and lighting to manage and control building peak electric demand and load shape
Cost definition: the use of daylighting strategies to minimize operating costs and maximize output, sales, or productivity 0 20 40 60 80 100
Architectural Building energy
consumption
Cost Lighting energy
savings Load management Perc entage of partic ipants who s elec ted this option [%] Designers (76) Engineers (48) Which of the following definitions for daylighting is the most relevant to you?
Figure 5: General approach to daylighting based on professional group. The numbers in brackets indicate the total number of participants who answered the question. Data relating to researchers are not reported here because, in this case, the authors were particularly interested in the opinion of
practicing design professionals, who represent the focus audience for the new daylighting design guide.
3
Provided by Stephen Selkowitz of US Lawrence Berkeley National Laboratory, Building Technologies Department
3.3 Participants who did not include daylighting aspects in their building design
At the main survey branching, 158 participants (89% of the participants, 28 researchers, 44 engineers, 73 designers) indicated that they did include daylighting aspects in their building design. The remaining 19 participants who did not consider daylighting explained this to be mostly due to not knowing which tools to use (6 participants), followed by not knowing where to get training (5 participants). Other reasons stated by these survey participants were: client does not pay for it (4 participants); daylighting is not appropriate for the location or building type (4 participants); and don’t know where to get specific information (3 participants).
3.4 Participants who included daylighting aspects in their building design
3.4.1 Daylight prediction tools
Those participants who implemented daylighting in their designs were asked what daylight prediction tools they routinely used during the schematic design and the design development phases. Figure 6 shows the participants’ selections ordered by professional group. For each professional group and prediction tool two values are shown reflecting percentages of use during schematic design and design development. The figure reveals that ‘experience from previous work’ and ‘computer simulations’ were the overall prediction methods of choice, followed by ‘rules-of-thumb’ and ‘design guidelines’. Computer simulations were used by 75% of the 158 participants who considered daylighting. This value compares well with the responses obtained during the 2004 survey, where 79% of 169 individuals said that they regularly used simulation tools. While this strong trend towards computer simulations might seem high, it should be noted that 88% of the North American
participants reported using LEED in some form and LEED explicitly requires the use of energy simulations under the Energy and Atmosphere section.
Occupational differences also followed the trend found in the 2004 survey, revealing again a strong tendency among researchers and engineers to use simulations while designers relied more heavily on experience from previous work and rules-of-thumb than the other two groups. Figure 6 also reveals a low overall use of manufacturer information and scale model measurements. It seems to be mostly researchers that are still using the latter.
This survey also replicates the differences between schematic design and design development found in the 2004 survey. A star (*) in Figure 6 above a pair of
columns indicates that according to the Chi2 test, the responses for schematic
design and design development are significantly different (p<0.05). All three professional groups were more likely to use computer simulations during later design
stages (designers Х2(1)=4.04, engineers Х2(1)=8.19, researchers Х2(1)=6.72). The
data also shows that trust in rules-of-thumb (designers Х2(1)=7.94, engineers
Х2
(1)=11.21, researchers Х2(1)=7.18), as well as in the experience gained from
previous work (designers Х2(1)=6.12, engineers Х2(1)=2.92, researchers Х2(1)=5.98)
fell during the design development stage for all three professional groups, marking the time when all three groups would turn to computer simulations.
0 20 40 60 80 100 Experience Computer simulation
Rules of thumb Design guidelines Manufacturer
information
Scale model measurements
Percentage of participants who use the tool [%
] Designers (73) Engineers (44) Researchers (28) S c hmatic Design Design Development * * * * * * *
What kind of daylight prediction tools do you use to implement daylight into your design decision during: (a) schematic design; (b) design development?
* *
Figure 6: Percentage of survey participants who use each design tool ordered by professional group. The two columns for each professional group within each category indicate the responses for schematic design phase and design development phase. Value pairs that are marked with a ( * ) are significantly different (Chi2 test p<0.05).
The 25% of the sample of participants who did not use computer simulations at all indicated reasons such as clients not paying for simulations, experiencing difficulties in getting the information of where to start, or could not justify the long training periods required. Issues related to the reliability of computer tools or to their inability to meet the practitioner’s needs were raised by less than 5% of these participants.
Depending on their choice of daylight prediction tools, the participants were invited to provide more specific information about each of the design tools they used, as follows:
• Rules-of-thumb: 93 participants (59% of the sample) said that they used rules-of-thumb during schematic design, and 83 participants (53% of the sample) used them
during design development. The free text answers showed that a number of non-standardized, self-made rules-of-thumb are being used for a large variety of design aspects, quoting various desired ratios of window-to-wall area, window head height to floor area, skylights to roof or floor area, view-window to daylight-window area as well as general comments regarding the façade orientation, glazing type, shading devices, and the effectiveness of lighting controls.
• Daylighting design guides: design guidelines were used by 66 participants (42% of the sample), who were further asked to select the names of the guides they commonly used. Participants could choose from a list of twelve popular guides or manually enter other guides if desired. A total of 176 guide selections were made. As expected, the selection was greatly influenced by the country in which the individuals worked. Canadian and American participants gravitated towards the LEED - Daylighting Credits (US Green Building Council, 2005), the IESNA - Lighting Handbook (IESNA Lighting Handbook, 2000) and the LBNL Tips for Daylighting (O'Connor et al., 1997). Again, the high number of individuals using LEED as a design criteria for daylighting (37 selections in total; 32 coming from North-Americans) is not surprising considering the survey sample. Canadians also used the Canadian Tips for Daylighting (PWGSC, 2005), while Australians and participants from other countries named 12 guides in addition to the 12 they were presented with. Other guides selected mainly by non-North Americans were the CIBSE - Lighting Guide 10: Daylighting and window design (CIBSE, 1999); and the BRE - Designing Buildings for Daylight (Bell and Burt, 1995).
• Computer simulations: the 117 participants (75% of the sample) who used simulations tools were asked to select the computer programs they used for daylighting design. Participants were presented with a list of 29 popular software
packages, could choose more than one tool, and add other tools manually if desired. A total of 290 selections were made, and participants listed an additional 10 packages to the 29 already provided. Ninety-eight selections were made for Radiance based tools followed by 66 selections for tools based on the split flux approach. Other computer software packages chosen by the participants were
3DStudioMax4 (22 participants) and AGI325 (20 participants).
• Scale-models: the 31 participants (20% of the sample) who indicated using scale models for daylighting design were asked which design aspects they used the models for. A large majority of the participants said that models were mainly used for site planning, building orientation, visual assessments and communication with clients and other design team members. Other aspects of daylighting design linked to scale models were: study the effects of adjacent buildings on daylighting, lighting and shading controls; establish the location/shape/size of windows and skylights; select the glazing and shading type; design shading devices for glare control; establish lighting control zones; select room dimensions and surface properties of interior materials; use of artificial skies for sun control verification; and atria design.
3.4.2 Time dedicated to daylighting design
Participants who included daylighting in their designs were asked how much time they usually dedicated to this task on any given project. The free-text responses varied greatly, ranging from “minimal” and “very little because it is only the control of lighting” to “not anywhere close to enough”, “daylighting is usually the key driver at
4
http://usa.autodesk.com/adsk/servlet/index?id=5659302&siteID=123112
5
the onset of the project”, “it is always in my mind during design” or “it is an integral part of the approach”. Among those who were more specific (40 participants), 18 individuals said that they spent 1 day or less, 16 indicated intervals between 2-5 days, and only 6 spent more than 1 week. Data also shows that practitioners who spend a day or less on daylighting analysis rely more heavily on their experience and manufacturers information than those in the other two categories. As one would expect, computer simulations and scale models were most commonly used by those with a week or more to spend on daylighting. Those who used simulations but had
less than a day for daylighting design mostly reported using the Ecotect6,
ArchiCAD5, DOE25, eQuest7, EnergyPlus5 and 3DStudioMax software. While some
exploratory daylighting simulations can indeed be carried out within a day using some of these tools, building a customized model using a building simulation software such as DOE2 or eQuest (especially one including daylighting controls) would typically take substantially longer than a day. Therefore, we speculate that those who reported using such software in less than a day considered only the extra time needed to add daylighting simulations to an already functional model that had previously been built for other analysis purposes.
Overall, the participants’ comments suggest that while there is a growing number of practitioners who dedicate a significant amount of time to daylighting, most participants had only a couple of days per project to spend on this topic. The stated reasons for this were mostly linked to budget constraints and lack of client interest. 6 http://www.eere.energy.gov/buildings/tools_directory/alpha_list.cfm 7 http://www.doe2.com/equest/
3.4.3 Criteria used to assess the overall quality of a daylighting design
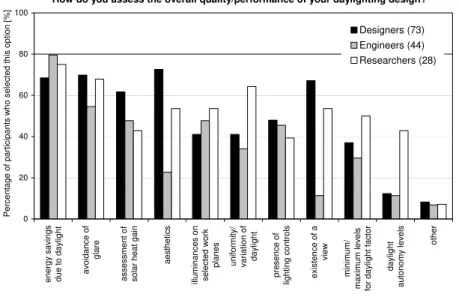
When asked what criteria they used to assess the overall quality and performance of a daylighting design, 72% of 158 participants selected energy savings due to daylight as the main performance indicator. This choice was followed by the avoidance of glare (64%), aesthetics (54%), assessment of solar heat gain (54%), illuminances on selected work planes (46%), existence of a view (46%), presence of lighting controls (45%), uniformity/variation of daylight (44%), minimum/maximum levels for daylight factor (38%), and daylight autonomy levels (17%).
Figure 7 shows the percentage of participants in each main professional group who selected a particular performance indicator. Only 23% of the engineers selected aesthetics as a criteria, compared to 73% of designers and 54% of researchers. Similarly, only 11% of the engineers selected the existence of a view compared to 67% of designers and 54% of researchers. Emerging metrics such as daylight autonomy levels were selected by less than 15% of the engineers and designers, compared to 43% of researchers, who also chose in a larger number the uniformity and variation of daylight than the other two professional groups.
Figure 6 and 7 show that while the tools used to asses daylighting vary between the three professional groups, energy savings and the avoidance of glare were consistently rated as the two main criteria used by all three groups.
0 20 40 60 80 100 energy s av ings due t o day light av oidanc e of glare a sse ssme n t o f s olar heat gain aes thet ic s illuminanc es on se le cte d wo rk planes unif o rmit y / v a riat ion of day light pres enc e of light ing c ont rols ex is tenc e of a vie w minimum/
maximum levels for day
light f ac tor day light aut onomy lev e ls ot her P erc ent age of part ic ipant s w ho s elec ted t his opt ion [ % ] Designers (73) Engineers (44) Researchers (28) How do you assess the overall quality/performance of your daylighting design?
Figure 7: Responses given by survey participants in each professional group as to what performance indicators they used to assess the overall quality of their daylighting designs. The numbers in brackets indicate the total number of participants who answered the question.
Depending on the criteria used to assess the quality and performance of a daylighting design, the participants were asked to provide more details about how they applied the performance indicator they had previously selected.
• Daylight factors: 60 participants (38% of the sample) indicated using the daylight factor as a performance metric. About half of them further indicated that the minimum levels they used varied between 2 and 10%. Some of those using the 2% level quoted the LEED daylighting credits whereas others also quoted the IESNA - Lighting Handbook (IESNA Lighting Handbook, 2000) or the German DIN 5034 standard (DIN 5034:1,2,3 and 4, 1985, 1994, 1999). One participant noted: ”There is
too much emphasis on daylight factors, but typically one is looking for 2% or so minimum in areas one wants to be daylit and without too much contrast with other
bits of the same space. People often aim for 5%, but in our experience this is more likely to lead to solar gains, glare and blinds-closed, lights-on”.
• Assessment of view: the 72 participants (46% of the sample) who said that they assessed the quality of their designs based on the existence of a view were asked to specify how they assessed it. Five participants mentioned the LEED ‘access to view’ method (US Green Building Council, 2005), while a few others mentioned site inspections, model studies, and other visualization techniques. The vast majority of participants used their own subjective approaches based on intuition and experience, or believed that view is a subjective matter typically assessed by clients or predetermined by the architect. Most participants expressed their thoughts as to why access to view is important (e.g., clients purchase sites that have view potential; give occupants a pleasurable relief from their internal environment) or stated that “any view of the outside is better than none. Some urban or natural landscapes are
particularly pleasing. It is good for human health to know what Mother Nature is doing outside”. One participant believed that “horizontal views to the outdoors (not to the sky)” are important, another said that “ideally it is nice to see something of the ground, the sky, foreground and background. But sky views can bring glare and near-permanent closing of blinds, unless windows and controls are well designed and managed”.
• Assessment of glare: 101 participants (64% of the sample) selected glare as a criterion for daylighting design assessment, however, when asked to provide specifics about the method used to assess glare only about half indicated scientific calculations methods, while the rest mentioned past experience, and visual and subjective assessments, providing various explanations as to why glare should be avoided “as much as possible” without mentioning, however, the specific measures
that they took to make this happen. Only twenty participants listed the use of computer renderings (Radiance or other computer programs) and simulations of daylight glare indices such as the Daylight Glare Index (DGI), the CIE-Unified Glare Rating (UGR), or the Guth visual comfort probability index (Boyce, 2003). A few others indicated using other calculation methods of direct reflections or reflectivity of outdoor and indoor surfaces, or reported using physical models. One participant summarized his thoughts on the issue of glare as follows: “It all depends on the
context ... but the biggest problems in practice tend to be sun and sky glare, veiling reflections, and excessive contrasts (but for the most part we don't like uniformity). For the most part, we find qualitative assessments more useful than things like glare indices, which can miss out critical factors.”
• Assessment of energy savings from daylighting: 113 participants (72% of the sample) considered energy savings due to daylighting to be the main performance indicator of a daylighting design. Of those, 22 (~20%) did not indicate using computer simulations during either schematic design or design development. One participant noted that “Done right, the incorporation of daylighting into a design can
almost (in most circumstances) eliminate the need for electrical sources of light during the day”. Another, however, believed that “one cannot estimate savings because human behaviour, which cannot be predicted, determines when and where artificial lighting is used”. Nevertheless, for this performance indicator there seems to
be a greater convergence of opinions between most participants on the practicability of using building modelling software such as DOE2, eQuest, EE4, HEED, Ecotect, Energy10, EnergyPlus, Trace, Bsim, Daysim (Building Energy Software Tools Directory, 2007) for detailed energy simulations, which most participants used to: establish baselines and test the performance of various systems; estimate the
displacement of electric lighting; or quantify the relationship between reduced lighting power densities, solar heat gains, and heating and cooling loads in order to avoid extra costs that would counteract the savings achieved by the reductions in electric lighting. Some participants also outlined that daylighting/energy modeling is engaged usually only on large commercial building projects where clients are prepared to pay for it, whereas on smaller projects, the evaluation is typically more of a qualitative nature or employs simple hand calculations or estimates.
3.4.4 Building design aspects influenced by the daylighting analysis
Participants were also asked which design aspects were mainly influenced by their daylighting analysis. They could choose one or several items from a list of nine design aspects and/or add one of their own.
‘Location, shape and size of windows and skylights was the design aspect chosen by most participants (141 out of 158 participants, 89% of the sample), followed by lighting and shading controls (79%); glazing type (78%); shading type (75%); building orientation (70%); surface properties of interior materials (56%); site planning (52%); sizing of HVAC systems (49%); and room dimensions (47%).
Figure 8 shows the percentage of participants in each professional group who selected a particular design aspect. As expected, the engineers mostly focused on energy-related aspects such as the sizing of the HVAC system, the glazing type, and the choice of lighting and shading controls. The designers, on the other hand, focused more on aspects that traditionally fall within their area of influence such as façade design, site planning, room dimensions, and the properties of interior materials.
0 20 40 60 80 100 Location/ shape/ size of windows and skylights Lighting & Shading Controls Glazing type Shading type Building orientation Surface properties of interior materials Site planning Sizing of HVAC systems Room dimensions Other P erc ent age of part ic ipant s w ho s elec ted t his opt ion [ % ] Designers (73) Engineers (44) Researchers (28) Which design aspects are influenced based on your daylighting analysis?
Figure 8: Responses given by survey participants in each professional group as to what design aspects are influenced by their daylighting analysis.
Depending on the design aspect they selected, the participants were asked to elaborate on the decision process and criteria used in more detail, as follows:
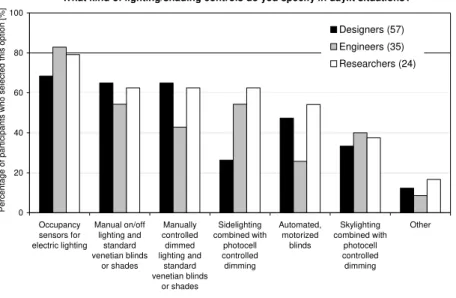
• Lighting/shading controls: the 125 participants who said they influenced the selection of lighting and shading controls were asked what kind of controls they usually specified. Participants were offered 6 selections to choose from and could also add their own. Overall, 73% of these participants specified occupancy sensors for electric lighting; 61% specified manual on/off lighting and standard Venetian blinds or shades; 58% selected manually controlled dimmed lighting and standard Venetian blinds or shades; 44% chose sidelighting combined with photocell controlled dimming; 40% selected automated motorized blinds and 38% selected skylighting combined with photocell controlled dimming (Figure 9). It is interesting to note that some of these technologies have been reported to have a lower actual market penetration rate than the results presented here might suggest (DiLouie,
2005), and that occupancy sensors are apparently specified more often by the survey participants than manual on/off light switches with manually controlled Venetian blinds, which is, arguably, the most common ‘reference‘ system installed in North America and Europe (IESNA Lighting Handbook, 2000). However, given that the survey group consisted of design professionals with an interest in sustainable design, it is not so surprising that this group would be more inclined to specify an energy saving technology than the ‘average designer’. Nevertheless, note that manually controlled dimming, photocell controlled dimming and automated blinds were also specified but with less frequency than the reference case. The reason for this general trend might be that these systems are increasingly more expensive than the reference system and their performance is not always established (Heschong et al., 2005). According to Figure 9, skylights combined with automated dimming remain a rare option even though this system has been recently shown to perform more reliably in the field than sidelighting and photocell controlled dimming (McHugh et al., 2004).
0 20 40 60 80 100 Occupancy sensors for electric lighting Manual on/off lighting and standard venetian blinds or shades Manually controlled dimmed lighting and standard venetian blinds or shades Sidelighting combined with photocell controlled dimming Automated, motorized blinds Skylighting combined with photocell controlled dimming Other Perc entage of partic ipants who s e lec ted this option [%] Designers (57) Engineers (35) Researchers (24) What kind of lighting/shading controls do you specify in daylit situations?
Figure 9: Responses given by survey participants in each professional group as to what kind of lighting and shading controls they specified in daylit situations.
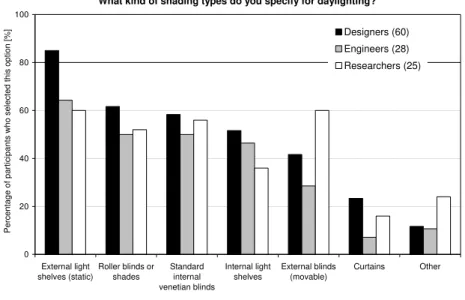
• Shading types : the 118 participants who said they influenced the selection of shading devices were asked what types of shades they usually specify. Overall, 75% of the participants selected external light shelves (overhangs); 57% selected roller blinds or shades; 56% selected standard internal Venetian blinds; 47% selected internal light shelves; 42% chose external blinds (movable), and 17% selected curtains. Figure 10 shows the percentage of participants in each professional group who selected a particular type of shading device. More designers selected static external light shelves than engineers and researchers, while movable external blinds were selected by more researchers than designers and engineers.
0 20 40 60 80 100 External light shelves (static) Roller blinds or shades Standard internal venetian blinds Internal light shelves External blinds (movable) Curtains Other Perc entage of partic ipants who s e lec ted this option [%] Designers (60) Engineers (28) Researchers (25) What kind of shading types do you specify for daylighting?
Figure 10: Responses given by survey participants in each professional group as to what kind of shading types they specified in daylit situations.
3.4.5 Who influences daylighting related design decisions
When asked who they thought mostly influenced daylighting related decisions, a large majority of participants believed that architects have the greatest influence on daylighting related decisions, overall this selection being made by 133 out of 158 participants (84% of the sample). Forty-three percent of the participants also selected the owner, 30% selected the lighting designer, and 22% selected consultants. Ninety-five participants (60% of the sample) selected more than one item, which suggests that many believe in shared responsibility when it comes to making decisions.
As shown in Figure 11, all selections were very similar across the three main professional groups. Other professions of people participating in the decision-making process mentioned in the open-text boxes were: electrical, mechanical or services engineer, cost consultant, end-user, and builder.
0 20 40 60 80 100
Architect Owner Lighting Designer Consultant Other
P erc ent age of part ic ipant s w ho s elec ted t his opt ion [ % ] Designers (73) Engineers (44) Researchers (28) Who do you think mostly influences daylight related design decisions?
Figure 11: Responses given by survey participants in each professional group as to who mostly influences daylighting related to decisions.
3.4.6 Sizing of the HVAC equipment based on the daylighting concept
In order to identify any potential conflict in the decision making process regarding the sizing of the HVAC system, survey participants who previously reported that their daylighting analysis influenced the sizing of the HVAC system were asked who they thought would take the ultimate responsibility for the resulting HVAC design. Of the 78 participants who answered this question, 50% said that the responsibility lays with the HVAC engineer, while the rest of the participants were equally split between the belief that responsibility is shared between the members of the design team, and the belief that responsibility is shared between the design team and the owner, who accepts that the building might overheat at certain times of the year. As shown in Figure 12, more engineers and researchers (50-62%) than designers (37%) allocated the responsibility to the HVAC engineer.
0 20 40 60 80 100
Responsibility stays with the HVAC engineer
The design team shares the responsibility
Shared responsibility: the informed owner acknowledges that the building can overheat at certain
times of the year
P erc ent age of part ic ipant s w ho s elec ted t his opt ion [ % ] Designers (35) Engineers (29) Researchers (10)
When reducing the HVAC equipment based on the daylighting concept, who takes responsibility for the resulting design?
Figure 12: Responses given by survey participants in each professional group as to who takes responsibility for reducing the size of the HVAC equipment.
Data shown in Figures 11 and 12 point to an interesting potential conflict situation. While most participants perceived the architect and the owner to have the ultimate say on daylight related design decisions, a large number of participants assigned the responsibility for sizing of the HVAC system to the HVAC engineer. This means that if a design team considers implementing daylighting measures in a cost neutral way (trading off the extra costs for lighting controls and shading for reduced HVAC equipment), the implementation of such measures might be difficult to accomplish in reality since the designer and the owner would reap the monetary benefits and prestige of a successful daylighting design, whereas the responsibility for failure remains with the HVAC engineer.
3.4.7 Barriers to daylighting
Participants were also asked which barriers to daylighting they mostly encountered when considering it in their projects. Fifty-three percent of the participants believed that the payback time was too long, while a large number of participants (about 30-40%) selected also the reliability of controls, time constraints during planning, and designers’ objections for aesthetic reasons (Figure 13). All selections were similar across the three main professional groups. Other barriers reported in the open-text boxes were: lack of consumer familiarity with the benefits, not part of the electrical engineer’s training and education, budget constrains and cost of system, dimming ballasts and their additional energy use, daylighting not required by codes, product cost, cost of accurate simulations, blinds closed/lights on scenario hard to avoid, heat loss through large glazed areas, inconsistent and weather-dependent lighting conditions, impact of daylighting on other building system, lack of clear ideas on which strategies really work.
Which barriers to daylighting do you mostly encounter?
Designer objects for aesthetical reasons
10%
Time constraints during planning
18% Reliability of controls uncertain
21%
Payback time too long 33% Other
18%
3.4.8 Implementation and commissioning of daylighting projects
When asked what were the main challenges when commissioning a daylighting project, a similar number of participants in each professional group (about 30%) gave equal ratings to time restrictions/contract fees, ensuring satisfactory system operation and finding a knowledgeable contractor. Designers also rated finding information on system performance or obtaining adequate information from manufacturers in a larger proportion than the engineers or researchers (21-30% compared to 9-18%). Figure 14 presents the overall distribution of the main challenges associated with the commissioning of daylighting projects as reported by the survey participants.
What are you main challenges when commissioning?
Time restrictions/contract fees 27% Finding information on system performance 14% Finding a knowledgeable contractor 20% Ensuring satisfactory system operation 22% Other 6% Obtaining adequate information from manufacturers 11%
Figure 14: Distribution of challenges encountered by survey participants when commissioning a daylighting system.
When asked how they ensured that their daylighting designs were properly implemented and commissioned during and after construction, 37% of the participants selected writing specifications and verifying functionality of the systems once installed. However, a similar percentage of participants (34%) acknowledged
that they did not have a daylighting commissioning procedure in place, with designers being more likely to not have one (40%) compared to 20% of researchers and engineers (Figure 15).
0 20 40 60 80 100 Wri te s pec if ic at ions Ve ri fy syste m func ti onalit y af te r installation Don't hav e a co mmissio n in g proc edure Meas ure pos t oc c upanc y perf ormanc e P repare des c ript ion of int ended operat ion Establish maint enanc e plan w it h ow ner P repare pre-co mmissio n in g plan Ot her H ire c ons ult ant to ens ure proper installation P erc ent age of part ic ipant s w ho s elec ted t his opt ion [ % ] Designers (73) Engineers (44) Researchers (28) When specifying daylighting elements such as lighting controls and/or shading controls, how do
you ensure that your design is properly implemented and commisioned during/after construction?
Figure 15: Distribution of procedures practiced by survey participants for implementation and commissioning of daylighting designs.
3.5 Requirements for a new daylighting design guide
All survey participants were invited to provide their thoughts on the necessity for a new daylighting design guide and suggest the format, lengths and mode of presentation and complexity that would be the most useful to them. However, since the proposed daylighting design guide is directed mostly toward design practitioners, the analysis of the answers provided below will focus mainly on the opinions expressed by the designers and engineers.
• Format: Customized PDF documents, downloadable from the web and generated based on project data for different climate zones, were selected by 88% of the 177 participants, which suggests that most practitioners favour the initiative of a
new daylighting design guide and would use the information if presented in an easily accessible format online. Only 12% of the participants believed that there is no need for such a guide or preferred another format (e.g., reference books, standards, etc.). • Length: overall, 47% out of the 177 participants said that the length of the guide would not be important to them, while 36% selected guides with less than 50 pages. As shown in Figure 16, both engineers and designers were equally split between “does not matter” and “less than 50 pages”.
0 20 40 60 80 100
Does not matter Less than 50 pages Less than 100 pages
P erc ent age of res pondent s w ho s elec ted t his opt ion [ % ] Designers (78) Engineers (48) How long should such a document be?
Figure 16. Responses given by designers and engineers regarding the preferred lengths of a new daylighting guide.
• Mode of presentation: 80% out of the 177 participants selected rules-of-thumb and simple calculation methods followed by links to advanced daylighting tools as their preferred mode of presentation and level of complexity for a daylighting design guide. Only 30% selected text books with detailed background information on daylighting concepts, and this option was selected more by researchers (55%) than
engineers (33%) and designers (21%). A lower but equal number of participants (24%) selected rules-of-thumb and simple calculation methods only, and simple Dos and Don'ts. 0 20 40 60 80 100
Rules of thumb and simple calculation methods followed by links to more advanced daylighting tools
(in case you have some time)
Text books with detailed background information on
daylighting concepts
Rules of thumb and simple calculation methods
Simple Dos and Don'ts
P erc ent age of part ic ipnt s w ho s elec ted t his opt ion [ % ] Designers (78) Engineers (48)
Which modes of presentation and level of complexity would you find most useful?
Figure 17. Responses given by designers and engineers regarding the mode of presentation and complexity of the information included in a daylighting guide.
• Missing information: below is a summary of the information that survey participants thought to be missing from current daylighting design guides:
standards and strategies for evaluating the quality of a daylight design;
clear definitions of daylighting quality and its effects on human health; provision of accurate glare calculation indexes that can be used as an indication of potential glare problems and severity; clear information about the visual impact and the real effects of daylighting on building orientation, form and windows;
simple charts for daylighting design developed for different users; examples of different ways to design a window depending on its orientation; correlations to
calculate the impact of fenestration on the heating and cooling loads based on glass types;
accurate rules-of-thumb that evolve with time and the development of new technologies and materials; a compilation of simple current daylighting software packages;
location and climate-specific daylight availability data; tools that give quantitative information (e.g., sun path diagrams, sun angle calculators, simple simulations, examples of different shading devices working on different elevations and shown for a variety of latitudes); examples of effective ways and methods to direct daylight into buildings and determine the annual daylighting autonomy as a way of measuring the overall saturation level of daylight in a space throughout the year;
a summary of all the major daylighting issues with a quick reference to the technical rationale behind each assumption or recommendation; case studies of existing buildings (analysis of successful precedents explaining why they are successful and how the occupants respond);
controls and commissioning information;
simple and cheap calculation techniques for energy savings and life cycle cost analysis to demonstrate to clients the savings and benefits of daylighting at early design stages.
3.6 Participants’ comments regarding the use of daylighting in buildings
At the end of the survey all participants were invited to provide additional comments on what they thought should be done to enhance the use of daylighting in buildings. Below is a synopsis of some of their comments:
Some participants highlighted the need for reliable and easy to use design tools that would allow quick demonstrations in design meetings, giving architects and clients an idea of what it means to be in the occupant's position. These tools should consider the impact of lighting/daylighting use on the indoor climate and the HVAC system and should integrate cost analysis calculations. This is particularly important because most clients are reluctant to pursue natural daylighting and sustainability because they are not knowledgeable enough on the subject and the aesthetics of daylighting, and they believe that payback time for the sustainability of natural lighting is too long for the investment.
Other participants mentioned the education of architects as a key factor. One participant noted: “Architects make huge and formative design gestures about
daylighting but are seldom interested in the internal logics or do not have enough concern to engage the needed rigor”. Other participants believed that designers do
not have yet a systematic understanding of the annual and daily variation of daylight, or the need for automated control of electric lighting. Other participants remarked that all architects should be able to recognize where daylighting is easiest to implement, where it provides the most benefit, what occupancies, zone sizes, and orientations are most likely to save energy and have relatively quick payback time, and what configurations of placement of walls, walkways, furniture and orientation are contributing to good daylighting.
Some participants emphasized the importance of designers’ access to “honest case studies” that show examples of daylighting designs that work. These should be grouped by design challenges and provide details on how the various challenges were addressed (e.g. east versus west facing windows, side-lit deep floor sections, alternative solutions for situations where exterior shading devices are not
feasible). As one participant noted: “Especially in subtropical and tropical latitudes, it
is important to design for daylighting while excluding direct sunlight, which even in winter can cause glare and overheating problems”.
Finally, some participants commented on the criteria by which one ’judges’ the success of a daylighting design, noting that energy efficient designs are not necessarily ‘successful’ for the occupants and their visual needs. The variability of light distribution, which contributes to the visual interest is not fully supported in guidelines and the literature. One of daylighting’s greatest value is improving the health and productivity of the building occupants. Energy alone makes it difficult to justify daylighting and it is often eliminated for that reason. One participant summarised this idea as follows: “We need good studies to show the
worker/occupant benefit and how this impacts the overall economics”.
4. Discussion and Conclusion
Overall, the results of this survey largely confirmed the findings of the earlier 2004 survey on daylight simulation tools.
• Daylight Simulations: The new survey confirmed that during the early design stage practitioners tend to rely on experience from previous work and rules-of-thumb and that computer simulations are increasingly used during the design development stage. Less than one percent of all participants expressed concerns regarding the accuracy of computer programs. Reasons for not using simulations were mostly linked to time and budget constraints. Similar to the earlier survey, participants reported using 39 different daylighting simulation programs, however, over 62% of these are partly or exclusively based on the Radiance backward raytracer.
• Rules-of-thumb: This survey also confirmed that rules-of-thumb are a key element of daylighting design practice today and that the rules currently used are non-standardized in the sense that different practitioners use different variations of the same concepts, making only passing reference to design guides. This finding underlines the importance of ‘validating’ the rules that are currently being used in order to formulate them in a way that is based on scientific evidence (Reinhart, 2005).
• Performance Metrics: Participants selected various performance indicators for their daylighting analyses, with the calculation of energy savings due to daylighting and the avoidance of glare as the front-runners (selected by an average of 70% of the participants). However, there seemed to be no commonly acknowledged method as to how this is done, especially with regards to glare prevention. Similarly, there seems to be no common criteria for the assessment of daylight factors and view to the outside. North American practitioners tended to gravitate towards the daylight factor and view criteria promoted by LEED but seemed, at the same time, to be conscious of the limitations of this approach. The only performance indicator that was somewhat generally accepted was the use of building modelling software to quantify the energy benefits of various daylight technologies. Again, this is not surprising since software packages such as EE4 in Canada, and DOE2 and eQuest in the United States, have been available for a number of years and allow their users to quickly estimate overall energy savings from automated lighting controls and to collect credits for these savings under LEED, CHPS, and other building rating systems.
• Barriers to daylighting: The most commonly stated reasons for not considering daylighting were: payback time too long, perceived cost and reliability of controls, time and budget constrains during project planning; lack of awareness about the benefits of daylighting on both energy use and health of building occupants, lack of clear ideas on which strategies will work.
• Content and format for a new daylighting design guide: The results of the survey show that participants generally supported the development of a new daylighting design guide that would be easily accessible online and provide the information at both levels of complexity: rules-of-thumb and simple calculation methods, as well as links to advanced daylighting tools in case the project time-frame and budget allows it. In fact, this mode of presentation is already used by the ‘Tips for Daylighting with Windows’ document (O'Connor et al., 1997). Participants were almost equally split between favouring a document shorter than 50 pages and a document with an unspecified number of pages (“does not matter”). We speculate, however, that a 50-page document would most likely be fully read whereas a longer version would be viewed more as a reference guide.
The results of this survey confirm that daylighting is an established and regularly implemented sustainable building design technique. However, its versatility and far-reaching implications for occupant comfort and building energy use make it more difficult to implement than other energy-saving technologies. Practitioners tend to use general rules-of-thumb for daylighting design whereas quantitative methods are used later in the design process and usually focus on the calculation of the energy savings. The use of occupancy sensors, though strictly speaking not a daylighting saving strategy, has established itself as the most popular lighting control
system choice, probably because in recent years this system’s price has dropped while its reliability has increased.
The results of the survey will be used to inform the development of a scientifically-based online daylighting design guide that will assist building design practitioners to effectively implement daylighting in their projects, regardless of their experience with daylighting concepts and technologies.
Acknowledgement
This work was financially supported by the Canadian Climate Change Fund - Technology and Innovation, the National Research Council Canada, and Natural Resources Canada (project number CCTI078). The authors would like to thank Steve Selkowitz of the Lawrence Berkeley National Laboratory, USA, for providing useful comments on an early version of the survey questionnaire and for forwarding the survey invitation to key USA contacts. Special thanks are also due to Steve Coyne of Queens University, Australia, for effectively disseminating the survey invitation among Australian design practitioners.
References
Bell, J.; Burt, W. (1995) Designing Buildings for Daylight, Building Research
Establishment (BRE).
Boyce, P.R. (2003) Human Factors in Lighting, 2nd edition, Taylor and Francis, pp.
Chartered Institution of Building Services Engineers – CIBSE (1999), Lighting Guide
10: Daylighting and window design.
Collaborative for High Performance Schools (2007), CHPS Best Practice Manual, available at: http://www.chps.net/.
DiLouie, C. (2005) New study finds adoption of dimming systems to be increasing,
Lighting Controls Association, available at:
http://www.aboutlightingcontrols.org/education/papers/dimmingstudy.shtml.
DIN 5034-1:1999 (Daylight in interiors - General requirements); DIN 5034-2:1985 (Daylight in interiors; principles); DIN 5034-3:1994 (Daylight in interiors - Part 3:
Methods of calculation); DIN 5034-4:1994 (Daylight in interiors - Part 4: Simplified method of determining window sizes in dwellings)
Guzowski, M. (1999) Daylighting for Sustainable Design, McGraw-Hill, ISBN 0-07-025439-7.
Heschong, L.; McHugh, J.; Pande, A.; Howlett, O.; Reschke, E.; Sipp, B. (2005) Sidelighting photocontrols field study, Report #0416, Heschong Mahone Group Inc., available at:
http://www.sce.com/NR/rdonlyres/B460443C-7F82-4EFD-AEBF-F80E00FC5106/0/CS_0407_Sidelit_Photocontrols_Final.pdf
Illuminating Engineering Society of North America (2000), IESNA Lighting Handbook
McHugh, A.G.; Melnyk, J. (2004) Effectiveness of Photocontrols with Skylighting,
IESNA, New York, USA, pp. 1-18.
O'Connor J.; Lee E.; Rubinstein F.; Selkowitz S. (1997) Tips for Daylighting,
Lawrence Berkeley National Laboratory, Report # LBNL-39945, available at:
http://windows.lbl.gov/daylighting/designguide/dlg.pdf
Public Works and Government Services Canada (2005), Canadian Tips for
Daylighting, available at: http://www.advancedbuildings.org/.
Reinhart, C.F. (2005) A simulation-based review of the ubiquitous window-head-height to daylit zone depth rule of thumb, Proceedings of the Buildings Simulation
2005, Montreal, Canada, August 15-18, 2005.
Reinhart, C.F.; Mardaljevic, J.; Rogers, Z. (2006) Dynamic Daylight Performance
Metrics for Sustainable Building Design, Leukos, 3(1):1-25
Reinhart, C.F.; Fitz, A. (2006) Findings from a survey on the current use of daylight simulations in building design, Energy and Buildings, (38):824-835.
US Green Building Council (2005) Leadership in Energy and Environmental Design,
LEED-NC, Version 2.2, available at: http://www.usgbc.org/LEED/.