Publisher’s version / Version de l'éditeur:
Optical Engineering, 49, 6, pp. 1-8, 2010-06-15
READ THESE TERMS AND CONDITIONS CAREFULLY BEFORE USING THIS WEBSITE. https://nrc-publications.canada.ca/eng/copyright
Vous avez des questions? Nous pouvons vous aider. Pour communiquer directement avec un auteur, consultez la première page de la revue dans laquelle son article a été publié afin de trouver ses coordonnées. Si vous n’arrivez pas à les repérer, communiquez avec nous à [email protected].
Questions? Contact the NRC Publications Archive team at
[email protected]. If you wish to email the authors directly, please see the first page of the publication for their contact information.
NRC Publications Archive
Archives des publications du CNRC
This publication could be one of several versions: author’s original, accepted manuscript or the publisher’s version. / La version de cette publication peut être l’une des suivantes : la version prépublication de l’auteur, la version acceptée du manuscrit ou la version de l’éditeur.
For the publisher’s version, please access the DOI link below./ Pour consulter la version de l’éditeur, utilisez le lien DOI ci-dessous.
https://doi.org/10.1117/1.3449112
Access and use of this website and the material on it are subject to the Terms and Conditions set forth at
Jade detection and analysis based on optical coherence tomography
images
Chang, Shoude; Mao, Youxin; Chang, Guangming; Flueraru, Costel
https://publications-cnrc.canada.ca/fra/droits
L’accès à ce site Web et l’utilisation de son contenu sont assujettis aux conditions présentées dans le site LISEZ CES CONDITIONS ATTENTIVEMENT AVANT D’UTILISER CE SITE WEB.
NRC Publications Record / Notice d'Archives des publications de CNRC:
https://nrc-publications.canada.ca/eng/view/object/?id=4ab7d98e-6895-4c5b-9012-06a84867557a https://publications-cnrc.canada.ca/fra/voir/objet/?id=4ab7d98e-6895-4c5b-9012-06a84867557a
Jade detection and analysis based on optical
coherence tomography images
Shoude Chang Youxin Mao
National Research Council Canada Institute for Microstructural Sciences 1200 Montreal Road, M50
Ottawa, Ontario K1A0R6 Canada E-mail: [email protected]
Guangming Chang
Shandong Yingcai University Jinan, Shandong China
Costel Flueraru
National Research Council Canada Institute for Microstructural Sciences 1200 Montreal Road, M50
Ottawa, Ontario K1A0R6 Canada
Abstract. Optical coherence tomography is a fundamentally new type of optical sensing technology that can perform high-resolution, cross sec-tional sensing of the internal structure of materials and biological samples. This work briefly describes its capability of exploring and ana-lyzing the internal structures and textures of various jades. With a depth resolution of 4 m in jade and penetration range of 5 mm in jade, swept-source OCT could be used as a new powerful instrument to generate 3-D volume data of jade, which is important for applications in jade in-dustry and artwork, particularly for jade detection and classification, counterfeit recognition, and guided artistic carving. © 2010 Society of Photo-Optical Instrumentation Engineers. 关DOI: 10.1117/1.3449112兴
Subject terms: optical coherence tomography; internal structure analysis; jade estimation; volume data extraction; artwork diagnostics.
Paper 100020RR received Jan. 8, 2010; revised manuscript received Apr. 7, 2010; accepted for publication Apr. 27, 2010; published online Jun. 15, 2010.
1 Introduction
Optical coherence tomography共OCT兲 is an emerging tech-nology for high-resolution cross sectional imaging of 3-D structures. The first OCT system was reported by Huang et al. in 1991.1Since then, OCT technology has been attract-ing the attention of researchers all around the world.2–4
OCT relies on the interferometric measurement of co-herent backscattering to probe the structure of test samples such as biological tissues or other turbid materials. It takes advantage of the short temporal coherence of a broadband light source to achieve precise optical sectioning in depth. Advantages of OCT versus other volume-sensing sys-tems include the following.
1. Higher resolution. This feature enables greater visu-alization of fine details of the sample. Resolutions for different systems are: OCT, 5 to 10m; ultrasound, 150m; high-resolution computerized tomography 共CT兲, 300m; magnetic resonance imaging 共MRI兲, 1000m, respectively.
2. Noninvasive, noncontact. This feature increases safety and ease of use, which is important for appli-cations where the sample is precious and delicate. 3. Fiber optics delivery. As fiber diameter is normally
125m, it allows OCT to be used in very small probing spaces, such as tiny holes, slots, and cracks. 4. High speed. The new generation of OCT technology does not need mechanical scanning in depth, which removes the bulky motion parts in an OCT system, and makes the measurement more accurate as well as increases the sensing speed.
5. Potential for additional information from the sample. For example, polarization contrast, Doppler effect, as
well as spectroscopic information could be explored by functional OCT.
6. Use of nonharmful radiation. This feature provides a safe working environment for both testing sample and system user, unlike traditional CT that works with x-rays and ultrasound that relys on mechanical vibration.
In the past decade, OCT systems have been developed mainly for medical and biomedical applications, especially for diagnostics of ophthalmology, dermatology, dentistry, and cardiology.2–4 To explore the capabilities of OCT sys-tems for probing the internal features of an object, Ref. 5
reported an application for multiple-layer information re-trieval and internal biometrics.6,7In addition, because OCT has a voxel resolution of micrometer size, it has potential applications in material investigation8and artwork diagnos-tics. Reference9 describes OCT diagnostics used for mu-seum objects, involving stratigraphic applications,10varnish layer analysis,11,12 structural analysis, and profilometric applications.13–16In Ref.17, the use of different OCT sys-tems for oil painting layer examination, varnish thickness determination, and environmental influences on paintings on canvas are described.
As an expensive natural stone, jade has a worldwide market. In the jade industry, the main procedures involve detection, assessment, cutting, and artistically carving, ba-sically relying on the human eye and/or experience. Given the advantages listed before, OCT may pave a new avenue to lead the traditional procedure to volume data-based ma-chine vision systems. This work proposes new methods based on statistical analysis of OCT images for detection of jade from raw materials and its quantitative analysis. First experimental proofs of principle are given as well as some perspectives for future applications of our technique are described.
2 Principles of Optical Coherence Tomography
For direct imaging, such as ordinary photography, all the layers reflected from the underneath of an object will be fused together. However, in optical coherence tomography imaging, due to the introduction of a coherence gate gen-erated by an interferometer and broadband light source, the fused layers can be separated from each other.
As is well known, when a partial coherent light source with a Gaussian spectral distribution is used in the interfer-ometer, the detection of light waves from an interferometer can be expressed as:
Id= Es
2+ E
r
2+ 2E
sErexp共− 4 ln 2⌬L2/Lc2兲cos共⌬L/0兲, 共1兲 where 0 is the central wavelength, ⌬L is the optical path difference between two arms, and Es and Er are electro-magnetic waves from the sample and reference arms, re-spectively. exp共−4 ln 2⌬L2/Lc2兲 cos共⌬L /
0兲 is called co-herence function, and Lc is the coco-herence length, given by Lc =共2 ln 2/兲共02/⌬兲 = 0.4402/⌬. 共2兲 In OCT systems, Lc acts as the coherence gate, which directly determines the depth resolution of an OCT system. Considering that the scanning procedure in time domain 共TD兲-OCT is actually a procedure of convolution, Esin Eq.
共1兲can be expressed by
Es⬀ Er丢hs, 共3兲
where hsis the impulse response of the sample. Its Fourier transform becomes
Ss共兲 ⬀ Sr共兲 · H共兲. 共4兲
Sr共兲 and H共兲 are Fourier transforms of Erand hs, respec-tively. When a 50/ 50 splitter is used, Sr共兲 = 1 / 2S0共兲, where S0共兲 is the light source spectrum. Considering the interferometer structure, the signal detected by a sensor is given by
Id共兲 = 兩Sr共兲 + Sr共兲H共兲兩2= S共兲关1 + H共兲兴2, 共5兲 where S共兲 = 1 / 4S02共兲.
Equation共5兲 is the foundation of Fourier domain OCT 共OCT兲, the second generation of OCT. Actually,
FD-OCT can be further divided by swept-source FD-OCT
共SS-OCT兲 and spectral domain OCT 共SD-共SS-OCT兲.18,19
SS-OCT and SD-OCT have several advantages over TD-OCT. Due to lack of mechanic motion for depth scans, the FD-OCT system is significantly faster, 50 to 100 times, than TD-OCT. In addition, both FD-OCT and SS-OCT have better sensitivity and signal-to-noise ratio.20 In the experiments described in the following sections, an SS-OCT system has been used to detect and analyze jade samples.
3 Optical Coherence Tomography Technology Applied to Jade Procedures
3.1 Jade Procedures
Jade can be classified into two groups: nephrite or jadeite. Nephrite jade共a silicate of calcium and magnesium兲 is a kind of Chinese jade existing for more than 5000 years. The features of nephrite are translucency and extreme
toughness 共the toughest of any natural stone兲. Colors of nephrite jade range from pure white to all shades of green. Jadeite jade共silicate of sodium and aluminum兲 is more rare and expensive. Beside the translucency, it is slightly harder than nephrite jade and often color enhanced. Colors of ja-deite range from white to black with intense greens and lavender.
Generally, the procedure of jade has the following steps. Exploration. This process involves drilling into the moun-tain side with water-cooled diamond-tipped core drills. The cores are then extracted and examined by eye to determine if the jade will meet the gem grade requirements.
Cutting. After the jade boulders have been broken out, they are then taken to huge diamond saws to be reduced to manageable sizes. The sawyer will also cut windows into the boulder to better expose the texture of the jade inside. Artistic carving. The jade carver will finally make the raw jade, small or big, into art crafts. During design and carv-ing, the internal pattern, such as marks and textures, may create a lot of risks and opportunities for the artist.
Another interesting nonstandard procedure is the “bet jade.” Sometimes, experienced jade dealers gather at the mining spot to select and purchase the uncut ores. They do so because the price is low, and the expensive jade can be protected if it is there. This procedure is normally called “bet jade.” In Asia, the “bet jade” is a large market, which is not limited to the mining spot.
By means of OCT technologies, the procedure of acquir-ing could be greatly facilitated. In the exploration and cut-ting steps, instead of cutcut-ting off a large area at the core and a window into the boulder for visual observation, only a small hole could be drilled and a tiny fiber probe inserted into the raw material. Then an OCT system could be used to analyze if the jade is there and what type and quality of the jade will be, which greatly avoids or reduces the waste and damage of the jade. In artistic carving, sometimes the artist has to guess what pattern is hidden underneath the surface of the jade. If the guess is wrong, the planed art work may be destroyed and devalued. However, with the capability of seeing through the jade material to certain depths, OCT could guide the artist to better handle the in-ternal patterns in jade carving.
Another potential application is the discrimination of the fake antique jade wares, which is critical in the antique market. Real ancient jade always carries some ooze and deposit on and under the surface after burial for hundreds or thousands of years. The optical penetration features, for example, the signal intensity decay and texture patterns, are different between the real and fake ones. These features can be detected and described by an OCT system and specially designed algorithms. The first attempt to use OCT to moni-tor the subsurface morphologies of real and fake archaic jades is due to Yang et al.15 In this paper, authors are fo-cusing their effort on observing the whitening area of jades. Archaeologically excavated archaic jades normally have
different degrees of whitening due to the character of min-eral composition, and variations in the underground envi-ronments of the jades. However, the artificially whitened jade probably was treated either by burning or by acidifi-cation. In Ref. 15, the authors reported that in naturally whitening areas of jade, backscattering intensity is weak, but for fake ones, backscattering intensity is enhanced. In this paper, results were examined by eye and no quantita-tive analysis was given. Actually, OCT images in this paper show that the jade structure was presented within a couple of hundred microns in depth. So, no meaningful texture could be extracted, especially for the hundreds of microns scale texture structures. It was almost impossible to per-form jade texture analysis within such a small depth, be-cause of the limitation of the first generation OCT system they used. Thanks to OCT improvements in recent years, the quality of images has dramatically improved, hence the depth penetration and resolution. In our study we used a homemade fiber-based classical swept-source OCT system. The system, in air, has a probing range and a depth reso-lution of 8 mm and 7m, respectively. Thanks to the de-velopment of a dedicated statistical analysis of obtained OCT images, we show how to distinguish the jade and nonjade materials, and how we could analyze the internal texture features of different jades. More details of the sys-tem configuration and experimental results of OCT imaging for different jades are provided in the next sections.
3.2 Optical Coherence Tomography System used for
Jade Characterization
The features of jade can be identified by: hardness, tough-ness, roughtough-ness, translucency, internal patterns and color, as well as refractive index. Roughness and colors can be described by examining surface images of jade. To analyze the roughness by OCT, at least a B-scan, rotary or forward, is needed. Hardness is defined as resistance to scratching, and toughness as resistance to breaking/smashing, which is difficult to measure by optical means. Because there is no reference surface that has a known depth inside a jade body, the measurement of the refractive index is also diffi-cult. However, translucency, surface reflection, and internal patterns could be analyzed by OCT technology.
The OCT setup used in our experiments is illustrated in Fig.1. The swept source is a commercially available swept laser with a scanning frequency of 20 kHz, a spectral range of 110 nm centered at 1320 nm, and an optical power of 10 mW 共Santec, Japan兲. The light is directed through a 2 ⫻2 fiber coupler on the reference mirror and the sample arm. The optical tip is mounted on a galvoscanner, which focuses the light on the sample through a fiber ball lens. The backscattered/reflected signals from both mirror and sample are input into a second 2 ⫻ 2 fiber coupler config-ured in a Mach-Zehnder geometry. Its two outputs become the input in a balanced detector共New Focus, Santa Clara, California兲. The output of balanced detection is recorded with a digitizer 共Alazartech, Pointe Clare Quebec兲 at a 100-MHz sampling rate. The signal is resampled to equal frequency intervals and subject to an inverse Fourier trans-form. The depth resolution of the setup is 7m, and imag-ing range for this system is 8 mm in air. Considerimag-ing the jade has a reflective index about 1.6,21 the detection reso-lution is about 4.4m, and maximum detecting range is 5 mm in the jade body.
!"#$%& '"()"*%& "++&,-"+.( /"%",0& 1&+&0+.( 2.-$%&( 345 2)(0-%"+.( 62 6(.*& 7"%8. 2.#$-+&( 9-,0+)., :&,&("+.( ;45 <):)+)=&( !>&$+ %"?&( 2.-$%&( @)((.( 7"%8. 1()8&( AB+()::&( 2.%%)#"+.(
Fig. 1 Swept-source OCT system used in experiments.
!"#$%&# #'() *+'(#,) -%.+ /(.0 (a) (b) !"#$%& #'()
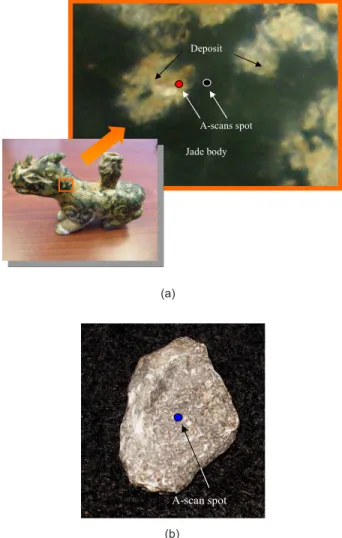
Fig. 2 共a兲 Unearthed jade used in the experiment. Orange square
on animal neck shows the boundary of the background image. Two spots 共black and red兲 indicate the A-scan positions for OCT imaging. 共b兲 Limestone used in the experiment. Blue spot indicates the A-scan position for OCT imaging. 共Color online only.兲
3.3 Jade Detection
To find the optical properties of jade, we first performed a depth scan共A-scan兲 of OCT on the jade body and nonjade material deposited on its surface. The photograph in Fig.
2共a兲 shows an unearthed jade 共dark greenish兲 with some deposit 共whiteish兲 material wrapped around it. Two OCT A-scan spots are marked in the photograph. As a compari-son, an A-scan was also performed on a common limestone shown in Fig.2共b兲.
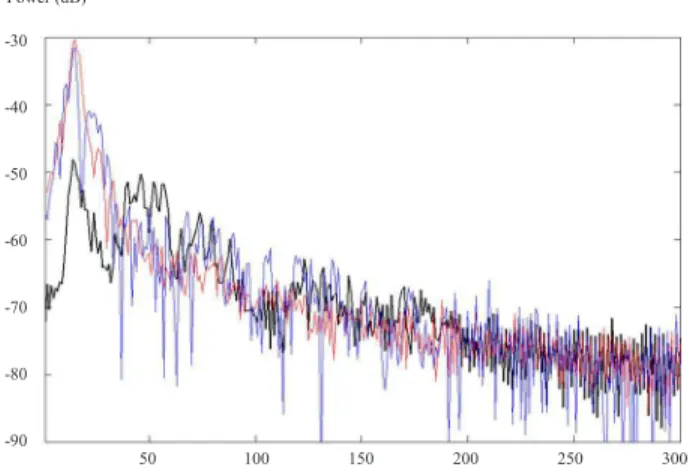
Figure3provides three OCT A-scan curves. The x axis represents the A-scan depth, where scale 300 corresponds to 2 mm. The black curve is the OCT signal obtained from the jade body and the red curve is extracted from the de-posit material on the jade surface. The blue curve is ob-tained from the limestone. There are two obvious differ-ences between the jade signal and nonjade signal: surface reflection and internal distribution. There is about 20-dB difference in signal intensity between jade and nonjade ma-terials. In the top area, 0 to 100 in Fig.3, the OCT signal of jade has flatter distribution and richer structure than those of nonjade. Hence, a simple distinguishing criterion can be given by such a value:
D=兩Smax− Sref兩 · var共Stop兲, 共6兲
where Smaxis the maximum value of the OCT signal, which is actually the signal reflected from top surface of the sample. Sref represents the nonsignal reference, which can be defined as the mean OCT signal in the deepest area, for example, the area 250 to 300 in Fig.3.兩Smax-Sref兩 gives the relative intensity of surface reflection, which could be used to represent the translucency of the testing material. The smaller the value is, the more translucent/transparent the sample could be. Translucency is the most important fea-ture to distinguish jade from nonjade, particularly for the potential jade boulders. Stop is the top area in the OCT signal where the obvious internal structures of jade exist, for example, the area 1 to 100 in Fig.2. var共Stop兲 denotes a variance of Stop, which describes the flatness of the OCT signal in the defined top area. The smaller the value is, the richer the internal structure it may have. D value can be
used to represent the translucency and internal structures of the test sample. A smaller D value reflects a more translu-cent material that contains richer internal structures.
Given Eq. 共6兲, the D values for the jade body, deposit material, and limestone are listed in Table 1. From those values, the jade can be distinguished by simply setting a threshold.
3.4 Jade Analysis
Although the D value can provide a rough estimation of a jade, more description may still be needed for internal tex-ture analysis, which is important for classification of differ-ent types of jade. Texture analysis techniques can be clas-sified into three groups:22 1. statistical technologies based on region histograms and their moments; 2. spectral tech-nologies based on the autocorrelation function or power spectrum of a region; and 3. structural technologies based on pattern primitives. Algorithms for texture analysis of OCT images were previously reported for biomedical ap-plications. In Ref.23, authors performed the texture analy-sis for tissue classification based on the structural and speckle content in OCT images. In Ref. 24, the authors presented an automated algorithm that uses texture analysis to detect bladder cancer from OCT images. Based on the three approaches: statistical, structural, and spectral, 74 tex-ture featex-tures are extracted for each image in their training set.
The textures of jades are significantly different from those in biomedical OCT images. They almost have no continuous edges, solid borders, or closed subareas inside. They look more like galaxy patterns. Hence, statistics may be the only tool for texture feature description. In this work, we proposed to extract six parameters from an OCT image.
1. Entropy of OCT image, defined by
Etr= −
兺
i
关Hhis共i兲兴 · log2关Hhis共i兲兴, 共7兲
where Hhis共i兲 is the histogram of the OCT image, and irepresents the individual gray level in the OCT im-age. The histogram gives the probability distribution of gray levels existing in an OCT image. Etrdescribes the main shape of the histogram and how rich the gray levels are contained in an OCT texture. The big-ger the Etr, the richer the gray levels in the OCT image.
2. Half-peak width of the histogram of the OCT image, defined by
Whp=关HF− HL兴/max共gray level兲. 共8兲
HF is the first histogram line number, where the his-togram has a value greater than or equal to the half maximum of the histogram. HLis the last histogram line whose value is greater than or equal to the half maximum of the histogram. Max共gray level兲 is the !"#$% &'() *+, *-, *., */, *0, *1, *2, ., 3,, 3., 4,, 4., +,,
Fig. 3 Three OCT A-scan curves extracted from jade and
lime-stone. Scale 300 corresponds to 2 mm in depth. The black curve was obtained from the jade body. The red curve was obtained from the deposit material on the jade’s surface. The blue curve was ob-tained from the limestone. 共Color online only.兲
Jade body Deposit material Limestone
D value 1.1203⫻ 103 5.2755⫻ 103 5.8501⫻ 103
maximum number of gray levels in the image. In our experiments, all images are finally normalized to 8 bits of gray level, i.e., 256 gray levels. Whp is a normalized value. A small Whpindicates a sharp peak in the histogram and a narrow gray-level range in the OCT texture.
3. Standard deviation of histogram of the OCT image. This parameter estimates the roughness of the histo-gram of an OCT image.
The prior three parameters are used to statistically describe the probability distribution of gray levels in an OCT image.
4. Average gray value of an OCT image. It estimates how strong and how much texture can exist in the jade sample.
5. Standard deviation of OCT image, and 6. variance of OCT image. Both are used to represent the global roughness of an OCT image.
These latter three parameters are statistical tools directly used in an OCT image, rather than its histogram.
Based on these six parameters, a texture vector can be constructed by
V= a1f1v1+ a2f2v2+ a3f3v3+ a4f4v4+ a5f5v5+ a6f6v6,
共9兲 where, f1through f6denote entropy, half peak width, Stan-dard deviation of the OCT histogram, average gray value, standard deviation, and variance of OCT, respectively. v1 through v6are the unit vectors representing each parameter. Weighting factors for each parameter are given by a1 through a6. The texture vector gives a numerical descrip-tion of the texture pattern contained in an OCT image of a jade.
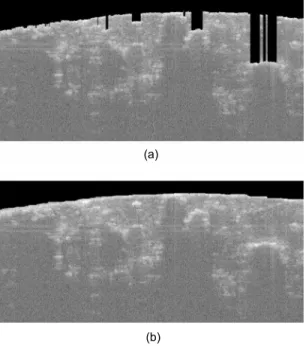
To test the method of texture analysis given by Eq.共9兲, experiments were carried out. Different types of jades, numbered 1 to 6 shown in Figs.4共a兲–4共f兲 were then OCT imaged. Different than the en-face image, the A-scan OCT image contains an open-air area, which is nonobject and needs to be removed before doing texture analysis. We have designed a two-step algorithm to segment the object area. In the first step, a binary mask was created by finding the maximum points in each vertical line 共A-scan line兲. Figure5共a兲shows the OCT image segmented after the first step. Because the maximum pixel may not be located at the object border, the second step is needed to remove these vertical thorns. Figure 5共b兲 shows the final segmentation result after step 2. In the segmented OCT image, the pixels in the open-air area are not counted in the jade analysis.
Table2provides the values of six parameters of the six jades shown in Fig.4. For each set of parameters, all values are normalized from 0 to 1, which was done by subtracting the minimum and then dividing by the maximum.
Table3gives the variances of each parameter for differ-ent jades. a1 to a6 are weighting factors whose values are given by the order of the values of variances. For example, the parameter with the maximal variance has a weighting factor of 6, and the one with minimal variance has a factor of 1, simply because we have six vector components. All these weighting factors are listed in the second row of Table3.
The intensity of the texture vector of jade i is given by 兩Vi兩2=
兺
j
共ajfji兲2, j= 1,2, . . . 6, 共10兲
which can be used to numerically distinguish the type of jade. The intensities of texture vector of six jades used in the experiments are given in Table4 and shown in Fig.6. From these results, six jades can be classified by different 兩Vi兩2 values. Looking at Fig. 4, jades 3, 4, and 6 contain dense structures such as textures and layers, so they have the higher兩V兩2 values. Jade 2 contains the least gray-level distribution 共f2 in Table 2兲, i.e., more dark areas or more translucent material in the jade body. Although it has clear texture, its兩V兩2value is the smallest. Jades 1 and 5 have the close兩V兩2 values; this can be explained because they both have similar signal density and more random-like textures compared to the other jades. In Fig.4共f兲, a layer of yellow texture is located 3 mm under the surface, which provides a clue for the artist when carving the jade. There seems to be no general rule for the quality estimation of different jades so far. The D value given in Sec. 3.3 could be used to evaluate the purity of a jade. However, the purest jade may not be the most expensive one. Some jades with beautiful textures are more attractive. Vector V gives a 6-D data space for the texture and optical features of the sample, which can be used as the general numerical representation of jade. Actually, by adjusting the values of the weighting factors aj in Eq. 共9兲, the classification results could be modified according to the requirement. By combining D and V, a practical solution could be reached for the specific application.
4 Summary and Discussion
Optical coherence tomography paves a new avenue for ex-ploring and analyzing the internal structure of an object. The micron-level resolution makes it unique in comparison to other tomographic imaging technologies. OCT technol-ogy has potential applications in many fields, including medical, security, environmental, and industrial. In this work, we have briefly described the principle of different OCT systems and shown the possibility of their application in jade exploration and analysis.
Jade is almost translucent in IR light, and it has internal texture associated with different types. The detection of jade can be based on this nature. Experiments show that there is a big difference, around 20 dB, of the reflected/ backscattered OCT signals between the jade body and the nonjade wrapping material. Also, almost no structure is de-tected in the nonjade material due to the weak signal. Based on the jade samples we currently have, we proposed a tex-ture analysis method using their OCT signal. Six param-eters were used to numerically describe the texture pattern of the jades. To the best of our knowledge, it is the first time the internal crossing sectional structure and texture of jade materials is extracted and analyzed.
Experimental results show that OCT technology could be a useful tool for jade exploration and analysis by ma-chine vision. For example, by drilling a tiny hole in a po-tential jade boulder and placing a fiber probe into it, the OCT system can analyze if there is jade inside and what type it could be. It will greatly facilitate traditional jade
procedures. In addition, with the help of an OCT system, it could avoid the waste in raw material preparation as well as reduce the risk in artistic carving. Another important appli-cation is the anticounterfeiting of the expensive jadeware. Although authors in Ref.15described the OCT signal
dif-ference between the real and fake jade in the whitening areas, actually, it is not enough for advanced counterfeit antique jade. The real ancient jade always carries some ooze and deposit on and under the surface, after burial for hundreds or thousands of years. People may need to further
( )"*'+ ,- *')),. /'0/1+' 23 ),%"/'& 4 55 16&'+ /7' 31+-"%' (a) (b) (d) (c) (e) (f)
Fig. 4 Six jades used in the experiments. OCT image size: 4 ⫻ 2 mm for 共a兲 through 共e兲; and 4
⫻3.5 mm for 共f兲. The small red marks denote the OCT B-scan areas. The red spots on jade indicate the A-scan positions for OCT imaging. 共Color online only.兲
Table 2 Normalized values of six parameters.
Jade 1 Jade 2 Jade 3 Jade 4 Jade 5 Jade 6
f1 Entropy 0.2941 0.2618 1.0000 0.2471 0.3088 0
f2 Half peak width 0.6543 0 1.0000 0.6543 0.6162 0.1924 f3 Std dev histogram 0.5972 0.8665 0 0.6573 0.6198 1.0000 f4 Average gray image 0.8160 0.6748 0.6288 1.0000 0.6656 0 f5 Std dev image 0 0.1882 0.5926 0.2750 0.2103 1.0000 f6 Var of image 0.6024 0.6491 0 0.6298 0.5987 1.0000
Table 3 Variances and weighting factors for each vector components.
f1 f2 f3 f4 f5 f6
Variance 0.1136 0.1307 0.1183 0.1143 0.1301 0.1042
ai 2 6 4 3 5 1
Table 4 Intensities of texture vector for six jades.
Jade 1 Jade 2 Jade 3 Jade 4 Jade 5 Jade 6
兩V兩2 27.8189 17.6935 52.3397 33.8558 25.6501 43.3324 (a)
(b)
Fig. 5 Segmented OCT images of jade 2. OCT image size: 4
⫻2 mm. 共a兲 Segment result after step 1. Many vertical thorns ap-pear unexpectedly. 共b兲 Segment result after step 2. All vertical thorns have been removed.
!"#$ %& !"#$ %' !"#$ %( !"#$ %) !"#$ %* !"#$ %+ Fig. 6 Intensities of texture vector兩V兩2calculated from six jades.
analyze the feature of these substances to distinguish the real antique jade. In addition, even for expensive nonan-tique jades, there are many counterfeiters on the market. OCT technology could also be used to recognize the artifi-cial ones by analyzing the optical and structural features. For example, miniature air bubbles exist inside many man-made jades and are normally invisible to the human eye, but could be clearly detected by OCT systems. This is our plan for future work.
References
1. D. Huang, E. A. Swanson, C. P. Lin, J. S. Schman, W. G. Stinson, W. Chang, M. R. Hee, T. Flotte, K. Gregory, C. A. Pullafito, and J. G. Fujimoto, “Optical coherence tomography,”Science254, 1178–1181
共1991兲.
2. A. F. Fercher, W. Drexler, C. K. Hitzenberger, and T. Lasser, “Optical coherence tomography—principles and applications,” Rep. Prog.
Phys.66, 239–303共2003兲.
3. W. Drexler and J. G. Fujimoto, Optical Coherence Tomography,
Technology and Applications, Springer-Verlag, Berlin共2008兲.
4. G. Smolka, Optical Coherence Tomography: Technology, Markets,
and Applications 2008–2012, BioOptics World, Penn Well Corpo.,
New York共2008兲.
5. S. Chang, X. Cai, and C. Flueraru, “Image enhancement for multilayer information retrieval using full-field optical coherence to-mography,”Appl. Opt.45共23兲, 5967–5975 共2006兲.
6. Y. Cheng and K. V. Larin, “Artificial fingerprint recognition by using optical coherence tomography with autocorrelation analysis,”Appl. Opt.45, 9238–9245共2006兲.
7. S. Chang, Y. Cheng, K. V. Larin, Y. Mao. S. Sherif, and C. Flueraru “Optical coherence tomography used for security and fingerprint sensing applications,”IET Image Process.2共1兲, 48–58 共2008兲.
8. K. Wiesauer, M. Pircher, E. Götzinger, S. Bauer, R. Engelke, G. Ahrens, G. Grützner, C. K. Hitzenberger, and D. Stifter, “En-face scanning optical coherence tomography with ultra-high resolution for material investigation,”Opt. Express13共3兲, 1015–1024 共2005兲.
9. P. Targowski, M. Gora, and M. Wojtkowski, “Optical coherence to-mography for artwork diagnostics,” Laser Chem. 2006, 35373 共2006兲.
10. A. Szkulmowska, M. Gora, M. Targowska, B. Rouba, D. Stifter, E. Ereur, and P. Targowski, “The applicability of optical coherence to-mography at 1.55m to the examination of oil paintings.” in Proc. 6th Int. Cong. on Lasers in the Conservation of Artworks (LACONA
VI ’05)共2006兲.
11. H. Liang, M. Cid, R. Cucu, G. Dobre, A. Podoleanu, J. Pedro, and D. Saunders, “En-face optical coherence tomography—a novel applica-tion of non-invasive imaging to art conservaapplica-tion,”Opt. Express13,
6133–6144共2005兲.
12. E. R. de la Rie, “The influence of varnishes on the appearance of paintings,”Studies in Conservation32共1兲, 1–13 共1987兲.
13. M. Spring, H. Liang, B. Peric, D. Saunders, and A. Podoleanu, “Op-tical coherence tomography—a tool for high resolution non-invasive 3D-imaging of the subsurface structure of paintings,” ICOM
Commit-tee For Conservation News 4, 633–640共2008兲.
14. P. Targowski, B. Rouba, M. Wojtkowski, and A. Kowalczyk, “The application of optical coherence tomography to nondestructive ex-amination of museum objects,” Studies in Conservation 49共2兲, 107– 114共2004兲.
15. M. L. Yang, C. W. Lu, I. J. Hsu, and C. C. Yang, “The use of optical coherence tomography for monitoring the subsurface morphologies of archaic jades,”Archaeometry46共2兲, 171–182 共2004兲.
16. P. Targowski, M. Gora, T. Bajraszewski, M. Skulmowski, B. Rouba, T. Lekawa-Wyslouch, and L. Tyminska-Widmer, “Optical coherence tomography for tracking canvas deformation,” Laser Chem.2006, 93658共2006兲.
17. A. Szkulmowska, M. Gora, M. Targowska, B. Rouba, D. Stifter, E. Breuer, and P. Targowski, Lasers in the Conservation of Artworks, Springer Proc. Phys. Book Series, Vol. 116, Springer-Verlag, Berlin 共2007兲.
18. M. A. Choma, M. V. Sarunic, C. Yang, and J. A. Izatt, “Sensitivity advantage of swept source and Fourier domain optical coherence to-mography,”Opt. Express11, 2183–2189共2003兲.
19. R. Leitgeb, C. K. Hitzenberger, and A. F. Fercher, “Performance of Fourier domain vs. time domain optical coherence tomography,”Opt.
Express11, 889–894共2003兲.
20. J. F. de Boer, B. Cense, B. Hyle Park, M. C. Pierce, G. J. Tearney, and B. E. Bouma, “Improved signal-to-noise ratio in spectral-domain comared with time-domain optical coherence tomography,”Opt. Lett.
28, 2067–2069共2003兲.
21. See http://nature.berkeley.edu/classes/eps2//wisc/ri.html.
22. I. Pitas, Digital Image Processing Algorithms and Applications, Wiley, New York共2000兲.
23. K. W. Gossage, T. S. Tkaczyk, J. J. Rodriguez, and J. K. Barton, “Texture analysis of optical coherence tomography images: feasibility for tissue classification,”J. Biomed. Opt.8共3兲, 570–575 共2003兲.
24. C. A. Lingley-Papadopoulos, M. H. Loew, M. J. Manyak, and J. M. Zara, “Computer recognition of cancer in the urinary bladder using optical coherence tomography and texture analysis,”J. Biomed. Opt.
13共2兲, 024003 共2008兲.
Shoude Chang obtained his BS in
elec-tronic engineering in 1977, his MS in com-munications and electronic systems in 1986 from China, and his PhD in physics in 1995 from Laval University, Canada. Most of his activities have been related to digital/optical information processing and pattern recogni-tion. As a senior research officer in the Na-tional Research Council of Canada, he is currently working on projects involving opti-cal 2-D/3-D imaging, image processing, and pattern recognition, including optical coherence tomography, medi-cal imaging, biometrics, and information security.
Youxin Mao received her BS degree in
physics and her MS degree in electronics science from Nankai University, China, in 1982 and 1985, respectively. She received her PhD in optoelectronics from Lancaster University, United Kingdom, in 1995. She was later a research associate with Lan-caster University and an NSERC visiting fel-lowship with the National Research Council in Canada. As a research scientist, she worked in an exploratory research and de-velopment group with JDS Uniphase from 1999 to 2003. She has been working on optical coherence tomography in Nankai University and the University of Toronto since 2003. She is currently a research officer for the National Research Council of Canada. Her research interests include optical coherence tomography, high speed and high power wavelength swept laser, and ultrasmall optical fiber probes.
Guangming Chang received his BA degree
in Chinese Literature from Qufu Normal Uni-versity, China, in 1982. He has been en-gaged in studying jade culture for more than 20 years, with a thousand-jades collection and many publications. He is a member of the Director’s Board of Shandong I Ching Academy, a member of the Sina Antique Jade Research Council, and a member of the Shandong Collectors Association. He is currently the chief editor of The Journal of Shandong Yingcai University.
Costel Flueraru received an MS in
engi-neering physics and a PhD in physics from the University of Bucharest 共Romania兲. Dur-ing his PhD program, he conducted re-search in the Department of Applied Phys-ics 共Applied OptPhys-ics Group兲, University of Twente, Netherlands. He was a postdoc-toral fellow at the University of Postdam, Germany, and the Max Planck Institute for Interfaces and Colloids, Berlin, Germany, where he investigated nonlinear optical properties of organic materials. He was a visiting fellow at the Steacie Institute for Molecular Science, National Research Council 共NRC兲, Canada, before joining the optics group at the Institute for Microstructural Sciences, NRC, in 2001. He is now with the Institute for Microstructural Sciences, National Research Council of Canada. Chang et al.: Jade detection and analysis based on optical coherence tomography images

![[PDF] Cours d’Algorithmique et de Langage C en PDF | Cours informatique](data:image/gif;base64,R0lGODlhAQABAIAAAP///wAAACH5BAEAAAAALAAAAAABAAEAAAICRAEAOw==)