Publisher’s version / Version de l'éditeur: Acoustics Bulletin, 35, 4, pp. 1-12, 2010-07-01
READ THESE TERMS AND CONDITIONS CAREFULLY BEFORE USING THIS WEBSITE. https://nrc-publications.canada.ca/eng/copyright
Vous avez des questions? Nous pouvons vous aider. Pour communiquer directement avec un auteur, consultez la première page de la revue dans laquelle son article a été publié afin de trouver ses coordonnées. Si vous n’arrivez pas à les repérer, communiquez avec nous à PublicationsArchive-ArchivesPublications@nrc-cnrc.gc.ca.
Questions? Contact the NRC Publications Archive team at
PublicationsArchive-ArchivesPublications@nrc-cnrc.gc.ca. If you wish to email the authors directly, please see the first page of the publication for their contact information.
NRC Publications Archive
Archives des publications du CNRC
This publication could be one of several versions: author’s original, accepted manuscript or the publisher’s version. / La version de cette publication peut être l’une des suivantes : la version prépublication de l’auteur, la version acceptée du manuscrit ou la version de l’éditeur.
Access and use of this website and the material on it are subject to the Terms and Conditions set forth at
Investigation of flanking sound transmission in lightweight building
structures using a scanning laser vibrometer
Schoenwald, S.; Zeitler, B.; Nightingale, T. R. T.
https://publications-cnrc.canada.ca/fra/droits
L’accès à ce site Web et l’utilisation de son contenu sont assujettis aux conditions présentées dans le site LISEZ CES CONDITIONS ATTENTIVEMENT AVANT D’UTILISER CE SITE WEB.
NRC Publications Record / Notice d'Archives des publications de CNRC: https://nrc-publications.canada.ca/eng/view/object/?id=715769a8-48d9-44ea-95b4-f075cbdc25ee https://publications-cnrc.canada.ca/fra/voir/objet/?id=715769a8-48d9-44ea-95b4-f075cbdc25ee
http://www.nrc-cnrc.gc.ca/irc
I nve st iga t ion of fla nk ing sound t ra nsm ission in light w e ight building
st ruc t ure s using a sc a nning la se r vibrom e t e r
N R C C - 5 3 5 9 1
S c h o e n w a l d , S . ; Z e i t l e r , B . ; N i g h t i n g a l e ,
T . R . T .
J u l y 2 0 1 0
A version of this document is published in / Une version de ce document se trouve dans:
Acoustics Bulletin, 35, (4), pp. 1-12, July 01, 2010
The material in this document is covered by the provisions of the Copyright Act, by Canadian laws, policies, regulations and international agreements. Such provisions serve to identify the information source and, in specific instances, to prohibit reproduction of materials without written permission. For more information visit http://laws.justice.gc.ca/en/showtdm/cs/C-42
Les renseignements dans ce document sont protégés par la Loi sur le droit d'auteur, par les lois, les politiques et les règlements du Canada et des accords internationaux. Ces dispositions permettent d'identifier la source de l'information et, dans certains cas, d'interdire la copie de documents sans permission écrite. Pour obtenir de plus amples renseignements : http://lois.justice.gc.ca/fr/showtdm/cs/C-42
Investigation of flanking sound transmission in lightweight
building structures using a scanning laser vibrometer
Stefan Schoenwalda Berndt Zeitler
Trevor R.T. Nightingale
Institute of Research in Construction National Research Council Canada Ottawa ON K1A 0R6 Canada
ABSTRACT
In some cases the overall sound transmission between adjacent dwellings is governed by flanking transmission and hence testing of the flanking performance of building structures is an important issue. Usually the well established indirect measurement method of ISO 10848 is applied for testing junctions of lightweight building elements like wood joist floors and gypsum board walls. Here a full-scale junction is built in a special test facility, some surfaces of the test specimen are shielded, and the sound pressure level difference between the source and receive rooms is measured. An estimate of the flanking sound reduction index of one particular path is obtained by considering the power injection, propagation attenuation of structural waves in the two coupled elements, junction attenuation, and radiation into the receiving room. In this paper a scanning laser vibrometer is used to get a better understanding of flanking transmission in lightweight building structures and of the above-mentioned mechanisms. The spatial distribution of the velocity on the surface of the structure is measured and structural power flow is investigated.
1. INTRODUCTION
The sound insulation between two adjacent dwellings that is experienced by occupants is the apparent sound insulation, which is the sum of the direct path through the separating partition and a number of flanking paths involving building elements that are coupled to the partition. Along each flanking path the airborne sound field in the source room or alternatively a structure-borne source, like people walking, excites one building element; structure-structure-borne sound is transmitted at the junction to the coupled building element that finally radiates airborne sound into the receive room. In prediction methods for flanking transmission, e.g. in EN 12354, only bending waves are considered because this wave type has an “out-of-plane” displacement normal to the surface of the building element that is typically the dominant motion for acceptance and radiation of sound by a surface. Further building elements are usually weakly coupled at the junction and only the resonant wave component, due to free bending waves, is transmitted structurally from one element to the other. In the case of monolithic homogeneous structures that are weakly damped, like concrete or masonry, the elements are usually line connected along one edge. Structure-borne sound is distributed uniformly in both the source and receive element and an estimate of the flexural energy (due to bending waves) and the power flow across the junction can be simply obtained from the mean spatial surface velocity of the elements.
But lightweight assembled building elements, like framed gypsum board walls or joist ceilings, are also used in construction for various reasons. Since they consist of multiple structural members - usually thin leaves and a framing member to provide the necessary strength – the element is no longer homogeneous and prediction models must simulate the element as multiple subsystems. The leaves of the flanking elements that are actually excited on the source side and radiate sound on the receive side usually are not continuous across the
a
junction nor directly attached to each other. Hence, structure borne sound is transmitted between the leaves via the framing members at the junction. Due to this inhomogeneity in the coupled surface and the material properties, energy is not distributed uniformly - the velocity has a strong spatial gradient especially on the leaf of the receive wall - and the velocity fields cannot be considered to be diffuse. This is discussed in a companion paper1.
In this paper the normal surface velocity is measured with a scanning laser vibrometer on the gypsum board leaf of a wood stud wall that is part of a full-scale building junction located in the NRC-IRC Flanking Facility. The specimen is excited in one room with airborne sound and the velocity is measured in an adjacent room on a flanking wall. Since the velocity on the receive leaf is due to free bending waves, the flexural intensity in the leaf can be estimated. From the power flow in the leaf valuable information is obtained on the power transmission across the junction and further different junction regimes are identified in this paper.
2. MEASUREMENT OF STRUCTURAL INTENSITY
The normal surface velocity is measured in a closed-meshed measurement grid on the gypsum board leaf of the flanking wall with a scanning laser vibrometer system. The velocity is proportional to the flexural energy of the leaf and hence areas of high and low energy can be identified. However, from the velocity plots no information can be gained about the power flow in the leaf - neither about sources where power is injected nor about sinks where power is dissipated or transmitted to other structural members of the gypsum board wall. Hence the structural intensity is calculated from the velocity distribution as briefly outlined in the following. A. Structural intensity due to bending wave propagation
The structural intensity [W/m] due to bending wave propagation in x-direction in a thin, homogeneous isotropic plate is the sum of three independent components that are product combinations of the shear force QSF, the bending moment Mx, the twisting moment Mxy and the corresponding normal velocity or angular velocity .
(1) Subscript x and y indicate the direction on the plate in Cartesian coordinates and the angle brackets the time averaging.
Further all factors - the shear force, the moments and the velocities - can be expressed in terms of the time or spatial derivatives of the normal plate displacement . The intensity component due to shear forces – the first term on the right hand side of Equation 1 - is then given by Equation 2.
! (2)
The sum of the second and third terms of Equation 1 is the so-called moment component of flexural intensity where the one due to bending moments is given by Equation 3 and the one due to twisting moments by Equation 4.
"# $ % ! (3)
&# '( $) % % ! (4)
All intensity components depend on the bending stiffness B, which for a thin, homogeneous, isotropic Kirchhoff plate is function of the Young’s modulus E, the plate thickness h and the Poisson’s ratio , and is given by Equation 5.
* +,
-. '-/0 )
(5)
In plates, energy is transported by all three components and the relative magnitude of the shear force component and the moment component depend on the presence or absence of discontinuities e.g. plate edges, joints, point connections, stiffeners etc.. However, in the far field – more than a quarter wavelength away from discontinuities – Force and moment components are equal.
B. Measurement of structural intensity with the simple 2-point method
The simple formulation for the measurement of the bending wave intensity derived by Noiseux uses the equality of the force component and the moment component in the far field and a finite difference approximation. An estimate of the active component of intensity Ix in e.g. x-direction is obtained from the velocity signals of only two points using Equation 6. The active component of intensity describes the power flow in the structure, whereas the so-called reactive component of structural intensity (which is not considered in this paper) is a measure of energy stored by bending modes.
. 1"2
345
-.
6
(6)
G12 is the cross spectrum between the velocity signals measured at two points indicated by the subscript, Im{} denotes the imaginary part, is the point spacing, and m’’ is the surface density of the plate.
When the velocity signal is measured at four points as shown in Figure 1 the bending wave intensity can be estimated in both x- and y-direction and the resultant vector of these two orthogonal components is a measure of the magnitude and direction of the flexural power flow in the centre of the four point array. The intensity component Iy in y-direction is simply given by Equation 7 by interchanging the subscripts of the measurement points in Equation 6.
. 1"2
345
78
6
(7)
For the cross-spectrum the phase relationship between the two velocity signals has to be known and thus either they have to be measured simultaneously or as in this paper the so-called frequency response technique can be applied to linear structures3. The transfer functions between the velocity signals and a reference signal are measured. The cross spectrum - e.g. G12 – is found from the product of the transfer functions Hrvi and auto spectrum Grr using Equation 8 where subscript r denotes the reference signal, vi the velocity signal at point i, and * indicates the complex conjugate.
9
-.:
;<> =:
;<9
;;?@AB :
;<CDEFC
DEE
(8)
3. MEASUREMENT SETUP
The measurements are carried out in the two story NRC-IRC Flanking Facility in Ottawa. In this facility a full-scale building junction has been built that consists of wood joist floors and wood frame walls. The wall and floor specimen separates the space inside the facility into eight rooms with four rooms on each floor. Like in real buildings sound is transmitted between adjacent rooms of the facility through the separating partition and further by a number of flanking paths as it is described in more detail elsewhere4. All measurements in this paper were carried out on the ground floor and only the wall-wall flanking path between the room SW (south-west) and room SE (south-east) is considered since measures are taken to suppress all other transmission paths – also paths through the outer shell or the floor of the facility - between the two rooms sufficiently. The orientation of the four rooms on the ground floor and there designations are given in Figure 2.
A. Test specimen
Flanking transmission through the load bearing walls separating the north and south rooms of Figure 2 is considered. All walls are single wood stud walls having studs (38x89 mm) spaced 406 mm on center. On one side of the frame, two layers of 16 mm gypsum board are directly attached to the studs. On the other side, one layer of 16 mm gypsum board is attached via resilient metal channels to the studs. The resilient metal channels are installed perpendicular to the studs with a spacing of 610 mm. The cavity is filled with 90 mm of mineral wool. A load of
4500 lbs is further applied with a hydraulic loading system to the top of both load bearing walls to simulate conditions that are comparable to junctions on the lower floors of multi-story houses.
To isolate the wall-wall path, the direct transmission path must be suppressed. Thus, the non-load bearing walls separating rooms on the East and West sides of the facility are shielded on both sides with 16 mm gypsum board on a layer of 90 mm encapsulated mineral wool. The shielding is not attached mechanically to the walls and joints between the boards are taped with aluminum tape. The ceilings of the rooms comprised of two layers of 16 mm gypsum board attached to resilient channels and thus sound transmission involving these surfaces are suppressed sufficiently, too.
B. Surface velocity measurements and structural intensity
In this paper the velocity is measured on the gypsum board leaf of the load bearing wall in room SE using a scanning laser vibrometer system (Polytec, PSV-300) when the specimen in room SW is excited with a sound system with 4 loudspeakers. A velocity scan of the complete wall for this type of excitation is shown in the companion paper1, however with a rather big measurement point spacing (300 mm) than used for the intensity measurement. Further the load bearing wall is not loaded in the companion paper. The results of this companion paper show a high velocity with a great gradient in the three bays that are closest to the junction. So this paper focuses on the structural intensity measured in the area less than 1.2 m away from the junction. The spacing between the points in the measurement grid for the intensity is only 23 mm and moreover two grids that are shifted by a half point spacing are used. Hence in total the velocity signal is measured at 8656 points and simultaneously at a reference point that is located in the upper area between the second and third stud approximately at a distance of 1.1 m away from the junction.
A FFT is performed on both the velocity and the reference signal and FFT spectra with 3200 equally spaced frequency lines in the range 2 Hz to 3200 Hz are obtained. Time averaging as well as the calculation of the transfer function and the auto spectra of both signals is done in the frequency domain. However, due to the great junction attenuation in the high frequency range and the limited dynamic range of the measurement system sensible data can be measured only in the third octave bands below 2500 Hz.
From the measurement data the components of structural intensity in x- and y-direction are calculated according Equation 6 and Equation 7 and band filtered afterwards to reduce the amount of data to third octave bands and octave bands respectively. For the calculation of the structural intensity, the gypsum board leaf is assumed to be point connected to studs so the bending stiffness is given by that of the plain gypsum board (Ex ≈ Ey =2.4e-9 N/m2, m” = 13.9 kg/m2, = 0.3) for the matter of simplicity although it is shown later in this paper that the assumption certainly does not hold in the low frequency range. Further it is shown in earlier papers, e.g. 5 that the error of the 2-point method minimizes when a point spacing of a quarter bending wavelength (0.25 B) is used. Hence the point spacing is adjusted during calculation by skipping points with decreasing frequency. Point spacing between 0.2 B and 0.3 B are achieved in all bands of the considered frequency range.
3. MEASUREMENT RESULTS A. Structural intensity in the leafs
The structural intensity is investigated on the part of the leaf that is close to junction. A detailed examination exhibited that in the third octave bands below 100 Hz the power flow shown by the obtained vector plots is not physical since the vectors are all of equal magnitude, the direction of vectors is varying strongly and the vector fields do not show a systematical power flow. This is probably due to the dominance of a few vibration modes in the leaf in the low frequency range in each third octave band and thus the vibration energy of the wall is rather reactive. This behavior is also observed in the 125 Hz band as pointed out again later in this paper. Moreover
the wood studs stiffen the gypsum board leaf in the very low frequency range along the vertical axis making the wall orthotropic which is not taken account in this paper.
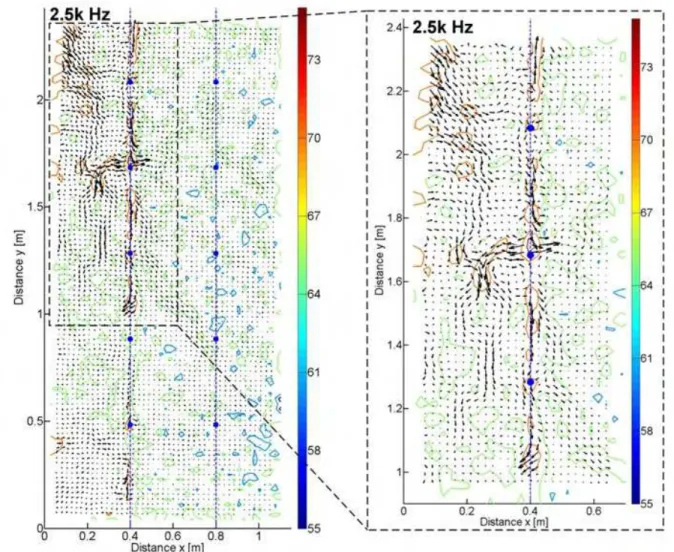
However in Figure 3 and Figure 4 intensity vector plots are presented for three different third octave bands that are representative of three different power flow regimes in the considered frequency range. The y-axis represents the position along height axis of the wall and the x-axis the distance to the junction that is located at the left edge of all vector plots. The direction of power flow is indicated by the direction of the intensity vectors and their length represents their magnitude in W/m. Since the length of the vectors is scaled differently in all plots to enhance intelligibility the color map in the background also shows the magnitude of intensity in dB re1e-12 W/m; red areas are of high and blue areas of low structural power flow. The dashed blue lines and blue dots indicate the stud positions and the positions of the screws that attach the gypsum board to the frame.
In Figure 3 at the left the measured intensity field is shown for the 250 Hz and at the right for the 800 Hz third octave band. Both have a reduced resolution of intensity vectors in both graphs to enhance intelligibility.
At 250 Hz the vector plot clearly shows that in the low frequency range most of the energy is injected into the gypsum board leaf at the left edge, where the junction is located. The intensity vectors in the left-most columns are all almost perpendicular to the junction and also their magnitude is greatest in this area. Further the vectors in the top and in the bottom rows have a comparably small y-component (direction parallel to the studs), and with exception of the left bottom corner all are either horizontal or point towards the upper or lower boundary of the leaf. In the remaining measured area, the vector field indicates that most power flows away from the junction towards the centre of the leaf. However, in some areas the resultant intensity is very low (e.g. at x = 0.5 m, y = 0.8 m) and the vectors in the centre of these areas have random direction whereas away from these areas there is significant power flow. This is typical of the presence of modal patterns. Of particular order in the plot is a small area of high intensity at the upper part of the first stud where vectors to the left and right of the stud point towards the stud. Usually, this indicates a power sink, but remember the applied intensity method is not suitable for measurements in near fields. Thus, measurement error due to the vicinity the stud cannot be fully excluded since in this frequency range the bending wavelength is much greater than the spacing of the measurement points. However further developments are necessary to exclude near field errors which is certainly out of the scope of this paper. Generally the vector field indicates that in the frequency range considered power is injected into the gypsum board leaf over the whole junction length. On the other hand at the top and bottom edge power is lost or transmitted to other structural members of the junction specimen.
At 800 Hz in the plot at the right the vectors depict a completely different power flow. The vectors in the columns close to the junction are rather undirected and certainly do not point straight away from the junction like at 250 Hz. Instead, the vectors in the top and bottom rows point towards the centre of the leaf. Here power is injected into the leaf and the magnitude of the intensity is greatest, but only less than 10 dB bigger than in the rest of the measurement area. However the magnitude is rather uniform –its gradient is much smaller than at 250 Hz – but power flow is again undirected. This suggests that in this frequency range a rather diffuse structure-borne sound field exists on the leaf. Bending waves propagating in different directions and therefore the measured net power flow is small and undirected. However the vector field shows that in this middle frequency range the continuous head and sole plates of the framing transmit structure-borne sound at the junction and inject it at the top and bottom into the gypsum board leaf.
In Figure 4 the measured intensity is presented for the 2500 Hz third octave band. At the left the vector field of the whole measurement area is shown. In this frequency range the vector field does not indicate a distinct net power flow – the structure-borne sound field is rather diffuse - and the magnitude of intensity is uniform with exception of some spatially restricted areas of high power flow in the upper left corner of the leaf and along the first stud. Since the power flow
in these areas cannot be shown properly in a plot with reduced resolution (as in Figure 3) the full measured data set is presented in Figure 4 at the left and additionally on the right the upper left corner of the first plot is enlarged. The enlarged plot clearly shows a great power flow only from two areas - the upper part of the junction, and the leftmost part of top boundary into the gypsum board - whereas at the remaining boundaries almost no energy is injected. Further power seems to flow in y-direction along the first stud, but also a series of point sources and sinks can be identified that partly match the location of the screws that are used to mount the top layer of gypsum board. At some points in-between the marked fastening points the vectors indicate further point sources – like e.g. the lowest in the plot on the right at approximately 1 meter height – which probably match with the fasteners of base gypsum board layer that are staggered and not shown in the graph. The plots show the same trend as earlier measurements conducted on a Plexiglas plate with a point connected rib that is excited structurally6. Hence the plot suggests that in the high frequency range power is injected into the gypsum board at its boundaries, only at the upper left edge and additionally farther away from actual junction at the fastening points along the studs.
B. Net power flow across the studs and from the boundaries of the leaf
In this section the measured structural intensity is integrated along various lines to demonstrate further applications of the intensity method and to confirm the results that are indicated by the vector fields. Analogously to the sound intensity method the net structural power flow across a boundary or an arbitrary line of a plate respectively can be obtained if the components of measured intensity vectors that are normal to the integration boundary are integrated.
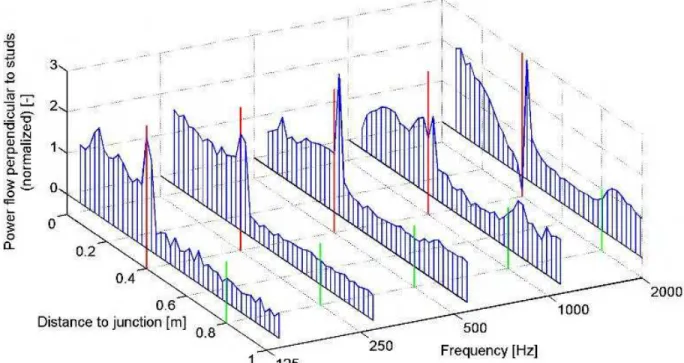
In the current case first the x-component of the intensity vectors are integrated along the columns to obtain the change of the net power flow in direction perpendicular to the studs with distance to the junction. The net power flow perpendicular to the studs is presented in octave bands in Figure 5. The net power flow is normalized to the mean net power flow – averaged for all distances - in the frequency band. In Figure 5 the red lines at a 0.4 m distance indicate the position of the first studs and the green lines at 0.8 m the position of the second stud. Positive values indicate more power flow away from the junction and negative values vice-versa. At first glance it is obvious that the change of net power flow with distance from the junction is quite different depending on the frequency range.
In the 125 Hz and the 250 Hz octave band the presented net power flow is positive at all distances and so most power propagates away from the junction. In the bay close to the junction the net power flow perpendicular to the studs is greatest and drops significantly at the first stud position. In front and behind this stud the net power flow is rather uniform and there is no significant gradient with distance to the junction. This confirms again that in the low frequency range most power is injected into the gypsum board along the junction. The drop at the first stud suggests that the studs and the gypsum board can be considered as line connected. Bending waves that are only captured with the applied method are either reflected at line-connect stud or converted into other wave types, like longitudinal or transversal waves, that do not cause an out of plane displacement of the gypsum board. The latter assumption is more likely since there is no change of net power flow due to bending waves at the second stud which is consistent with an earlier study7.
In the 500 Hz and 1000 Hz octave bands again the studs can be considered as line-connected since the net power flow drops significantly at the first stud. However, between the junction and this stud the net power flow increases perpendicular to the junction increases with distance slightly in the 500 Hz and more pronounced in the 1000 Hz octave band. Thus in this frequency range power is injected farther away from the junction by the head and sole plate into the gypsum board as already shown by the vector fields.
In the 2000 Hz octave band the change of net power flow with distance differs completely and the studs and gypsum board are point connected. In the bay that is closest to the junction the net power flow decreases strongly with distance from the junction and even has negative values – more power propagates towards the junction – just in front of the first stud. Right behind the
first stud the net power flow has great positive values that again decrease rapidly. A second increase of power flow that is also already present in the 1000 Hz band occurs at the second stud position. Thus energy is injected at the junction edge into the leaf but also farther along the studs which causes the decrease - with even negative values - of net power flow on the junction side and great positive values on the other side of the studs.
In a second step the x-components of the intensity vectors are summed along the junction edge of the leaf like in Figure 5 to obtain the net power flow from the junction into the plate. This is also done with y-components of the intensity vectors along the top and bottom rows of the measurement area to obtain the net power flow from the head and sole plate into the leaf. In Figure 6 the level difference of the net power flow from the junction and the sum from the top and bottom edge is presented. The three regimes, identified already earlier, are also indicated. In the first regime (line connected and junction is dominant source of power injection) below 400 Hz the power flow from the junction is much greater than from the top and bottom edge. The small values in Figure 6 at 125 Hz are due to a strong reactive bending wave field on the leaf and hence it was not possible to obtain a good estimate of the active structural intensity. In the second regime (line connected and power is injected at junction, head plate, and sole plate) between 500 Hz and 1250 Hz the level difference in Figure 6 is about 0 dB, hence power flow is equal and the same amount of power is injected into the leaf at the junction and at the other two considered boundaries. In the last regime (point connected and power is injected also along the studs) again the power injected by the junction is bigger. However in Figure 6 the power that is injected at the point connections between the studs and the gypsum board is not captured.
4. SUMMARY AND CONCLUSIONS
The simple 2-point method is applied to estimate the structural intensity due to bending wave propagation from the surface velocity that is measured in a closed meshed grid on the gypsum board leaf of a wood framed wall. The wall is part of a junction specimen that is used to investigate flanking transmission and during the measurement the leaf is the part of a wall-wall flanking path that radiates sound into a receive room.
The presented work is actually a feasibility study to investigate the application of structural intensity methods to lightweight framed building systems since some of the assumptions that are made in the derivation of the simple intensity method, i.e. bending wave far field on thin, isotropic homogeneous plate, are not fulfilled at all points of the plate in the whole considered frequency range. However, the obtained results are promising and consistent with findings of earlier work, thus the major part of this paper actually discusses the power injection at the junction and power flow in the gypsum board leaf of a wood framed flanking wall. An extension of the applied methods to naturally orthotropic plates, like e.g. timber, or even technically orthotropic plates, like the gypsum board walls considered, is highly desirable and certainly the goal of future research to improve the structural intensity technique further.
The presented intensity vector fields and graphs of the net power flow in the leaf that are obtained by integration of the intensity vectors along lines show clearly that transmission of structure-borne sound across a junction of framed lightweight building elements is not as simple as for homogeneous, line connected plates. Two regimes – line and point connected - are identified for the coupling of the studs and the gypsum board and there are three regimes that describe the power injection at the junction. In the current case the leaf and the studs are line connected in the low and middle frequency and in this connection regime power is mainly injected into the leaf over the whole length of the actual junction below about 400 Hz. In the frequency range between 500 Hz and 1250 Hz the same or even more power is injected along the head and sole plate of the wall frame than directly by the nominal junction. The head and sole plates of this wall specimen are continuous at the junction and hence transmit most of the structure-borne sound. Finally above 1600 Hz the leaf is point connected to the frame and in this regime power is injected only by a small area at the junction edge and at the head plate, but
additional point sources are identified in the intensity vector plots at the fastening points of the leaf along the first stud that even lead to resultant net power flow towards the junction.
Further research and measurements at different specimens are necessary for generalization of the results of this paper. However, the results of this paper indicate well that a treatment of junctions of lightweight, framed building elements as simple line connections in the whole frequency range - as suggested by EN 12354 and ISO 10848 and already discussed in detail in a companion paper1 - is neither reasonable nor valid. An alternative simple solution that covers also the power injection by the head and sole plate and at the first studs might be a definition of a connection area for each element. Since it is shown that power is actually inject in the radiating leaf far away from the actual connection of the elements the question has to be raised when considering flanking transmission between framed elements:
“Where is the building junction?”
REFERENCES
1. S. Schoenwald, “Prediction of flanking sound transmission in lightweight building structures with SEA - Conclusions on EN 12354 method”, Proceedings of Euronoise 2009, Edinburgh, UK (2009) 2. D.U. Noiseux, “Measurement of power flow in uniform beams and plates”, Journal of the Acoustical
Society of America, 47(1), 238-247, (1970)
3. J. Linjama, T. Lahti, “Estimation of bending wave intensity in beams using the frequency response technique”, Journal of Sound and Vibration, 70(1), 133-138, (1980)
4. S. Schoenwald, “Flanking sound transmission through lightweight framed double leaf walls – Prediction using statistical energy analysis”, Ph.D.-Thesis, Bouwstenen 127, ISBN 978-90-6814-611-0, Eindhoven University Press, Eindhoven, The Netherlands (2008)
5. S. Schoenwald, T.R.T. Nightingale, “Measurement of structural intensity on beam structures”,
Canadian Acoustics, 29(3), 100-101, (2001)
6. S. Schoenwald, T.R.T. Nightingale, “Measurement of structural intensity on plate structures”,
Canadian Acoustics, 29(3), 102-103, (2001)
7. T.R.T. Nightingale, I. Bosmans, "On the distribution of transverse vibration in a periodic rib stiffened plate," Proceedings of Forum Acusticum 2005, Budapest, Hungary (2005)
Figure 1: Four point array for the measurement of the bending wave intensity on a plate
with the simple 2-point method according Noiseux [2]
Figure 2: Junction, orientation of rooms in this paper (southeast (SE), southwest (SW), northwest (NW);
Figure 3: Structural intensity close to the junction in the gypsum board leaf of the load bearing wall in
room SE at 250 Hz (regime 1) and at 800 Hz (regime 2) – the color map shows the magnitude of the intensity in dB [re1e-12 W/m], the left edge of the plots is the building junction, dashed lines indicate stud
Figure 4: Structural intensity close to the junction in the gypsum board leaf of the load bearing wall in
room SE at 2500 Hz (regime 3) (left: whole area; right: blow-up of upper left edge) – the color map shows the magnitude of the intensity in dB [ref 1e-12 W/m], the left edge of the plots is the building junction,
Figure 5: Change of net power flow perpendicular to the studs (intensity in x-direction integrated over the
height of the leaf) normalized by the mean power flow in this direction – red/green lines: stud positions
Figure 6: Net power flow along the boundaries of the gypsum board leaf – level difference of net power

![Figure 3: Structural intensity close to the junction in the gypsum board leaf of the load bearing wall in room SE at 250 Hz (regime 1) and at 800 Hz (regime 2) – the color map shows the magnitude of the intensity in dB [re1e-12 W/m], the left edge of the](https://thumb-eu.123doks.com/thumbv2/123doknet/14143750.470843/13.918.119.809.111.656/figure-structural-intensity-junction-gypsum-bearing-magnitude-intensity.webp)