16‐729
“A Context‐based Procedure for Assessing Participatory
Schemes in Environmental Planning”
Guy El‐Karim Berthomé, Alban THOMAS
November 2016
1
A Context-based Procedure for Assessing Participatory Schemes in Environmental
1 Planning 2 3 Abstract 4
The efficiency of participatory schemes in environmental planning is an emerging research 5
area, and many issues are not solved yet regarding the assessment of such procedures. It is 6
essential for decision makers to identify improvement opportunities of participatory schemes. 7
We propose an original procedure to address such issue, through a bargaining model from the 8
signaling game literature, which accounts for participation design as well as for agents’ 9
preferences, beliefs and bargaining power. The model is calibrated using qualitative data from 10
surveys in French local communities involved in municipal solid waste management. Model 11
simulations are used to test for assumptions on the stakeholder dialogue and explore 12
sensitivity of game outcomes to structural parameters. We propose a set of performance 13
indicators to identify the most effective participatory schemes in achieving convergence in 14
stakeholder positions regarding environmental and land-use planning. 15
16
1. Introduction 17
18
Consultation-based management initiatives have emerged over the past decades as a response 19
to social and political factors impeding stakeholders to reach an agreement on local projects. 20
The assessment of their performance is of growing importance for public decision makers and 21
managers (Ansell and Gash, 2007), in particular because of the need to identify suitable 22
resources associated with positive outcomes of such negotiations (Wolf-Powers, 2010). 23
Providing decision makers with a scientifically sound and context-specific information 24
adapted to their needs is therefore a critical issue. However, heterogeneity in stakeholder-25
dialogue cases does not facilitate the construction of a common benchmark for guiding 26
decision makers who may not be familiar with public participatory procedures. 27
28
The efficiency issue in stakeholder dialogues has been addressed with various approaches and 29
applications (Davoudi and Evans, 2005), with few seminal works focusing on the relative role 30
of various factors on the outcome of stakeholder dialogues (Margerum, 2002; Beierle and 31
2
Cayford, 2002). Participation procedures and stakeholders’ satisfaction often stand out as the 32
main drivers of success (Smith and McDonough, 2001). Nevertheless, the literature generally 33
overlooked a large number of context variables from concertation schemes, while at the same 34
time the scope of study of local negotiations became more complex (Menkel-Meadow, 2009), 35
contributing to put forward the importance of context-based aspects of the debate (Braun and 36
Schultz, 2010). 37
38
The role of such contingent, context-based components of stakeholder dialogue was addressed 39
by some authors through approaches originating from governance studies (Koontz, 2005) or 40
negotiation (Raymond, 2006). These studies contributed to shifting attention to political 41
factors (Walker and Hurley, 2004) and the participation process design (Edelenbos and Klijn, 42
2006, Ansell and Gash, 2007), and most were taken from the literature on environmental 43
management and planning. Recent empirical analyses include Ananda and Proctor (2013) on 44
collaborative approaches to water management in Australia, van Rensburg et al. (2015) on 45
wind farm planning decisions in Ireland, Skurray (2015) on institutional arrangements for 46
common-pool resource management. 47
48
A standard approach in the economic literature consists in formal representations of complex 49
relationships between players, even though relationships between the stakeholder dialogue 50
and the outcome of the participatory scheme are often difficult to predict using simple 51
mathematical representations, as acknowledged by Mathur and Skelcher (2007). In many 52
settings, environmental planning with participatory schemes cannot be reduced to a two-53
player game with, e.g., environmentalists on one side and the industry on the other, but 54
include the principal as a third agent (Wolf-Powers, 2010). Motivations for introducing a 55
third agent (or player) include Chiu and Lai (2009), and Davoudi and Evans (2005) and 56
Saarikoski (2006) for a three-player game with a principal facing two opposing coalitions. 57
Moreover, the development of decentralized game models offered an extended perspective to 58
economists willing to analyze collaborative bargaining. In this literature however, the 59
relationship between agents does not always correspond to a participatory process. 60
61
In a majority of articles, the principal remains the first “active segment” facing agents with 62
private information, contrasting with the timing of consultation-based procedures. In the 63
3
latter, messages received by the principal may be distorted (Goltsman and Pavlov, 2008), and 64
moreover, the principal does not control the way stakeholders behave, or how they will 65
contribute (centralized or decentralized system). This justifies in particular the need to 66
characterize the principal’s attitude: neutral or not, but always in reaction to stakeholders. 67
Moreover, standard negotiation models often allow for the possibility that negotiation 68
completely fails, an option the regulator or principal tries in practice to avoid at all costs in 69
local planning procedures. Indeed, stakeholder dialogue always allows for making (little) 70
progress on some technical or managerial features of the sector or process design, such as 71
valuing some new categories of municipal solid waste in our application (see below). 72
73
In participatory processes, information transmission is not really costly, there is partial 74
cooperation and always partial results from the negotiation. These limitations justify in our 75
view the use of a cheap talk model à la Crawford and Sobel (1982), where information is 76
transmitted between agents through ordinary, informal signals, before the final decision is 77
made. Cheap talk can be seen as a way to reach, in some circumstances, more proximity 78
between parties in a negotiation (Messer et al., 2013). In order to model the interactions 79
between agents involved in stakeholder dialogue, we consider an original approach based on a 80
signaling game, formally close to an extension of Alonso et al. (2008). It is necessary 81
however to augment this model by introducing negotiation power and familiarity among 82
players, considering a greater variety of dialogue modes. Based on this, the cheap talk 83
approach can be reinterpreted in such a way that it shares similar features with actual 84
stakeholder dialogue situations. Although the modeling strategy introduced in this paper is far 85
from sufficient for representing the complexity of agent interactions, we believe it is an 86
original methodological step in an effort to explore stakeholder dialogue effectiveness. 87
88
The complex nature of stakeholder dialogues requires a detailed characterization of agents’ 89
preferences, beliefs, and other drivers of their behavior. An additional contribution of the 90
paper is therefore to present an original method to calibrate a cheap talk model, including the 91
major determinants behind negotiation objectives and outcomes, with qualitative data 92
obtained from field surveys. However, for calibration purposes, we consider not only 93
information on stated preferences collected from stakeholders, but also revealed evidence 94
4
gathered during negotiation by means of a survey.1 The cheap-talk model is calibrated by 95
converting such qualitative survey data to numerical values, on each of three selected study 96
areas. Predictions from the theoretical model are then obtained by a numerical root-finding 97
algorithm. We consider as an empirical application the case of municipal solid waste 98
management in France, as an illuminating example of environmental planning where 99
stakeholder attachments are often clear cut, even incorporating a sophisticated amount of 100
expertise during the stakeholder dialogue. 101
102
A final contribution of the paper is a method of performance assessment associated with 103
stakeholder dialogue in environmental planning. Assessing the performance of participatory 104
schemes is a challenging task, and this paper does not propose a comprehensive and generic 105
method for evaluating such negotiation-based procedures. Rather, we consider only two 106
indicators of performance that are relevant to facility siting process in environmental 107
planning: the degree of convergence in the positions of opposing stakeholder groups, and the 108
intensity of capital investment achieved through dialogue. We discuss in the paper the 109
motivation for these indicators in relation with the literature on collaborative policy making. 110
111
The outline of the paper is as follows. Section 2 describes the way stakeholder dialogue is 112
typically used in environmental and land-use planning, in particular in local solid waste 113
management. We also present in this section the survey method and the study areas: three 114
French sites concerned with municipal solid waste management. The cheap talk model is 115
presented in Section 3 with its assumptions on preferences and dialogue modes, and the 116
derivation of final outcomes. In Section 4, we present the calibration exercise, and we discuss 117
the model simulation and validation checks. Section 5 concludes. 118
119
2. Stakeholder dialogue in controversial environmental planning, with an 120
application to waste management
121 122
The upgrading of public services that rely on infrastructure subject to the NIMBY (Not In My 123
Backyard) phenomenon often gives rise to difficult local negotiations (Feinerman et al., 124
1
The advantages of in-depth interviews with stakeholders are also discussed by Avci, Adaman and Özkaynak (2010).
5
2004). Because of comparable difficulties in policy making, the design of participatory 125
procedures for achieving a collective agreement is not fundamentally different for a wide 126
range of projects impacting the environment (industrial hub, landscape-modifying 127
infrastructures, transportation, tourist facility, waste management, water dam, etc.) 128
129
The usual features of stakeholder dialogue in environmental planning
130 131
It is interesting for local planners, when they have the opportunity of designing their own 132
procedure, to know which participatory scheme is preferable, regarding in particular the 133
probability of success. Participatory approaches at the local level correspond broadly to a 134
stakeholder dialogue, and in most developed countries a typical procedure for environmental 135
planning can be described as follows. Stakeholders are involved in a series of participatory 136
sessions (public hearing, working group, public event, open forum, etc.) during a process 137
which can take several years. In practice, the process starts with a proposal from a company 138
(public or under delegation) in charge of the facility design and/or upgrading investment. 139
Such proposal is a combination of technical, financial and management options together with 140
a size of operation, which can in principle all be opposed by (some) stakeholders. 141
Stakeholders respond with counter-proposals consisting in required modifications on some 142
components of the project design. If proposals and counter-proposals made by stakeholders 143
for facility siting or upgrading investments do not converge to a satisfactory outcome for the 144
majority of stakeholders, then this long and iterative process produces poor results. In the case 145
of a more successful outcome, then the participatory process succeeds in achieving a final 146
outcome in the form of a larger set of new management provisions, which have been subject 147
to negotiation and approval by both sides. In case of real success, the fraction of strong 148
disagreement remaining among groups is expected to be small. 149
150
Municipal solid waste is often considered an “environmental bad” (Davoudi, 2000; Feinerman 151
et al., 2004) implying political, economic and cultural aspects (Bulkeley et al., 2005; Wagner, 152
2011). It is less the choice of the management mode in itself that matters in practice, than 153
aspects of quality of life and environmental conservation, technical process safety and 154
efficiency. Management decisions for municipal solid waste are often conditional on public 155
participation procedures (Petts, 2004). As these procedures can be in practice difficult and 156
6
subject to major sources of conflicts (Wiedemann and Femers, 1993), it is a particularly 157
interesting sector for exploring the performance of participatory schemes implemented for 158
environmental planning. 159
In a way similar to the general procedure presented above, in the case of municipal solid 160
waste management, an operator in charge of the public service of waste collection and 161
disposal has at some point in time to upgrade the waste management system on a large area. 162
In France for example, this operator will be acting on behalf of an association of local 163
communities in a given district. In cases where the operator faces opposition from local 164
residents, and/or lacks expertise or space to deal satisfactorily with solid waste, the operator 165
can initiate a consultation procedure, opening a dialogue period among numerous 166
stakeholders. 167
168
During the stakeholder dialogue, stakeholders exchange over various aspects of the design of 169
a project. Such design has a particularly sophisticated nature, as environment-related projects 170
have typically to deal jointly with several resource flows and are characterized by various 171
intermediate stages (transformation, transportation, collection, possible marketing of co-172
products, etc.). Moreover, besides investment in new or upgraded capital stock, management 173
options may also be modified, e.g., modified procedures for labor management and 174
supervision, expertise and capacity building. Hence, aspects related to human capital are part 175
of the project features that are relevant to the dialogue among stakeholders. 176
177
Consider for instance the main issue of dealing with the interdependencies between the 178
different flows, reclamation and treatment facilities of the waste management system, i.e., 179
complementarities in the logistic chain. On this aspect, some stakeholders on one extreme will 180
prefer a single final treatment of waste that reduces coordination problems, while at the other 181
extreme other stakeholders will be in favor of diversification of industrial solutions, implying 182
more difficult coordination issues. On the basis of such oppositions among stakeholders, 183
groups are formed among stakeholders that will defend a project design according to 184
(presumably fairly homogeneous) internal preferences. Groups are then pushing for outcomes 185
that remain distinct, but not necessarily far apart from each other at the end of the process, if 186
successful. 187
7
Our framework seems to be more consistent with European waste management systems than 189
North America regarding waste treatment aspects. Indeed, the variety of possible disposal 190
options is much wider in European countries. According to Hoornweg and Bhada-Tata 191
(2012), sanitary landfill accounts for about 27 percent of solid waste disposal in Europe but 192
91 percent in North America, while open dump and incineration represent a significant part of 193
waste treatment in Europe but are almost nonexistent in North America. This implies that the 194
planning issue in North America is limited, in the case of solid waste treatment, to the choice 195
of a landfill site than in the European case. 196
197
Main variables influencing stakeholder dialogue
198 199
Whatever counter-proposals stakeholders are put forward during the process, they are always 200
related to their preferences or objectives, typically assumed stable private information in the 201
literature. We consider in this paper that both terms (preferences and objectives) are 202
equivalent, as we do not explore multiple objectives from the same economic agent. 203
Stakeholders’ moderation, or on the contrary extremism, in their preferences may determine 204
whether consultation is worth trying (Krishna and Morgan, 2001; Mitusch and Strausz, 2005). 205
In the economic literature, the discrepancy between agents’ objectives is the preferred 206
determinant of the poor quality of information exchange between participants to the 207
negotiation, even under incomplete information (Goltsman and Pavlov, 2008). As in any 208
negotiation with participants sharing different objectives, their messages are likely to be 209
strategically designed for the state of negotiation. Hence, during stakeholders’ dialogue, 210
private information can be revealed but not necessarily verified. 211
212
Other determinants than stakeholders’ own preferences or objectives are likely to play a role 213
in the building of their proposals and communication to other stakeholders. As noted by 214
Ansell and Gash (2007), the stakeholders’ level of commitment to collaboration is related to 215
the motivation to participate in collaborative governance, the legitimacy of the project, or the 216
fulfilment of a legal obligation. Therefore, the shared need for negotiation to succeed may 217
explain the will of participants to reduce the difference between one’s own outcome and the 218
opponent’s one. The initial state of management or the lack of proper infrastructure may thus 219
imply some pressure on stakeholders to engage in a dialogue. Another factor may also be the 220
8
distribution of bargaining power or influence across agents engaged in negotiation, which 221
sometimes plays a more important role in the process than the difference between agents’ 222
interests (Van Bommel et al., 2009). 223
224
The literature on collaborative bargaining has identified several other dimensions of 225
importance for analyzing participatory schemes beyond preferences, pressure to collaborate, 226
and bargaining power. These additional dimensions concern a) the role played by the 227
principal, e.g., environmental planner in our framework, and b) the type of relationships 228
between players in the bargaining game. 229
230
First, the principal’s attitude is emphasized as a major determinant for agents to agree to 231
collaborate (Margerum, 2002; Petts, 2004; Ansell and Gash, 2007). Moreover, the position 232
granted to the principal and, more generally, whether the consultation takes place in a 233
centralized or decentralized setting, also matters (see, e.g., Bourdeaux, 2007). In this respect, 234
Suh and Wen (2009) link bargaining power with the way the game is structured. Second, 235
familiarity among stakeholders is likely to modify the outcome of a planned consultation, 236
mainly because of a more transparent bargaining environment instead of a conflict-driven one 237
(Wiedemann and Femers, 1993; Bouwen and Taillieu, 2004; Braun and Schultz, 2010). 238
However, the implementation of a more familiar interaction between agents does not prevent 239
interplay among basic factors, such as non-compatible interests or bargaining power (Lejano 240
and Ingram, 2009; Maguire and Lind, 2003), or the difficult context of a bargaining procedure 241
(Nicklin et al., 2011). Besides such other variables, familiarity between stakeholders will 242
eventually concern the volume and quality of the information shared by stakeholders (Reimer 243
and Hoffrage, 2006). 244
245
A benchmark for relative performance of participatory schemes
246 247
Building upon the discussion above, we consider the issue of assessing the performance of 248
participatory schemes in environmental planning, taking as observed outcome a series of 249
management decisions that has become acceptable to parties. Such outcome is based on the 250
new components of management project, upon which each group consents to at the end of the 251
dialogue, rather than obtaining at all costs decisions that are in line with their initial objective. 252
9
We suggest selecting as a first performance indicator the deviation from initial objectives to 253
final outcomes reached, which may be considered a form of convergence. The gap between 254
the initial objective and the outcome for each stakeholder group is an indicator of the 255
concessions made. Another indicator is the intensity of capital stock investment associated 256
with the final agreed-upon components of the management project. Performance in this case 257
is expressed as the ability for the participatory process to move away from a dead-end 258
situation (blocking in practice some components of new capital stock), precisely by reducing 259
the gap between the management provisions (or outcomes) accepted by each group. Biddle 260
and Koontz (2014) correlate the outputs from collaborative governance processes with 261
stakeholders’ participation in the case of watershed-level water quality management. They 262
show that collaborative processes with stakeholder participation can provide intermediate 263
outputs of pollution reduction goals that serve as proxies of environmental outcomes. 264
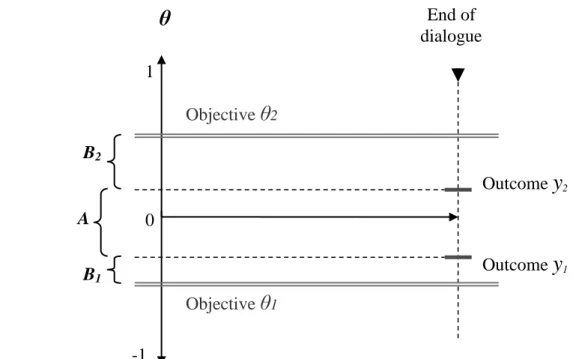
Figure 1 presents the initial objectives, final outcomes and displacements for both players (B1
265
and B2). The gap between the final outcomes (A) defines the magnitude of unachieved
266
concessions between parties, and in a complementary way the investment in capital stock that 267
is ultimately achievable can be denoted the outcome of the process. 268
269
[FIGURE 1 ABOUT HERE] 270
271
Ultimately, these two performance indicators are originating from the need to upgrade 272
facilities in an initial situation of poor management performance. The final objective of the 273
environmental planner may be seen as the performativity (Callon, 2010) of a new 274
management system and its environmental rearrangement. We follow here Beierle (1999) and 275
Leach et al. (2002) who recommend as a benchmark for performance assessment the common 276
social objective arising from a critical situation (a bad initial management state). As noted 277
above, the participatory initiative may be considered a means to upgrade local management 278
capacities for solid waste. The initial issue shared by all concerns the improvement of the 279
proportion of waste taken care of (collection, diversion, treatment) by the community (within 280
a common waste management network), reducing its undesirable impacts. 281
282
We assume that the common social goal lies somewhere between extreme stakeholder 283
preferences, as some linear combination of stakeholder welfare objectives. Such social goal is 284
10
not identified however, because stakeholder preferences and the associated weights in the 285
social welfare function are not observed, and would require dedicated revealed or stated 286
preference elicitation procedures. Therefore, we can only consider that it is “socially 287
desirable” that stakeholder positions converge towards each other, even though the final 288
outcome may not reach a socially optimal position. 289
290
Consequently, a concerted management initiative can be considered successful not only 291
because it allows for a higher level of acceptable solutions to be possible (investment in 292
management renewal, A in Figure 1), but also because negotiation allows stakeholders to 293
partly converge towards the final outcome (stakeholder displacements B1 and B2 in Figure 1,
294
see Leach et al., 2002). 295
296
The investigation method and study areas
297 298
In order to explore the performance of consultation-based management procedures applied to 299
municipal solid waste management, it is necessary to conduct a thorough analysis of the 300
dimensions described above. Instead of considering a large sample of municipalities with cost 301
of data collection issues, we select a limited number of study areas (three sites), paying 302
attention to their differences in terms of management modes and intrinsic characteristics. 303
Some aspects of collaborative participation have to be distinct in order to identify sources of 304
management performance. However, at the same time, the study areas need to have some 305
features in common so that some homogeneity in model parameters (and/or assumptions) can 306
be expected. We first identified the list of all (26) on-going participation-based procedures for 307
municipal solid waste management in France in 2005 and 2006 (with the support of experts 308
from ADEME, the French Agency for Energy and Waste Management). Three areas were 309
selected out of this list, based on criteria such as the existence of a consultation-based 310
procedure involving several stakeholders who engage in this form of dialogue. 311
312
Study area 1 is located in the central-east region and covers several geographical areas, of 313
which only one can be considered industrial in nature. The population covered is between 314
250,000 and 300,000 inhabitants. Study area 2 is located to the south-west and is also 315
heterogeneous in terms of geographical features, from a coastal urbanized zone to the west, a 316
11
rural landscape to the east, and a population between 200,000 and 250,000 individuals. Study 317
area 3 is a site located to the north-west of the country and includes only coastal local 318
communities, with a population a little over 50,000 individuals at the beginning, but the 319
planning reflection subsequently extends beyond 150,000 individuals. 320
321
To explore the heterogeneity of the population in the three study areas, we collected data from 322
INSEE (French Institute for Statistics and Economic Analysis) at the district level, to match 323
the corresponding geographical areas. The population characteristics in the three study areas 324
are remarkably homogeneous in terms of annual household median income (19,903 euros, 325
18,542 euros and 18,608 euros for study area 1, 2 and 3 respectively) and income interquartile 326
range (3.95, 3.96 and 3.87 in study area 1, 2 and 3 respectively). Concerning education, the 327
proportion of adult population with a higher education degree ranges from 21.62 in area 2 to 328
22.63 in area 3, and the proportion of adults without any degree is respectively 15.63 in area 329
1, 15.50 in area 2 and 10.86 in area 3. Only population density is fairly different across those 330
study areas, with respectively 154.65, 141.00 and 182.47 inhabitants per square km for area 1, 331
2 and 3. Therefore, the requirement that study areas should be fairly homogeneous (for 332
parameters to be assumed common) seems to be satisfied. 333
334
Our field survey consisted of two waves: first, a 6-month exploratory survey at the end of 335
2006, with direct interviews on the three study areas with local managers, scientific and 336
technical experts; second, at the end of 2008, the main field survey was conducted. It included 337
about 50 semi-direct interviews, the visit of the major treatment facilities in operation, and a 338
collection of published material related to the municipal solid waste management project in 339
the local media, over the period of the dialogue (2000-2008). This information was 340
supplemented by numerous technical reports (public or for internal use), providing us with 341
data capturing the diversity of stakeholders and of their positions involved in each study area. 342
343
In all three sites, the stakeholder dialogue runs over 6 to 7 years and shares similar stages, 344
from the creation of a waste management agency between 2000 and 2002, to the provision of 345
substantial funding of new waste facilities between 2008 and 2012. In all cases, the dialogue 346
has been initiated by an elected administrator, playing most of the time the role of the 347
principal of the game. Thanks to this quasi-ethnographical survey, we were able to distinguish 348
12
between two stakeholder coalitions in each study area, each defending technical and political 349
objectives (Weible, 2006). Our results on these preference points are consistent with previous 350
results in Davoudi and Evans (2005), Davoudi (2000) and Saarikoski (2006). Although the 351
stages look similar across the study area, the actual negotiation processes were fairly different 352
because of heterogeneous contexts, participatory schemes, and positions taken by 353
stakeholders. 354
355
Field surveys revealed that stakeholders have different objectives regarding 356
a) spatial localization of management efforts and infrastructures, 357
b) comparative technical performance of the solid waste management solutions, 358
c) management system: internal complementarities in the logistic chain and 359
interdependencies, even outside the management area, 360
d) manageability of health and environmental impacts, 361
e) quality aspects, and more broadly the motivation to go beyond standard 362
management practices, 363
f) information and relations between the solid waste management agency and the 364 public, 365 g) financial aspects. 366 367 3. The model 368 369
There are two groups of agents, j=1, 2, each with message m and associated outcome j y , j
370
which we normalize according to the standard cheap talk literature: mj, yj∈ −
[
1,1]
. The 371model represents a dialogue as a set of agents’ interactions according to a three-stage game, 372
and we make the simplifying assumption that each group is homogeneous, so that each group 373
of agents is considered a player. In stage 1, each player identifies its initial objective denoted 374
j
θ . In stage 2, messages
{
m m1, 2}
are sent by players, either directly to the principal in the 375centralised case, or to each other in the decentralised case. In stage 3, outcomes y and 1 y are 2
376
observed and the game ends. The main difference between both versions of the game is that, 377
in the centralized case, the principal determines the preferable outcome
{
y y1, 2}
from 37813
messages
{
m m1, 2}
according to her own attitude, whereas in the decentralized case, the379
principal leaves the coordination task to the players. In the latter case, the principal expects 380
players to look for outcomes that are more coordinated than their initial objective
{
θ θ1, 2}
381because players are concerned about welfare improvement from negotiation. In each case, one 382
can make behavorial assumptions on the principal and/or on the players. 383
384
We assume players’ preferences depend on several aspects: their “selfish” interest in seeing 385
the outcome as close as possible to their own objective, the need for the negotiation to 386
succeed, and the consideration for the other player. The second aspect accounts for the loss 387
each player would incur if an agreement is not reached and the negotiation fails. Presumably, 388
the more serious the local environmental situation, the higher the probability that players will 389
find it ultimately necessary to make a compromise. Therefore, each player is also seeking to 390
reduce the difference between her own outcome and the opponent’s one, which is driven only 391
by the (selfish) need for negotiation to succeed. 392
393
From these assumptions, the payoff function of payer i, i=1, 2, is: 394
(
)
2(
)
2i yi i yi y i
π = − −θ −δ − − , (1) 395
where δ ≥ . The third aspect related to the consideration for the other player translates into a 0 396
weighted function of payoffs from both players being maximized. While the second 397
component of preferences could be considered intrinsic because it refers to the gain or loss for 398
the player in case final claims are too far apart, the third component is directly associated with 399
some form of openness typical of concerted (or participatory) setup. More precisely, the 400
player can be interested in seeing the other player being acknowledged for what he claims as 401
legitimate, and then receiving a minimum payoff from dialogue, even though this will not 402
guarantee that her own payoff will not be lower (or higher). Let λi denote the weight put by 403
player i on her own payoff, with 1− the weight on the other player’s payoff, which then λi 404
represents their consideration for others. Each player would finally maximize 405
(
1)
i i i i
λ π + −λ π− with respect to message m . i
406 407
Consider now the preferences of the principal, who can be considered either neutral (in the 408
same sense as the game-theory) or “soft”, in a sense we define below. The neutral principal 409
14
puts equal weight on both players; he maximizes E +π π1 2 m , with πj the profit function 410
of player j and m=
{
m m1, 2}
. On the contrary, a “soft” principal leaves to each player the task 411of expressing the weight or consideration the other player deserves, instead of forming an 412
objective function based on the principal’s equal consideration for both players. The soft 413
principal would then maximizeE −
(
1λ π
2)
1+ −(
1λ π
1)
2 m, where 1− is the weight or λi 414consideration associated by player i with the other player case. We assume that 415
0, 1, 2,
i i
λ− > = (i.e., each player has minimum consideration for the other one).It is important 416
in addition to note that it is not only the nature of the principal (neutral or not) that matters, 417
but the perception the players have on the nature of the principal regarding neutrality or not. 418
Then, there are four subcases of the centralized case to consider: i) the principal is neutral and 419
considered as such; ii) the principal is “soft” and considered as such; iii) the principal is 420
neutral but considered “soft” by both players; iv) the principal is “soft” but considered neutral 421
by both players2. In each subcase, players 1 and 2 determine their best signal to send to the 422
principal, given the perceived behavior of the principal. 423
424
Our definition of a “soft” principal contrasts with the framework of Calcott and Hutton 425
(2006), who examine the possibility that principals may be biased against projects (even 426
efficient ones), and analyze the relationship between environmental liability regime and the 427
possibility of harsher regulation in regulatory gatekeeping. They show that adopting a soft 428
liability regime does not compensate in general the regulator’s bias against projects. In 429
contrast, the principal in our framework may be neutral or soft, but only with respect to the 430
weights associated with players, as described above, and not with respect to regulation 431
enforcement as in Calcott and Hutton (2006). However, the possibility they consider of a 432
biased principal (towards some projects or stakeholders) could be an interesting extension of 433 our framework. 434 435 2
In our model, we assume that the principal treats both players identically, even when he is “soft”, and that players perceive the principal as acting symmetrically over both players. It is also possible to consider the case of players perceiving differently the attitude of the principal (neutral or soft). Because dealing with all possible cases would complicate the analysis, we do not consider such additional case, although adapting the present model would be feasible. Instead, we deal only with the presumably more common cases, namely, that the principal is perceived identically by both players. Furthermore, as we will show below, differences in those dialogue sub-modes have a lower impact on performance as other parameters, so that it is likely that including this case would not significantly modify our results and conclusions.
15
Second, consider the decentralized case, where the nature of the principal does not matter. On 436
the contrary, it is the degree of familiarity of players regarding their opponent that matters. 437
Player j may believe that the other player has the same “perception” of the situation as himself 438
or not, depending on whether players are familiar with each other (through, e.g., previous 439
interactions and experience). If players 1 and 2 do not have reasonable knowledge of each 440
other, we assume that player 1 believes that player 2 shares with him the system of weights λ1 441
for player 1 and
(
1−λ1)
for himself. And similarly for player 2, who would believe player 1 442to share his system of weights λ2 and
(
1−λ2)
. If however, there is some degree of 443knowledge between both players, then each player would use this information. For example, 444
player 1 would still apply weights λ and 1
(
1−λ1)
, but would acknowledge the fact that player445
2 uses the system of weights λ2 and
(
1−λ2)
, and symmetrically for player 2. 446447
Combining centralized and decentralized cases, we now deal with eight possible dialogue 448
modes: the principal is neutral/soft and perceived as neutral/soft by the players, there is 449
reciprocal familiarity/no familiarity across both players, and player 1(2) is familiar with 450
player 2(1) but player 2(1) is not with player 1(2). In all cases, player j will design his 451
message in such a way that the receiver will select the best possible outcome for player j. In 452
what follows, we will make the important (and in our opinion, realistic) assumption that each 453
player develops, in a symmetric way, an inference upon the inference the other player is 454
making. We proceed in three steps. First, we characterize the outcomes observed at the end of 455
the dialogue process, taking as given the inference adopted by players. Second, we 456
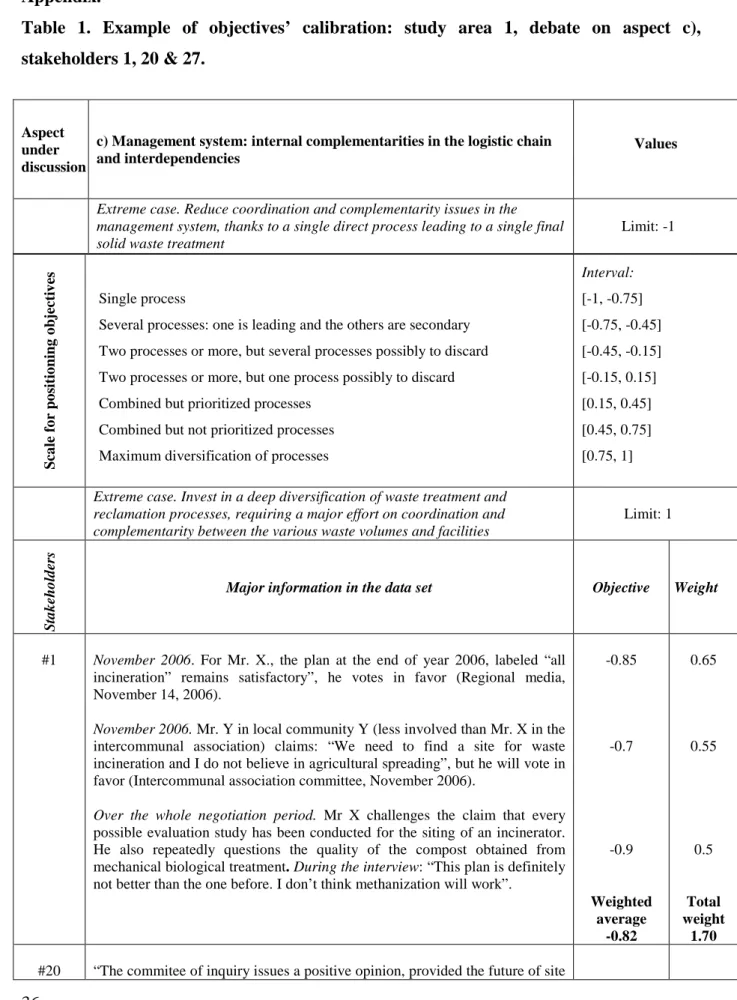
characterize the inference upon which players base their messaging strategy, i.e., the way they 457
use available information given their preferences and perceptions. Third, we solve the model 458
for optimal messages and outcomes by replacing inferences by their expression. 459
460
Details of the model solutions are presented in the Appendix. 461
462
4. Model calibration and simulation 463
16
We first discuss in this section the method used to calibrate our messaging model. Since the 465
model is based mostly on unobserved preferences, beliefs, bargaining power, willingness for 466
agreement, the way to proceed departs from usual structural econometric approaches. We use 467
in-depth qualitative surveys in the three study areas presented in Section 2, to construct proxy 468
variables for the components of the model, that is, the initial objective of player j, θj, the 469
weight placed by player j on himself, λj – thus the weight he assigns the other player (1-λj) –
470
and the willingness or pressure for agreement, δ .
471 472
There are eight possible dialogue modes, depending on players’ vision of the attitude of the 473
principal (centralized case) and on players’ familiarity with each other (decentralized case). 474
This yields eight additional parameters if we consider the probability associated with each 475
case. In terms of outcomes, concessions
{
y y1, 2}
reached at the end of the stakeholder 476dialogue process can be considered dependent “observed variables”. 477
478
The calibration of the above parameters is a major effort in the present work, which is 479
justified in our view by the complex nature of stakeholder dialogue, and by the lack of 480
empirical data from actual concerted experiences (cf. Kontoleon et al., 2002; Money and 481
Allred, 2009; French and Bayley, 2011). As pointed out by Thomson et al. (2007), the 482
performance of planning procedures can be assessed from a quantitative analysis of 483
components of the dialogue and its observed effects. The usual way of collecting information 484
on planning procedures is to conduct a direct qualitative survey of stakeholders and decision 485
makers (including possibly the public). On solid waste management issues, standard 486
techniques such as the Analytical Hierarchy Process (Strager and Rosenberger, 2006; Ananda 487
and Herath, 2008), Likert-scale questions (Thomson et al., 2007), or nonparametric test 488
procedures (Garmendia and Stagl, 2010), have been employed. Collecting information 489
directly from stakeholders can lead to strategic and cognitive biases (Watkin et al., 2012; 490
Paolisso, 2002) that can partly be controlled for by using post-survey validity-check 491
procedures (consistency ratio). 492
493
In our case however, we use interviews of individual stakeholders, but also an overview of 494
their real options and concessions in the course and at the end of negotiation (see Table 1 in 495
17
the Appendix for examples of data collected). As described in section 2, the calibration draws 496
on separate but related data sets (as in Masuda et al., 2008). The first data set consisted of 497
printed documents including exploitation and local planning reports, articles from local 498
newspapers, promotional material, etc., over the years 2000 to 2008. The second data set was 499
a group of interviews with all of the relevant participants, and the visit of the major solid-500
waste treatment facilities. These data sets are then integrated into the same calibration 501
protocol, which ultimately yields the quantitative results presented in Table 2. We are 502
therefore in a position to revisit the consistency of stakeholders’ engagement throughout the 503
negotiation phase. Therefore, for each variable or parameter to be quantified, we first proceed 504
to select (and order) relevant data to calibrate. We then construct a cardinal notation scale 505
which is specific to each variable or parameter, and we can assign at the end a score to each. 506
507
According to the existing literature, the discrepancy between groups’ interests is a major 508
factor for explaining the success or failure of a negotiation. It is a particularly challenging to 509
quantify the collective objective of each group, and we have seen in Section 2 that this 510
variable is grounded on seven management aspects considered particularly important because 511
the most often cited in debates. 512
In Table 1 (Appendix), we illustrate the calibration method on the example of aspect c) 513
(Management system complementarities between processes, described in section 2). Table 1 514
is a significant reduction in size from the original collected data, as it only deals with a single 515
aspect (out of seven), a single study area (case 1) and only three stakeholders (out of 30) are 516
represented. A range indicator specific to aspect c) is constructed, by selecting the extreme 517
positions recorded during the negotiation phase (as in Biddle and Koontz, 2014), from one 518
extreme (a single process) to the other (multiple and simultaneous processes). These two 519
extreme indicators are then rescaled to lie between -1 and 1. It is used to locate each player on 520
the [-1, 1] scale according to his stated options during the negotiation compared to the lower 521
or upper bound of the range (column Objective in Table 1). 522
523
Since player objectives are expressed or observed several times and on multiple aspects (see 524
Awakul and Ogunlana, 2002), an aggregation procedure is required, based on the relative 525
importance of each of their positions. This is the purpose of column Weight in Table 1. 526
Weighting scales can be constructed for each stakeholder by using ordinal information from 527
18
the survey in order to state whether a particular aspect is equally, more or less important than 528
another for a given stakeholder (as in Li et al., 2012). For example, decisive and irreversible 529
votes have more weight than oral statements, even the more so when the latter are not 530
repeated or confirmed by subsequent actions. 531
Once preference indicators are computed for each stakeholder, we assign stakeholders to two 532
groups using a similarity procedure. We perform a parametric significance test on the 533
difference between the stated preference of a particular stakeholder and the average 534
preference indicator of his alleged group, to check for inconsistent assignment. In our three 535
study areas, solid waste industrialists and technical consultants always belong to the same 536
group (Group 1), and their location within this group is always strong. The public and elected 537
local authorities are distributed across both groups, and their location is almost never 538
“extreme”. On the other hand, environmental associations and public planning authorities turn 539
out to have a fairly “extreme” location when belonging to Group 2. Once groups are formed, 540
they are considered players in our game, as explained in Section 3. 541
542
The same way as for preferences, we also need to calibrate parameters λj representing the 543
considerations each player has for the other. They are quantified in a similar manner to the 544
procedure above, by constructing a range of values from salient features reported in our 545
dataset following the management process. We account for the negotiation power each player 546
is likely to have (and believes the other player has). 547
548
Another parameter to calibrate is δ , measuring the willingness of players to reach an 549
agreement. The value of this variable therefore depends on the management and policy habits 550
and arrangements prevailing on the particular site at the beginning of the dialogue. We are 551
actually calibrating exclusively the external pressure on players that makes them more 552
inclined to endorse the final outcome. This is the difference with the “social pressure to 553
collaborate” of Suzuki and Iwasa (2009), who include also internal factors (such as 554
interpersonal relationship between stakeholders). In economic terms, such pressure would be 555
interpreted as a way to offset the “coordination loss” between agents. Parameter values are 556
then discussed with and validated by communication experts who were involved in these 557
study areas (a consulting firm on cases 1 and 2 and an independent consultant on cases 1 and 558
3). 559
19 560
Concerning the dialogue modes, we have seen above that we can consider eight possibilities. 561
The qualitative surveys allow us to evaluate the relative frequency of every mode in the three 562
areas, each exhibiting a particular combination of these modes. The relative frequency 563
associated with each mode is distributed in a fairly homogeneous way across cases, between 564
0.07 and 0.2. From there, we can compute an expected outcome level, using as weights the 565
empirical relative frequency (rate of occurrence) of each mode. All modes may be 566
simultaneously present to form a final outcome matrix. In order to obtain a synthetic formula 567
for the final outcome, we assign to each dialogue mode g, g=1, 2,…,8, its positive weight βg 568 such that 8 1 1 g g g
β
= = =∑
. We then compute an average outcome – which corresponds to a 569particular participatory scheme – as 570
(
)
8 1 2 1 2 1 , , , , g g g g Y β θ θ λ λ δ = =Σ
, (2) 571where Yg
(
θ θ λ λ δ
1, 2, 1, 2,)
denotes the theoretical solution depending on contextual 572parameters and players’ parameters in dialogue mode g. 573
574
We mentioned in Section 2 that our performance indicators for participatory schemes are the 575
reduction of the gap (“displacement”) between initial player objectives, and the level of 576
investment observed in the final outcome. As for other variables, interviews and field survey 577
data are used to quantify these two performance indicators. For the “displacement” variable, 578
we account for three components: the range of the displacement, the stakeholders’ awareness 579
or lack of information about what they are giving up, and the reversibility of the displacement. 580
As far as the level of investment in solid waste management is concerned, we consider four 581
components: technical, logistic and economic capacity building; organizational, 582
administrative and legal benefits; new infrastructures or management systems allowing better 583
outlets for solid waste to be found; new projects of infrastructure or management systems 584
allowing to reach the same objective. To measure more precisely the importance of these four 585
components, we use three variables for the calibration scale: the proportion of solid waste 586
tonnage or of local managers covered, the perennial nature of this capital (following Beierle, 587
1999), and the degree of consensual dissatisfaction with the way the issue of solid waste was 588
tackled (penalty for waste export and transportation). 589
20 590
Table 2 presents the calibrated values of the parameters of interest, including the outcome 591
variables and the relative frequency of each of the eight situations. 592
593
[TABLE 2 ABOUT HERE] 594
595
The model provides us with two types of indicators relative to the performance of the 596
consultation game: the difference between both players’ outcome level, y1− , and the y2
597
displacement from the initial objective to the final outcome, yi−θi,i=1, 2. These two
598
indicators can be compared with the calibrated outcome variables, namely, the level of 599
investment in waste treatment and management, and the level of stated stakeholders’ 600
displacement (in the survey). Such comparison is used as a means to assess the ex post 601
validity of the model, i.e., by computing a measure of distance between the calibrated variable 602
from the survey, and the corresponding simulated value from the model. 603
604
Model Simulation and Validation
605 606
In Table 3, we report the calibrated performance indicators, to be compared with our model 607
simulations. We normalize the outcomes and model simulations by taking area 3 as a 608
benchmark for results from areas 1 and 2. More precisely, we solve the model for areas 1 and 609
2, imposing calibrated displacement and investment to equal their normalized value for area 610
3. Therefore, model validation is only feasible for the first two study areas. The difference 611
between the stated performance level and the simulated performance level from the model is 612
expressed as a proportion of the stated performance. As can be seen from Table 3, the 613
average “error” of prediction is fairly limited (less than 5 percent in all cases). 614
615
[TABLE 3 ABOUT HERE] 616
617
Finally, to have a better evaluation of the relative contribution of each parameter or variable 618
of interest in the final performance of the stakeholder dialogue, we compute the elasticity of 619
the dialogue performance with respect to each parameter or variable. To do so, we compute an 620
21
average performance indicator from the displacement and the investment stated outcomes, 621
and run the model with a small change (typically, 1E-8) in the parameter or variable of 622
interest, to estimate the marginal effect. Table 4 reports computed elasticities at the calibrated 623
values for the three study areas. 624
625
[TABLE 4 ABOUT HERE] 626
627
Interestingly, elasticities with respect to parameters δ , θ and β are fairly different across 628
study areas, even though their calibrated values are roughly similar, as other parameters are 629
naturally different across study areas. The parameter δ for pressure to cooperate is associated 630
with the highest elasticity on average, although it is less than the objectives parameter for area 631
1. The probability associated with the eight dialogue modes does not seem to influence 632
performance much in relative terms. 633
634
5. Discussion and conclusion 635
636
We have proposed an original model based on messaging (“cheap talk”), to investigate the 637
performance of participatory procedures on environmental and land-use planning. The 638
application deals with three French study areas involved in municipal solid waste 639
management, where stakeholders’ attitudes and objectives have been quantified from 640
qualitative surveys. The novelty of the approach is to exploit these qualitative data for 641
constructing quantitative indicators (as proxies for negotiation background and outcomes) to 642
calibrate the theoretical model of negotiation. The performance of the dialogue is evaluated 643
by considering two dimensions: the resulting level of investment for waste collection, 644
diversion, treatment, and the displacement of stakeholders from their initial objectives to the 645
acceptance of the final outcome. 646
Comparing the observed outcomes from qualitative surveys with simulated outcomes from 647
our model, the latter performs well in terms of reproducing the negotiation outcomes. The 648
model could therefore be of interest for testing the performance of participatory schemes for 649
land use projects impacting the environment in other contexts. However, it should not be 650
22
considered a tool for predicting outcomes of future negotiation procedures, because of the 651
required ex post calibration of variables and parameters of interest. 652
653
In terms of the economics of public participation, this analysis is providing us with 654
interesting evidence. Concerning the performance of stakeholder dialogue in environmental 655
planning, it is not sufficient to rely on technical expertise or communication experts (policy 656
options regularly put forward in practice, see Braun et Schultz, 2010). Agents’ perceptions 657
and their bargaining power are also factors to consider. The discrepancy between agents’ 658
initial objectives remains a major critical factor, consistent with insight from the economic 659
literature. In contrast, with little emphasis in the economic literature, the willingness to reach 660
an agreement, related to local previous critical conditions, proves to be another major driver 661
of a successful negotiation. 662
663
A contribution of the present paper is to illustrate how economic modelling can contribute to 664
assess productivity of stakeholder dialogue and negotiation with numerous factors. We 665
believe it is an interesting complement to several papers dealing with noxious facility siting. 666
Feinerman et al. (2004) propose a framework for analyzing differences between political 667
siting and socially optimal locations for landfill. They test in particular whether NIMBY 668
conflicts can be resolved by democratic political processes where the principal’s utility 669
depends on social welfare and political rewards. As our paper focuses on the performance of 670
stakeholder dialogue in participatory schemes with a calibration exercise that extends beyond 671
residential households as stakeholders, it could provide an interesting extension of Feinerman 672
et al. (2004). This is also true of Swallow et al. (1992), who propose a general and practical 673
approach (without empirical application) to the public-choice problem of noxious facility 674
siting, by decomposing the site selection process in three stages (minimum technical 675
standards, social selection criteria, and community acceptance). However, these authors are 676
interested in the role of observed criteria characterizing the three stages above and not in the 677
assessment of participatory schemes. 678
Lejano and Davos (2002) propose a theoretical framework to incorporate equity principles 679
into the optimal siting decision process, with an application of bargaining games to an 680
incinerator siting. In their model, utility transfers are not feasible and the optima location is 681
entirely determined from estimates of (cancer) risk for various possible sites. Environmental 682
23
and health risk preferences and perceptions by stakeholders is in fact one (out of seven) aspect 683
that we consider in the present paper. The way Lejano and Davos (2002) address the risk and 684
utility issue is however more detailed than ours. Lami and Abastante (2014) focus also 685
exclusively on the choice of waste treatment technology (neither sorting nor prevention of 686
waste emission), and they explore more deeply the issue of benefits and costs for the 687
stakeholders. Finally, Santore (2014) examine in a theoretical paper the ex ante efficiency of 688
noxious facility siting when communities have heterogeneous preferences over income. They 689
show that simple lotteries (without host compensation) may be preferred to determine the 690
community where the noxious facility will be sited. Such analysis is at the community level 691
and does not include stakeholder dialogue and a participatory scheme, as it is more interested 692
in efficiency arguments for the decision maker, in a top-down decision perspective. 693
694
The set of papers above mostly consider top-down policies and centralized compensation 695
schemes, and as the present paper shows, there is room for stakeholder dialogue as a 696
complementary policy. This paper contributes to the literature on the economics of 697
stakeholder dialogue by confirming the usefulness of cheap talk models, which have been 698
recognized to be potentially useful for analyzing private negotiations and public policy 699
decision at a general level (Farrell and Rabin, 1996). They stand out as potentially promising 700
in an intermediary space: for analyzing the political economy of highlights in local 701
environmental planning. 702
24 704
References
705 706
Alonso, R., Dessein, W., Matouschek, N., 2008. When Does Coordination Require 707
Centralization? The American Economic Review 98 (1), 145-179. 708
709
Ananda, J., Herath, G., 2008. Multi-attribute preference modelling and regional land-use 710
planning. Ecological Economics 65 (2), 325-335. 711
712
Ananda, J., Proctor, W., 2013. Collaborative approaches to water management and planning: 713
An institutional perspective. Ecological Economics 86, 97-106. 714
715
Ansell, C., Gash, A., 2007. Collaborative Governance in Theory and Practice. Journal of 716
Public Administration Research and Theory 18, 543-571. 717
718
Avci, D., F. Adaman, Özkaynak, B., 2010. Valuation languages in environmental conflicts: 719
How do stakeholders oppose or support gold mining at Mount Ida, Turkey. Ecological 720
Economics 70, 228-238. 721
722
Awakul, P., Ogunlana, S. O., 2002. The effect of attitudinal differences on interface conflicts 723
in large scale construction projects: a case study, Construction Management and Economics 724
20 (4), 365-377. 725
726
Beierle, T. C., 1999. Using social goals to evaluate public participation in environmental 727
decisions. Review of Policy Research 16 (3-4), 75-103. 728
729
Beierle, T. C. and Cayford, J., 2002. Democracy in Practice. Public Participation In 730
Environmental Decisions. Washington DC, Resources For the Future Press. 731
732
Biddle, J. C.; Koontz, T.M., 2014. Goal specificity: a proxy measure for improvements in 733
environmental outcomes in collaborative governance. Journal of Environmental Management 734
145, 268-276. 735
736
Bourdeaux, C., 2007. Politics versus Professionalism: The Effect of Institutional Structure on 737
Democratic Decision Making in a Contested Policy Arena. Journal of Public Administration 738
Research and Theory 18, 349-373. 739
740
Bouwen, R., Taillieu, T., 2004. Multi-party Collaboration as Social Learning for 741
Interdependence: Developing Relational Knowing for Sustainable Natural Resource 742
Management. Journal of Community & Applied Social Psychology 14, 137-153. 743
744
Braun, K., Schultz, S., 2010. “… a certain amount of engineering involved”: Constructing the 745
public in participatory governance arrangements. Public Understanding of Science 19, 403-746
419. 747
748
Bulkeley, H., Watson, M., Hudson, R., Weaver, P., 2005. Governing municipal waste: 749
Towards a new analytical framework. Journal of Environmental Policy & Planning 7 (1), 1-750
23. 751
25 752
Calcott, P. and S. Hutton, 2006. The choice of regulatory regime when there is a regulatory 753
gatekeeper. Journal of Environmental Economics and Management 51, 153-164. 754
755
Callon, M., 2010. Performativity, misfires and politics. Journal of Cultural Economy 3(2), 756
163-169. 757
758
Chiu, C-P., Lai, S-K., 2009. An experimental comparison of negotiation strategies for siting 759
NIMBY facilities. Environment and Planning B 36, 956-967. 760
761
Crawford, V., Sobel, J., 1982. Strategic Information Transmission. Econometrica 50 (6), 762
1431-1451 763
764
Davoudi, S., 2000. Planning for waste management: changing discourses and institutional 765
relationships. Progress in Planning 53, 165-216. 766
767
Davoudi, S., Evans, N., 2005. The challenge of governance in regional waste planning. 768
Environment and Planning C 23, 493-517. 769
770
Edelenbos, J. and Klijn, E-H., 2006. Managing Stakeholder Involvement in Decision Making: 771
A Comparative Analysis of Six Interactive Processes in the Netherlands, Journal of Public 772
Administration Research and Theory 16 (3), 417-446. 773
774
Farrell, J., Rabin, M., 1996. Cheap Talk. Journal of Economic Perspectives 10 (3), 103-118. 775
776
Feinerman, E., Finkelshtain, I., Kan, I., 2004. On a political solution to the Nimby conflict. 777
The American Economic Review 94, 369-381. 778
779
French, S., Bayley, C., 2011. Public participation: comparing approaches. Journal of Risk 780
Research 14(2), 241-257. 781
782
Garmendia, E., Stagl, S., 2010. Public participation for sustainability and social learning: 783
Concepts and lessons from three case studies in Europe. Ecological Economics 69 (8), 1712-784
1722. 785
786
Goltsman, M., Pavlov, G., 2008. How to talk to Multiple Audience. Games and Economic 787
Behavior 72 (1), 100-122. 788
789
Hoornweg, D., Bhada-Tata, P., 2012. What a Waste: A Global Review of Solid Waste 790
Management. Urban Development Series Knowledge Papers, n° 15 (March). The World 791
Bank, Washington DC. 792
793
Kontoleon, A., Macrory, R., Swanson, T., 2002. Individual preference-based values and 794
environmental decision making: should valuation have its day in court?, Research in Law and 795
Economics 20, 177-214. 796
797
Koontz, T. M., 2005. We Finished the Plan, So Now What? Impacts of Collaborative 798
Stakeholder Participation on Land Use Policy. The Policy Studies Journal 33 (3), 459-481. 799
26 800
Krishna, V., Morgan, J., 2001. A Model of Expertise. The Quarterly Journal of Economics 801
116 (2), 747-775. 802
803
Lami, I. M. and F. Abastante, 2014. Decision making for urban solid waste treatment in the 804
context of territorial conflict: Can the Analytic Network Process help? Land Use Policy 41, 805
11-20. 806
807
Leach, W. D., Pelkey, N. W., Sabatier, P. A., 2002. Stakeholder partnerships as collaborative 808
policymaking: Evaluation criteria applied to watershed management in California and 809
Washington. Journal of Policy Analysis and Management 21 (4), 645-670. 810
811
Lejano, R. P., & Davos, C. A., 2002. Fair share: siting noxious facilities as a risk distribution 812
game under nontransferable utility. Journal of Environmental Economics and Management 813
43(2), 251-266. 814
815
Lejano, R. P., Ingram, H., 2009. Collaborative networks and new ways of knowing. 816
Environmental Science & Policy 12 (6), 653-662. 817
818
Li T. H. Y., Ng, S. T., Skitmore, M., 2012. Conflict or consensus: An investigation of 819
stakeholder concerns during the participation process of major infrastructure and construction 820
projects in Hong Kong. Habitat International 36 (2), 333–342. 821
822
Maguire, L. A., Lind, E. A., 2003. Public participation in environmental decisions: 823
stakeholders, authorities and procedural justice. Int. J. Global Environmental Issues 3 (2), 824
133-148. 825
826
Margerum, R. D., 2002. Collaborative Planning: Building Consensus and Building a Distinct 827
Model for Practice. Journal of Planning Education and Research 21, 237-253. 828
829
Masuda, J. R., McGee, T. K., & Garvin, T. D., 2008. Power, knowledge, and public 830
engagement: constructing ‘citizenship’in Alberta's industrial heartland. Journal of 831
environmental policy & planning, 10(4), 359-380. 832
833
Mathur, N. and Skelcher, C., 2007. Evaluating Democratic Performance: Methodologies for 834
Assessing the Relationship between Network Governance and Citizens. Public Administration 835
Review 67 (2), 228-237. 836
837
Menkel-Meadow, C., 2009. Chronicling the Complexification of Negotiation Theory and 838
Practice. Negotiation Journal 25 (4), 415-429. 839
840
Messer, K. D., Suter, J. F., Yan, J., 2013. Context Effects in a Negatively Framed Social 841
Dilemma Experiment. Environmental and Resource Economics 55 (3), 387-405. 842
843
Mitusch, K., Strausz, R., 2005. Mediation in Situations of Conflict and Limited Commitment. 844
The Journal of Law, Economics, & Organization 21 (2), 467-500. 845