Benchmarking of the MIT High Temperature Gas-Cooled Reactor TRISO-Coated
Particle Fuel Performance Model
by
Michael A. Stawicki
SUBMITTED TO THE DEPARTMENT OF NUCLEAR SCIENCE AND ENGINEERING IN PARTIAL FULFILLMENT OF THE REQUIREMENTS
FOR THE DEGREES OF
MASTER OF SCIENCE IN NUCLEAR SCIENCE AND ENGINEERING AND
BACHELOR OF SCIENCE IN NUCLEAR SCIENCE AND ENGINEERING AT THE
MASSACHUSETTS INSTITUTE OF TECHNOLOGY May 2006
@ 2006 Massachusetts Institute of Technology. All Rights Reserved.
Signature of Author Certified by Accepted by Accepted by MhASSACHUSETTS INSTITUTE. OF TECHNOLOGY
OCT 1.2 2007
LIBRARIES
9 0 4.r- -- - -. - -Michael A. Stawicki Department of Nuclear Science and Engineering May 5, 2006Ronald G. Ballinger Professor of Nuclear Science and Engineering Associate Professor of Materials Science and Engineering Thesis Supervisor
Andrew C. Kadak Professor of the Practice of Nuclear Science and Engineering Thesis Reader
w
iJeffrey A. Coderre Associate Professor of Nuclear Science and Engineering Chairman, Departmental Committee on Graduate Students
Benchmarking of the MIT High Temperature Gas-Cooled Reactor
TRISO-Coated Particle Fuel Performance Model
by
Michael A. Stawicki
Submitted to the Department of Nuclear Science and Engineering on May 5, 2006 in partial fulfillment of the requirements for the degrees of Master of Science in Nuclear Science and Engineering and Bachelor of Science in Nuclear Science and Engineering
ABSTRACT
MIT has developed a Coated Particle Fuel Performance Model to study the behavior of TRISO nuclear fuels. The code, TIMCOAT, is designed to assess the mechanical and chemical condition of populations of coated particles and to determine the failure probability of each of the structural coating layers. With this, the code determines the overall particle failure rate. TIMCOAT represents a significant advancement over earlier codes as it includes a pyrocarbon crack induced particle failure mechanism, which applies probabilistic fracture mechanics.
As part of the International Atomic Energy Agency (IAEA) Coordinated Research Program (CRP) on coated particle fuel technology, a code benchmark has been developed by the Idaho National Laboratory (INL). The benchmark includes simple analytic studies and more complex simulations of TRISO particles from past and future experiments. For each study a large variety of particle parameters are specified.
This thesis reports TIMCOAT's results from the benchmark study. As this was a blind benchmark, no other results are available for comparison. However, TIMCOAT is able to independently calculate several of the parameters specified by the benchmark, and comparisons are made between results obtained using IAEA parameters and TIMCOAT calculated parameters.
The material properties which describe the effects of irradiation on pyrolytic carbon are the focus of the comparison. The rates of irradiation induced creep and swelling calculated by TIMCOAT and the rates provided in the benchmark differed by a factor of two to four in some cases and led to differences in particle failure rate by several orders of magnitude. In addition, varying the uncertainties in these and other parameters was found to have a large impart on the failure probability.
It is concluded that accurate modeling of TRISO particles depends on having very high accuracy data describing material properties and a very good understanding of the uncertainties in those measurements.
Thesis Supervisor: Ronald G. Ballinger
Title: Professor of Nuclear Science and Engineering and Associate Professor of Materials Science and Engineering
Acknowledgements
I would like to offer special thanks to my advisor, Professor Ronald Ballinger, for affording me the opportunity to work on this project and for his guidance and support throughout the course of the endeavor; and to Professor Andrew Kadak for his assistance in reviewing my work and his continued tutelage during my time at MIT.
I acknowledge the efforts of those who came before who worked to create and improve TIMCOAT: Dr. Jing Wang who received his PhD for the initial development of the code, Jane Diecker who began work on integrating TIMCOAT's chemistry models, and
Chaiyod Soontrapa who completed the first series of code optimizations.
Appreciation is also extended to the Nuclear Science and Engineering Department at MIT and the Nuclear Regulatory Commission for their part in funding this project.
Finally, I offer a note of personal gratitude to my parents, Al and Mary Stawicki, and my fiance Dr. Robin Chan for their love, support, and encouragement.
Far and away the best prize that life offers is the chance to work hard at work worth doing.
Table of Contents
ABSTRACT ... 3
A cknow ledgem ents... 4
Table of Contents ... 5
Table of Figures ... 7
Table of Tables ... 9
1 Introduction... 10
1.1 Review of High Temperature Gas-cooled Reactors ... 10
1.2 Coated Fuel Particles ... 13
1.3 Failure Mechanisms for Coated Particles ... ... 15
2 MIT Coated Particle Performance Model - TIMCOAT ... ... 17
2.1 Inputs ... 17
2.2 Simulation Types and Modes ... 18
2.3 M odel Structure ... ... 19
2.4 O utput ... 2 1 3 IAEA-CRP Normalized Coated Particle Benchmarks... ... 22
3.1 Part 1: Analytical Mechanical Benchmark Cases... 22
3.1.1 Description of Cases ... 22
3.1.2 R esults... 23
3.1.3 D iscussion ... ... 26
3.2 Part 2: Pyrocarbon Mechanical Response Benchmark Cases... 27
3.2.1 Description of Cases ... 29
3.2.2 Results and Discussion Case 4a... ... 30
3.2.3 Results and Discussion Case 4b ... ... 32
3.2.4 Results and Discussion Case 4c... 34
3.2.5 Results and Discussion Case 4d ... ... 37
3.3 Part 3: Nominal TRISO Benchmark Cases... 39
3.3.1 Description of Cases ... 39
3.3.2 Results and Discussion Case 5 ... ... 43
3.3.3 Results and Discussion Case 6 ... ... 45
3.3.4 Results and Discussion Case 7 ... ... 46
3.3.5 Results and Discussion Case 8 ... ... 48
4 IAEA-CRP Sampled Coated Particle Benchmarks ... 50
4.1 Part 4: Previous Experiment TRISO Benchmark Cases ... 51
4.1.1 Case 9: HRB - 22 Parameters... ... ... 51
4.1.2 Case 9: HRB - 22 Results and Discussion ... 54
4.1.3 Case 10: HFR - K3 B/2 Parameters ... ... 59
4.1.4 Case 10: HFR - K3 B/2 Results and Discussion ... 61
4.1.5 Case 11: H FR - P4... 64
4.1.6 Case 12: NPR - 1A 5 Parameters ... ... 65
4.2 Part 5: Future Experiment TRISO Benchmark Cases ... 73
4.2.1 Case 13: HFR EU - 1 Parameters... ... ... 73
4.2.2 Case 13: HFR EU - 1 Results and Discussion ... 74
4.2.3 Case 14: HFR EU - 2 Parameters... ... ... 77
4.2.4 Case 14: HFR EU - 2 Results and Discussion ... 79
5 Conclusions, Comments and Future Work ... ... 83
5.1 IAEA Parameters and TIMCOAT Calculations ... 83
5.2 Stress Calculations and Results ... ... 85
5.3 Param etric Insights ... 86
R eferences ... 88
Appendix I - Input Param eters ... ... 90
Appendix II - Irradiation Histories... 97
Appendix III - Particle Dimensions ... 107
Table of Figures
Figure Figure Figure Figure 1-1: 1-2: 1-3: 1-4: Figure 2-1: Figure 3-1: Figure 3-2: Figure 3-3: Figure 3-4: Figure 3-5: Figure 3-6: Figure 3-7: Figure 3-8: Figure 3-9: Figure 3-10: Figure 3-11: Figure 3-12: Figure 3-13: Figure 3-14: Figure 3-15: Figure 3-16: Figure 3-17: Figure 3-18: Figure 3-19: Figure 3-20: Figure 3-21: Figure 3-22: Figure 4-1: Figure 4-2: Figure 4-3: Figure 4-4: Figure 4-5: Figure 4-6: Figure 4-7:Illustration of General Atomics Prismatic Block HTGR Fuel... 11
Illustration of PBR HTGR Fuel ... ... 12
Micrograph of a typical TRISO Particle [2] ... 13
Amoeba Effect [7] ... 16
Flowchart for TIMCOAT Modeling Procedure [8] ... 20
Radial and Tangential Stresses in SiC for Case 1 ... 23
Radial and Tangential Stresses in IPyC for Case 2 ... 24
Radial and Tangential Stresses in IPyC and SiC for Case 3... 24
Illustration of Irradiation Induced Dimensional Changes in PyC [4]... 28
Maximum Tangential Stresses in IPyC and SiC Layers for Case 4a... 31
Radial Stress at the IPyC/SiC Interface for Case 4a ... 32
Inner Surface Tangential Stresses in IPyC and SiC Layers for Case 4b .... 33
Radial Stress Profile in IPyC Layer for Case 4b ... 34
Inner Surface Tangential Stresses in IPyC and SiC Layers for Case 4c... 36
Radial Stress Profile in IPyC Layer for Case 4c ... 36
Radial and Tangential Swelling Rates for Case 4d... 37
Inner Surface Tangential Stresses in IPyC and SiC Layers for Case 4d .... 38
Radial Stress Profile in IPyC Layer for Case 4d ... 38
Temperature and Internal Pressure Histories for Case 8 ... 42
PyC Creep Coefficient for Case 8... ... 43
Maximum Tangential Stresses in IPyC and SiC Layers for Case 5 (Calculated Values include TIMCOAT calculated swelling rates and creep coeffi cient) ... 44
Maximum Tangential Stresses in IPyC and SiC Layers for Case 5 (Calculated Values include TIMCOAT calculated swelling rates, creep coefficient and variable Poisson's ratio in creep) ... 45
Maximum Tangential Stresses in IPyC and SiC Layers for Case 6 ... 46
Radial and Tangential Swelling Rates for Case 7... 47
Maximum Tangential Stresses in IPyC and SiC Layers for Case 7 ... 48
Maximum Tangential Stresses in IPyC and SiC Layers for Case 8 ... 49
Displacement of Inner Surface IPyC and SiC Layers for Case 8 ... 49
Radial and Tangential Swelling Rates for Case 9... 53
Total Internal Gas Pressure for a Nominal Particle Case 9 ... 55
Maximum Tangential Stresses in IPyC and SiC Layers for a Nominal Particle Case 9 ... ... 55
Failure Fraction for TIMCOAT Value Particles Case 9... 58
Failure Fraction for TIMCOAT Value Particles with fixed BAF = 1.0 Case 9 ... 58
Radial and Tangential Swelling Rates for Case 10 ... 60
Figure 4-8: Figure 4-9: Figure 4-10: Figure 4-11: Figure 4-12: Figure 4-13: Figure 4-14: Figure 4-15: Figure 4-16: Figure 4-17: Figure 4-18: Figure 4-19: Figure 4-20: Figure 4-21: Figure 4-22: Figure 4-23:
Maximum Tangential Stresses in IPyC and SiC Layers for a Nominal
Particle Case 10 ... ... 62
Failure Fraction Case 10... ... ... 64
Maximum Tangential Stresses in IPyC and SiC Layers for a Nominal Particle Case 11 ... 65
Comparison between TIMCOAT and Experimental Data for simulation of N PR 1 capsules [8] ... 66
Radial and Tangential Swelling Rates for Case 12... 68
Total Internal Gas Pressure for a Nominal Particle Case 12 ... 69
Maximum Tangential Stresses in IPyC and SiC Layers for a Nominal Particle Case 12 ... 70
Failure Fraction for IAEA Value Particles Case 12 ... 71
Failure Fraction for TIMCOAT Value Particles Case 12... 72
Radial and Tangential Swelling Rates for Case 13... 74
Total Internal Gas Pressure for a Nominal Particle Case 13 ... 75
Maximum Tangential Stresses in IPyC and SiC Layers for a Nominal Particle Case 13 ... 75
Failure Fraction for Case 13 ... ... 77
Radial and Tangential Swelling Rates for Case 14... 79
Total Internal Gas Pressure for a Nominal Particle Case 14 ... 80
Maximum Tangential Stresses in IPyC and SiC Layers for a Nominal Particle Case 14 ... 80
Table of Tables
Table 1-1: Properties of Coated Particle Layers [4] ... 14
Table 2-1: TIMCOAT Input Parameters ... 18
Table 2-2: TIMCOAT Output Parameters ... 21
Table 3-1: Table 3-2: Table 3-3: Table 3-4: Table 3-5: Table 3-6: Table 3-7: Table 3-8: Table 3-9: Table 3-10: Table 4-1: Table 4-2: Table 4-3: Table 4-4: Table 4-5: Table 4-6: Table 4-7: Table 4-8: Table 4-9: Table 4-10: Table 4-11: Table 4-12: Comparison Metrics for Cases 1, 2 and 3 ... 25
Comparison of Analytical and TIMCOAT Calculations Case 1 ... 25
PyC Irradiation Properties for Case 4a ... 29
PyC Irradiation Properties for Case 4b ... 29
PyC Irradiation Properties for Case 4c ... 30
PyC Irradiation Properties for Case 4d ... 30
PyC Irradiation Properties for Case 5 ... ... 40
PyC Irradiation Properties for Case 6... ... 40
PyC Irradiation Properties for Case 7... ... 41
PyC Irradiation Properties for Case 8 ... ... 42
TIMCOAT Sampled Parameters ... ... 50
Properties for Case 9... 52
Sampling Results for Case 9... ... ... 56
Properties for Case 10... 59
Sampling Results for Case 10... ... 63
Properties for Case 12... 67
Sampling Results for Case 12... ... 71
Properties for Case 13... 73
Sampling Results for Case 13... 76
Properties for Case 14... 78
Sampling Results for Case 14... ... 81
1 Introduction
At the current time it can be said we are in the midst of a nuclear renaissance. Nuclear technologies are already an important source of electric power, but as governments and the public continue to become interested in developing an inexpensive, safe, and environmentally friendly method to generate electricity, there has been renewed interest in nuclear power. One of the advanced systems being considered is the High Temperature Gas-cooled Reactor (HTGR) as it seems to have the potential to meet these criteria. HTGRs use ceramic coated fuel particles embedded in a graphite matrix. Before any HTGR system can be deployed, however, acceptable performance characteristics of these ceramic coated fuel particles must first be demonstrated. To this end, research groups in several countries have begun to develop performance models to predict the behavior of these particles. In conjunction with the International Atomic Energy Agency Coordinated Research Program (IAEA-CRP), the Idaho National Laboratory (INL) has developed a series of benchmark cases [1] to facilitate comparisons between the models of each of the research participants.
This thesis describes the results of these benchmark cases obtained by the MIT fuel performance model. As a precursor, a brief description of HTGRs and ceramic coated fuel is provided before a detailed description of the MIT model.
1.1
Review of High Temperature Gas-cooled Reactors
Two types of HTGRs began to be developed in the 1950s and reemerged in the 1980s. One type, the block type reactor, uses prismatic blocks which contain the fuel as well as cooling channels and slots for control absorbers and instrumentation. The fuel consists of ceramic microspheres approximately 1 mm in diameter pressed into compacts as shown in Figure 1-1. The other type of reactor, The Pebble Bed Reactor (PBR), uses these same fuel microspheres embedded in 6 cm graphite spheres or "pebbles" each containing about 15,000 microspheres. This arrangement is shown in Figure 1-2. The PBR is somewhat unique among reactor systems in that the pebbles flow through the core during operation. Fresh, un-irradiated or recycled pebbles are dropped into the top or the core vessel, and
used pebbles are extracted from the bottom. Coolant does not flow through channels but rather through the bulk of the vessel with control absorbers and instrumentation at the core periphery.
Particles
Compacts
Fuel
Assembly
Figure 1-1: Illustration of General Atomics Prismatic Block HTGR Fuel
Both of these HTGR systems share a set of common design criteria intended to enhance passive safety characteristics. Helium, as a single phase noble gas, is used as coolant because of its favorable chemical and neutronic properties. Fuel is contained in coated microspheres, as mentioned, which are supposed to be able to contain all radiotoxic fission products up to a temperature of approximately 16000C. This temperature is
selected, since the reactor is designed such that the fuel temperature will not exceed 16000C during any transient. This is done by limiting the power density to 3 - 4 MW/m3
and by ensuring decay heat can be removed by passive mechanisms such as natural convection and radiation. Graphite is used for all core structures and as matrix material because its temperature limit is far above 16000C. The reactor is also able to shut down
Coated Particle
M
0
9
mm Diamotear)Fuel, U02
(0.5 mm Diameter)
Figure 1-2: Illustration of PBR HTGR Fuel
Both experimental and commercial HTGRs are currently under development. The PBR is being developed by ESKOM of South Africa, British Nuclear Fuels (BNFL) of the United Kingdom, and the Institute of Nuclear Energy Technology, a part of Tsinghua University in Beijing, China. The block type reactor is being considered by a consortium of General Atomics in the United States, MINATOM in Russia, Framatome in France, and Fuji Electric in Japan. In addition, numerous other programs and testing facilities exist in about 10 countries.
1.2 Coated Fuel Particles
Both of the HTGR systems discussed in Section 1.1 use ceramic coated particles to contain the fuel. The purpose of these particles is twofold. They not only contain fissile isotopes, which produce energy, but are also intended as a barrier to the release of fission products into the environment. The typical fuel particle has five components. At the center is a fuel kernel typically U02 or UCO. Surrounding this kernel is a low density
pyrolytic carbon buffer layer intended to provide a porous medium to absorb fission products. Around that are three near isotropic structural layers. The inner and outer layers are constructed of a high density pyrolytic carbon, the IPyC and OPyC, respectively. Between these PyC layers is a layer of silicon carbide (SiC), which serves as the pressure vessel for the particle. These particles are called tri-isotropic or TRISO particles. The name refers to the three isotropic structural layers, the IPyC/SiC/OPyC. Figure 1-3 shows a micrograph of such a particle, and Table 1-1 describes the properties of each layer in further detail.
To access the performance of the TRISO design, it is necessary to know the failure probability of each of the three structural layers. Before knowing this, the mechanisms by which each of the layers may fail must be understood. These mechanisms are the
subject of the next section.
0, kernel iffer layer
:C layers
C layer
Table 1-1: Properties of Coated Particle Layers [4]
LAYER DESCRIPTION
Fuel Kernel The kernel is typically 300 - 600 jtm in diameter and contains U0 2 or
UCO. During the nuclear fission process, the kernel produces a mixture of radioactive fission products. Among the fission products are gaseous species that cause stresses in the coatings, as well as solid metallic species that chemically interact with the coatings. The fuel kernel swells with increasing burn-up of the fuel.
Pyrolytic Carbon This layer is in direct contact with the kernel. The density of this layer Buffer Layer is in the range of 0.9 - 1.1 g/cm3, compared with theoretical density of 2.26g/cm3 for pyrocarbon. The porous buffer layer is an absorber of fission recoils and provides free volume to accommodate fission products and kernel swelling. It also serves as a mechanical separation between the kernel and the structural coating layers.
IPyC This is the first of the three structural layers and has a density of 1.8 -2.0g/cm3. The layer forms the first barrier against the fission gas release from the fuel kernel and resists migration of actinides and fission products. The IPyC layer is a practically impenetrable barrier for fission gases like Krypton and Xenon and the fission product Iodine, but it becomes pervious for Cesium and Strontium at high (higher than normal operational) temperatures. It does not stop Silver.
SiC The SiC layer has a density of about 3.20g/cm3, which is very close to its theoretical density. This layer provides retention of all fission products under normal operating conditions. It must remain intact to prevent the release of radioactive material from the particle. SiC is
attractive because it has a higher mechanical strength than dense PyC layers, and it is highly stable under fast neutron irradiation. Unfortunately, at temperatures above 16000C, SiC will be corroded by
Palladium and other rare earth elements as well as become porous to Cesium, Strontium, and Silver. In addition, at temperatures in the region of 2000 -22000C, thermal decomposition of SiC takes place. OPyC This layer protects the SiC layer from being damaged during the fuel
manufacturing process. It also compresses the SiC layer as it shrinks during fast neutron irradiation.
1.3 Failure Mechanisms for Coated Particles
Failure mechanisms for TRISO particles can be broadly classified into two categories, mechanical mechanisms and chemical mechanisms. Mechanical mechanisms are those mechanisms in which failure of a structural layer is the result of a stress that exceeds a material strength failure criterion either due to crack initiation and propagation or due to overloading. Chemical mechanisms refer to those that involve corrosion, decomposition, or other weakening of the structural layers due to elements that build up inside the particle during irradiation. These then induce a mechanical failure. The specific mechanisms that occur in each category are discussed below.
Mechanical Failures:
1.) Over Pressure Failures - during the irradiation of TRISO particles, fission products build up inside the kernel. Some of these fission products are gaseous and migrate into the buffer and out to the structural layers. As the pressure of these gases increase over the life of the particle, they will induce increasing tensile stresses in the structural layers. If the mean tensile stress in any one of the layers exceeds the strength of that layer, the layer fails. This is referred to as an over pressure failure.
2.) Cracking Induced Failures - Early in the irradiation history, pyrocarbon layers shrink in both radial and tangential directions. The shrinkage of the pyrocarbon helps compress the SiC and prevent over pressure failures. As irradiation continues, however, reorientation on the pyrocarbon structure causes it to swell in the radial direction but continue to shrink in the tangential direction. As a result, the pyrocarbon layers can crack, and these cracks can lead to very high local stress concentrations in the silicon carbide layer even while the net stress in the SiC is compressive. This stress concentration cracks and fails the SiC layer.
Chemical Failures:
1.) Fission Product Attack - As fission products are built up and released from the kernel, they migrate to the structural layers and corrode them [5]. The level of corrosion is dependent on the amount of free oxygen and the temperature of the
microsphere. Corrosion is enhanced at higher temperatures. This corrosion thins the effected structural layer and reduces its strength. As a result of this thinning, the existing tensile stresses in the layer are now sufficient to fail it.
2.) Amoeba Effect - The thermally driven migration of the fuel kernel toward the hot side of the microsphere is referred to as the Amoeba Effect [6]. It occurs over time and is more severe at higher temperatures and thermal gradients. For oxide fuels, oxygen reacts with PyC to form CO, which is transported to the cold side of the microsphere causing the kernel to migrate toward to hot side. If this effect is severe enough, the kernel can physically collide with and breach the structural layers as shown in Figure 1-4.
HOi SDUE
N~~
!D POLA IZED Lt.HT
Figure 1-4: Amoeba Effect [7]
In addition to these four failure mechanisms, manufacturing defects and imprecision inherent in the tools used in the manufacture process can either lead to gross particle failure or the substantial weakening of one of the structural layers. It is possible to identify additional mechanisms related to the conditions that would prevail under certain types of HTGR transients, but this information is not pertinent to this thesis. More detail can be found in reference [4]. For the purposes of the INL benchmarking study, only the first two mechanical failure mechanisms, over-pressurization and PyC cracking, are considered. These mechanisms are modeled in the MIT coated particle performance model named TIMCOAT.
r
2 MIT Coated Particle Performance Model
-
TIMCOAT
The TIMCOAT code was designed specifically to model TRISO fuel performance in HTGR systems. It is a stochastic program that first calculates the conditions a sample TRISO particle would encounter given a set of input parameters that describe the particle and HTGR system. It then calculates the mechanical and chemical response of the particle to that environment. The mechanical models in TIMCOAT are well developed, while chemical model development is just beginning. As such, only the mechanical models are used in this benchmarking program. Once the code determines the response of the particle, it compares the state of the particle to a set of failure conditions to determine if the particle has failed. It then samples another particle and repeats this process to determine the failure probability of each of the three structural layers.
2.1 Inputs
TIMCOAT requires the user to specify input parameters relating to the TRISO particle and to the HTGR system. A complete list of the needed input parameters is found in Table 2-1, and a sample input file is included in Appendix I. A standard deviation can be supplied for most of the parameters in the table. The standard deviations are used by the model to develop distributions for the value of each particular parameter. The distributions used are presented in Table 4-1.
Table 2-1: TIMCOAT Input Parameters
Parameter
IPyC Characteristics PyC BAF
PyC Coating Rate PyC Crystallite Length PyC Weibull Modulus IPyC Characteristic Strength
IPyC Density
IPyC Thickness
SiC Characteristics SiC Weibull Modulus SiC Characteristic Strength SiC Fracture Toughness SiC Density
SiC Thickness
SiC Modulus of Elasticity
SiC Poisson's Ratio
SiC Coefficient of Thermal Expansion
OPyC Characteristics OPyC BAF
OPyC Coating Rate OPyC Crystallite Length OPyC Weibull Modulus OPyC Characteristic Strength OPyC Density
OpyC Thickness
Numeric Modeling Parameters
Elapsed Time Time Step Days Days Units Am/min Am
MPa m3 /Weibull Modulus
g/cc
Am
MPa m3/Weibull Modulus MPa m1/ 2 g/cc Am MPa K -1 gm/min Am
MPa m3/Weibull Modulus
g/cc
Am
2.2
Simulation Types and Modes
TIMCOAT allows three different types of simulations to be run. The simplest is a constant power, constant temperature simulation. In this type of simulation the user enters an average irradiation temperature, an end of life fluence, a burnup, an irradiation time, and a time step. The code then assumes that fluence and burnup accumulate at a constant rate over the irradiation time and calculates the conditions in the particle at each time step. This method of simulation is the fastest to setup and is useful for parametric studies interested in the effects of varying material properties on the stress distributions in a normalized particle. It does not, however, allow to user to simulate to effects of temperature and power level variation. It also does not allow the user to alter the time step over the irradiation history to reduce calculation time.
Parameter Units
Fuel Kernel Characteristics
Fuel Type
Oxygen to Uranium Ratio Atom Ratio Carbon to Uranium Ratio Atom Ratio
U-235 Enrichment Weight % Kernel Theoretical Density g/cc
Kernel Density g/cc
Kernel Diameter Am
PyC Buffer Layer Characteristics
Buffer Theoretical Density g/cc
Buffer Density g/cc
Buffer Thickness Am
General Properties of Dense PyC
PyC Modulus of Elasticity MPa PyC Poisson's Ratio
PyC Poisson's Ratio In Creep
PyC Coefficient of Thermal Expansion K
PyC Creep Coefficient (MPa 1025 n/m2 -1 PyC Swelling Strain Rate (AL/L) 10 n/mi
Irradiation Conditions in HTGR System
Irradiation Duration EFPD
End of Life Burnup % FIMA
End of Life Fluence 102 5 n/m2 Irradiation Temperature C
Internal Pressure MPa
The next more complex simulation type is the irradiation test. This method requires the user to supply an additional input file that specifies full power days, temperature, burnup, and fluence at any increment the user chooses. The code then calculates the conditions in the particle at these increments. This method is needed when temperatures and powers are not constant, and it has the additional advantage of allowing the user to adjust the time step to improve calculation efficiencies. This is particularly advantageous when simulating particles that have large end of life fluences. This is the method of simulation that is used for all of the benchmarks.
The third mode of simulation is designed specifically for the simulation of PBRs. It requires the user not only to provide an irradiation history as with the second method but also a power shape in the PBR system. This method is not used in this thesis and will not be discussed further. Additional information can be found in reference [8].
In addition to these three simulation types, the code can be run in several modes. If the user is interested in the detailed stress distributions in a nominal particle, then the code can be run in the nominal mode in which the standard deviations on all the parameters are ignored. If the user wishes to simulate a population of particles, then the code is run in sampling mode where it samples particle parameters from the input distributions in the traditional Monte Carlo sense. The user also has the option to enable or disable the failure evaluation portion of the model and to choose which failure mechanisms to consider [4].
2.3 Model Structure
Once the user provides the necessary input parameters and specifics a simulation type and mode, the code begins to execute. Assuming the user wishes to study the failure probability of a population of particles, the code first samples a particle and power history, then determines the power density and neutron flux the particle is exposed to in the next time step. It then determines the temperature distribution in the particle, the accumulated fast neutron fluence, and the quantity of fission gases released from the fuel
kernel. This information is then passed to a mechanical model that determines the stress distribution in the particle and any dimensional or material property changes due to chemical effects. The stress distributions are then passed to the failure model that determines if the particle fails. If so, simulation on this particular particle stops and another particle is sampled. If not, the particle is advanced to the next time step. Figure 2-1 shows a flowchart of this procedure.
Power Distribution in the Reactor Core
MC Outer Loop Po
1,000,000 times
I
Sample a pebble/fuel particle
Randomly re-circulate the pebble
t=t+At
Z'
Get power densit', neutron flux
T distribution in Accumulate fast FG release (Kr,Xe)
the pebble and neutron fluence PVC swiellina
Mechanical model Failure model Mechanical Chemical Stresses FP distribution Strength Pd & Ag 'Y Failed N Inreactor SI N
Figure 2-1: Flowchart for TIMCOAT Modeling Procedure 18]
If the user wishes a more simplified version of the code to run, the appropriate loops and
components can be easily deactivated by adjusting flags in the input file. A complete derivation of all the models used in TIMCOAT can be found in reference [4].
MC inner loop
6 - 10 times
2.4 Output
The output generated by the code depends on whether a nominal particle is being considered to determine its physical behavior under irradiation or if a population of particles is being simulated to determine failure probabilities. A brief summary of the output parameters that are generated for each of the three structural layers is given in Table 4-5.
Table 2-2: TIMCOAT Output Parameters
Output Parameter Function Of Format
Nominal Particle
Radial and Tangential Stress Fast neutron fluence Table Radial and Tangential Strain Fast neutron fluence Table
Displacement Fast neutron fluence Table
Swelling Rates Irradiation EFPD Table
Irradiation Temperature, Pressure Time Table
Burnup and Fluence Time Table
Sampled Population of Particles
Complete listing of input parameters for each failed particle Index Table Maximum Radial and Tangential Stress Population Average Table Minimum Radial and Tangential Stress Population Average Table Failure Probability Population Average Table Failure Cause for each failure Index Table Time, Stress, Fluence, Burnup at failure Parameter bounds Histogram Time to SiC Failure after each PyC Failure Fast neutron fluence Histogram
3 IAEA-CRP Normalized Coated Particle Benchmarks
The IAEA-CRP benchmark program for normalized coated particle fuel performance is in three parts and consists of a total of 11 cases. A normalized particle refers to one whose parameters are the mean value of the input distributions. Therefore, results from these particles are deterministic and no uncertainties are calculated. The first part consists of simple analytical calculations on simplified, un-irradiated, coated particles to test tangential stress calculations in the layers. The second part again tests simplified, coated particles and is designed to test the modeling of various mechanical properties of the pyrocarbon layers. The third part models TRISO particles under a variety of temperature and irradiation conditions. In each of these three parts, failure probabilities are not calculated. It is assumed that the particle does not fail under the given conditions, and the corresponding stress distributions in the layers are calculated. Failure probabilities will be the subject of Section 4 which includes an additional two parts.
Each case specifies a metric of comparison, which is a single parameter or several parameters from the model that are to be explicitly reported. Results for each metric from each of these three parts will be presented and discussed in turn. For reference, input parameters for each of the 11 cases can be found in Appendix I and corresponding irradiation histories can be found in Appendix II.
3.1 Part 1: Analytical Mechanical Benchmark Cases
This portion of the benchmark consists of three cases. All three consider a single normalized, un-irradiated particle. Each of the cases is described and then data for the metric of comparison is given.
3.1.1 Description of Cases
Case 1: Elastic SiC - a particle consisting of a fuel kernel, a pyrocarbon buffer and only a single structural layer, SiC, is modeled. The particle is not under any thermal stress and is subject to a constant internal and external pressure. The gradient
between these pressures creates tensile stresses in the SiC layer. The metric of comparison in this case is the maximum tensile stress in the SiC.
Case 2: Simple BISO - the particle modeled in this case is identical to the particle modeled in case 1 except that the single structural layer is now IPyC instead of SiC. Again, the metric of comparison is the maximum tangential stress in the IPyC layer.
Case 3: IPyC / SiC Composite - a particle with a fuel kernel, a buffer and two structural layers, an IPyC and SiC, is considered here. Again there are no thermal stresses and the particle is subject to constant internal and external pressures. The metric of comparison is the maximum tangential stress in each of the two structural layers.
The dimensions of each of these particles are provided in diagrams in Appendix III.
3.1.2 Results
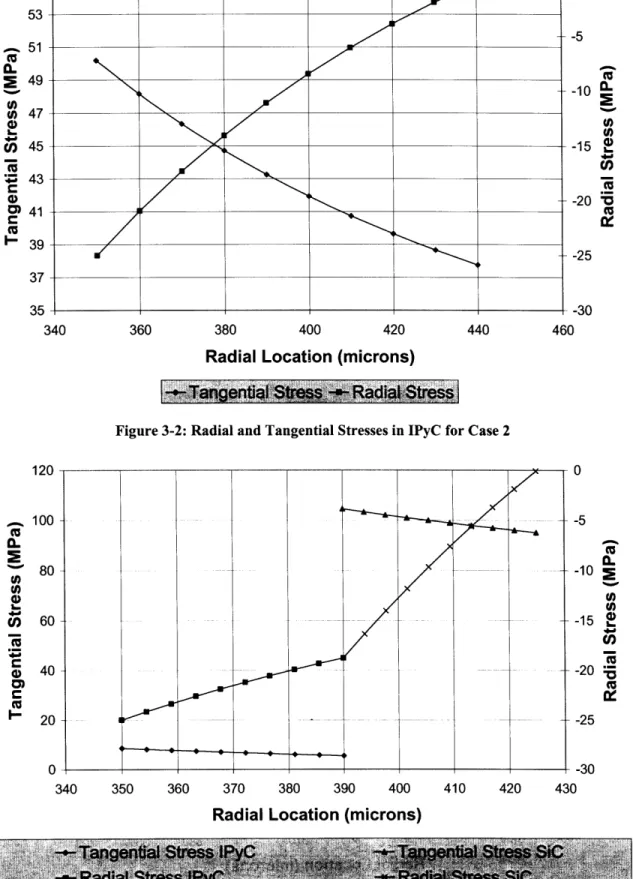
The radial and tangential stresses as a function of radial location in the structural layers are presented in Figure 3-1, Figure 3-2 and Figure 3-3 for Case 1, 2, and 3, respectively. The specific comparison metrics are shown in Table 3-1.
ILO 124 S122
w
120 . 118 0 E 116 I-114 112 345 350 355 360 365 370 375 380 385 390Radial Location (microns)
Figure 3-1: Radial and Tangential Stresses in SiC for Case 1
U -5 -10 IL -15 £s -20 V -25 -30
360 380 400 420 440 460
Radial Location (microns)
Figure 3-2: Radial and Tangential Stresses in IPyC for Case 2
0. -10 -20o -25 -30 340 350 360 370 380 390 400 410 420 430
Radial Location (microns)
Figure 3-3: Radial and Tangential Stresses in IPyC and SiC for Case 3 53 51 • 49 tA 0t -41 - 39 37 340 120 100 80 60 40 20
zx
-5 -10 -U)-15 M
-20 " -25S--*-
Tangential Stress --
*-
Radial Stress
u,
U) lE
Table 3-1: Comparison Metrics for Cases 1, 2 and 3
Case Comparison Metric Stress (MPa) 1 Maximum Tangential Stress in SiC 125.2 2 Maximum Tangential Stress in IPyC 50.20 IPyC: 8.701 3 Maximum Tangential Stresses in IPyC and SiC SiC: 104.5
Case 1 is elastic SiC, so it is simple to analytically calculate the stresses so as to confirm the results of the code. The radial and tangential stresses, a, and at, in a thick shell can be calculated as follows [9]:
2A B U
a=
- +
o,
=A
-'
3 2r3 2
Where r is the radial position in the particle and A and B are constants that come from applying boundary conditions on the radial stress,
,r
(,)
=
-i
ar
(ro)= -PO
3 Pi3 -_pr3
2 r -r,3
B= 2(P-Po)
33o
r,3
-Pi and Po refer to the internal and external pressures, respectively, and ri and ro refer to the inner and outer radii of the layer. The stresses from these calculations are compared to those from TIMCOAT in Table 3-2. They are in perfect agreement.
Table 3-2: Comparison of Analytical and TIMCOAT Calculations Case 1
Radial Position (Am)
350.000 353.889 357.778 361.667 365.556 369.444 373.333 377.222 381.111 385.000 Radial (MPa) TIMCOAT Analytical -25.000 -25.000 -21.735 -21.735 -18.611 -18.611 -15.620 -15.620 -12.754 -12.754 -10.008 -10.008 -7.375 -7.375 -4.850 -4.850 -2.426 -2.426 -0.100 -0.100 Tangenti:d (MPa) TIMCOAT Analytical 125.190 125.190 123.558 123.558 121.995 121.995 120.500 120.500 119.067 119.067 117.694 117.694 116.378 116.377 115.115 115.115 113.903 113.903 112.740 112.740
3.1.3 Discussion
These first three cases are sufficiently simple that it is possible to predict the nature of the results a priori. It is expected that the radial stresses will be equal to the prevailing pressure at the inner surface and then decrease in magnitude through the structural layers to equal the lower external pressure at the outer surface. If the structural layers were planer or cylindrical, then the stresses would decrease linearly through the layer as the cross-sectional area at each location would be constant. As the structural layers are spherically shaped, however, the cross-sectional area increases through the layer, and so it is expected that the rate of decrease of stress in going from the inner surface to the outer surface decreases. These two phenomena are clearly seen in Figure 3-land Figure 3-2.
An important assumption that TIMCOAT makes is shown Figure 3-3. The radial stress between the outer surface of the IPyC and the inner surface of the SiC is continuous. This boundary condition is set in the code for computational efficiency. It is an assumption that the code makes that is not necessarily physically accurate. In situations were the layers might become debonded or lose integrity during irradiation, it would not be expected that the radial stresses from one layer to the next be continuous. Accordingly, this assumption introduces some error into the code's calculations that is not presently quantifiable.
With regard to the tangential stresses, it should be the case that they be largest in magnitude where the radial stresses are largest and that they exhibit the same concavity
3.2 Part 2: Pyrocarbon Mechanical Response Benchmark Cases
The next four cases in the benchmarking program study the variation of stress distributions in pyrocarbon due to irradiation effects. Under irradiation, pyrocarbon experiences dimensional changes and because PyC is a heterogeneous mixture of anisotropic graphite crystallites, its behavior is complicated. There are two important phenomena, irradiation induced swelling and irradiation induced creep.
Irradiation induced swelling in PyC is dominated by two mechanisms, densification and microstructure reorientation. PyC layers are manufactured by a vapor deposition process that deposits thin planes of material on the fuel microsphere. As the PyC is irradiated, coalescence of vacancies and voids shrinks the PyC parallel to the deposition plane; this is densification. Interstitial defects cause crystallites to reorient and grow perpendicular to the plane; this is reorientation. During the manufacture process, thermal shrinkage cracks form and are preferentially aligned parallel to the coating plane. These cracks provide space for initial reorientation, and so when PyC is first irradiated, only densification is observed and the material experiences a net decrease in volume. As the dose to the material increases, the competition between densification and reorientation results in increased porosity parallel to the coating plane and the shrinkage rate drops, eventually to zero. After this point, additional irradiation results in an increasing rate of swelling perpendicular to the coating plane both as a result of reorientation and the porosity being generated. Consequently, the PyC volume shrinkage stops, and the volume begins to increase until differential strains result in disintegration [10]. Figure 3-4 illustrates this process. In the figure the circles represent voids, and the bars represent graphite crystallites.
Oo00c&o
00OW00O0
o
K
LZ2> Oo
io~
iI De-f-toOa
00
~0Reorientation -- I T t Densification Reorientation TangentialLow Neutron Fluence High Neutron Fluence
Figure 3-4: Illustration of Irradiation Induced Dimensional Changes in PyC [4]
This swelling behavior is, in general, a function of PyC density, anisotropy, temperature, and the fast neutron fluence. A new correlation must be developed to model the swelling behavior each time one of these parameters changes. TIMCOAT examines a set of experimental results presented in reference [11 ], known as CEGA-002820, to create a database for the dependence of the swelling rate on each of these parameters. It interpolates between points in this database to develop a radial and tangential swelling correlation for every individual particle that is modeled. Where appropriate, however, the benchmark cases specify a correlation to be used, and TIMCOAT has been adapted to use these correlations. It was noticed, however, that the results obtained with the benchmark correlation and with the TIMCOAT database differ in some cases, and so both results will be presented.
The other important irradiation induced dimensional effect in PyC is creep, which refers to the time dependent deformation of the PyC under a constant stress as a result of irradiation damage to its structure. Creep is described by two parameters. The creep coefficient specifies the fractional radial deformation per unit stress per unit fluence and the Poisson's ratio in creep is used in describing the corresponding tangential deformation. TIMCOAT is capable of calculating both of these parameters from information found in CEGA-002820 in a similar fashion that it calculates swelling. Again, the benchmark cases specify these two parameters when needed, and these can be
used to replace the TIMCOAT calculations. As with swelling, differences were noticed between the two sets of parameters, and results for both are provided.
3.2.1 Description of Cases
The four cases in this part of the benchmark all consider the same type of particle and conditions. The particle consists of a fuel kernel, a low density buffer, and two structural layers, an IPyC and a SiC. The particles are subject to constant internal and external pressures, a constant temperature and a constant fast neutron flux. It is assumed that no fissions occur in the particle and that, therefore, the burnup in the particle is zero. The cases differ only in how the irradiation creep and swelling are handled. For all cases the metrics of comparison are plots of the maximum tangential stress in the IPyC and SiC as a function of fast neutron fluence. The remainder of the input parameters for these cases is in Appendix I, irradiation histories are located in Appendix II, and dimensional sketches are presented in Appendix III.
Case 4a) No Creep / Constant Swelling
Table 3-3: PyC Irradiation Properties for Case 4a Parameter Units IAEA Value
Radial Swelling Correlation (AL/L) /1025 n/m2 -0.005x Tangential Swelling Correlation (AL/L) /1025 n/m3
-0.005x
Creep Coefficient (MPa 1025 n/m2 )-1 0
Poisson's Ratio In Creep 0
It is noted that the swelling correlation is given as a function of "x" which refers to the fast neutron fluence (1025 neutrons / m2) for energies greater then 0.18 MeV. This usage
of "x" will remain consistent throughout this thesis. No TIMCOAT calculated values are used here.
Case 4b) Constant Creep / No Swelling
Table 3-4: PyC Irradiation Properties for Case 4b
Parameter Units IAEA Value Calculated Value
Radial Swelling Correlation (AL/L) /1025 n/m2 0
Tangential Swelling Correlation (AL/L) /1025 n/m3 0 Creep Coefficient (MPa 1025 n/m2 )-1 2.71E-04
IPyC: 1.36E-04
The calculated values in Table 3-4 refer to values determined by TIMCOAT from its database drawn from information presented in CEGA-002820. A blank cell in the calculated values column indicates that the IAEA Value is being used.
Case 4c) Constant Creep / Constant Swelling
Table 3-5: PyC Irradiation Properties for Case 4c
Parameter Units IAEA Value Calculated Value
Radial Swelling Correlation (AL/L) /1025 n/m2 -0.005x Tangential Swelling Correlation (AL/L) /1025 n/m3 -0.005x
Creep Coefficient (MPa 1025 n/m2 )-I 2.71E-04 IPyC: 1.36E-04 Poisson's Ratio In Creep 0.5
Case 4d) Constant Creep / Fluence Dependent Swelling
Table 3-6: PyC Irradiation Properties for Case 4d
Parameter Units IAEA Value Calculated Value
1.36334E-03x3 1.40357 E-03x3
-7.77024 E-03x2
-9.12192 E-03x2 +2.00861E-02x +2.31797 E-02x Radial Swelling Correlation (AL/L) /1025 n/m2 -2.22642E-02 -2.34047 E-02
-3.53804E-04x3 -6.01503E-04x3 +1.69251E-03x2 +2.53955E-03x2 +2.63307E-03x +2.35463E-03x Tangential Swelling Correlation (AL/L) /1025 n/m3
-1.91253E-02 -1.97986E-02 Creep Coefficient (MPa 1025 n/m2 )-1 2.71E-04 IPyC: 1.36E-04
Poisson's Ratio In Creep 0.5
3.2.2 Results and Discussion Case 4a
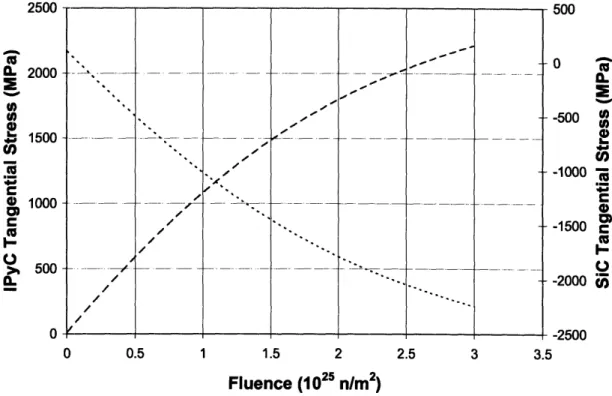
Figure 3-5 displays the tangential stresses in the IPyC and SiC layers as a function of fast neutron fluence. The maximum tangential stresses occurred at the inner surfaces of the two layers. The stress in the IPyC layer starts out as a tensile stress and increases in magnitude during irradiation. The stress in the SiC layer begins as a tensile stress and
LOUV -L.
2000-2
4. 1500-U) Q1000- I->r 500-0. / / / / / / / /-
7-01---. 0 0.5 1 1.5 2 2.5 3 3.5 Fluence (1025 n/m2)Figure 3-5: Maximum Tangential Stresses in IPyC and SiC Layers for Case 4a
The behavior of these stresses bears some analysis. At the beginning of the irradiation cycle, there are no tangential stresses in the IPyC or SiC layer. As the irradiation proceeds, the IPyC begins to shrink uniformly due to the assumed model of irradiation induced swelling. This shrinkage would lead to a decrease in the radius of the IPyC. Remember, however, that Young's modulus of the SiC is almost an order of magnitude larger then that of the IPyC, so the SiC can be thought of as rigid, holding the IPyC and preventing it from shrinking. This force holding the IPyC at a larger radius creates tension, and as it continues to shrink over the irradiation period, the magnitude of this tension increases. Correspondingly, because of the bond between the SiC layer and the IPyC layer, the shrinkage of the IPyC pulls the inner surface of the SiC layer toward the center of the particle, resulting in an increasing compressive stress. By modeling the swelling in this particle as a uniform rate of shrinkage, the effects of the densification mechanism are expressed. As there is no relaxation in the shrinkage as the cycle progresses, the reorientation mechanism is suppressed.
nrr\~ ,,1 ,,
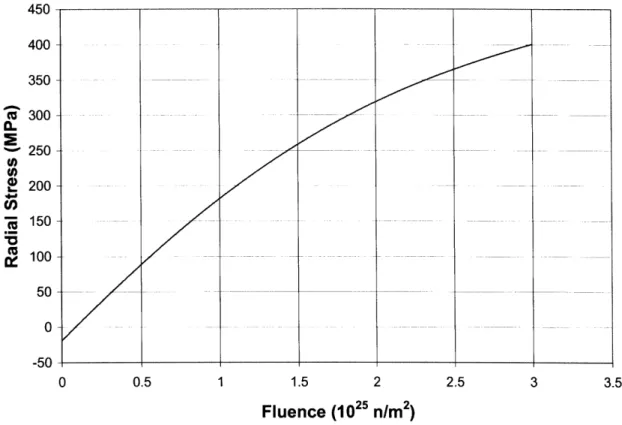
--I,=ff I -0 am -1500-000 --1500I--Figure 3-6 shows the radial stress at the IPyC/SiC interface as a function of fast neutron fluence. The stress is tensile and increases in magnitude with fluence. The maximum value of 400.6 MPa occurs at the end of the simulation. This behavior is consistent with the continued shrinkage of the IPyC attempting to pull away from the SiC layer.
450 400 350 300 250 U) 2 200 150
S100
0 0.5 1 1.5 2 2.5 3 3.5 Fluence (1025 nlm2)Figure 3-6: Radial Stress at the IPyC/SiC Interface for Case 4a
3.2.3 Results and Discussion Case 4b
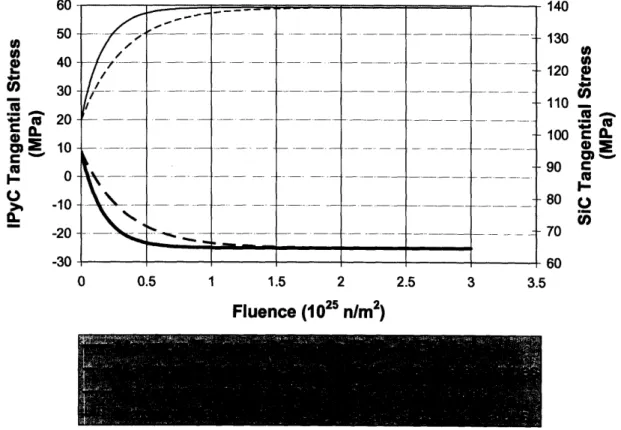
Figure 3-7 shows the tangential stresses at the inner surfaces of the two structural layers both for the IAEA recommended value of the creep coefficient and the TIMCOAT calculated value. For this particular case, it is difficult to identify a cross-section in one of the layers that has the maximum stress throughout irradiation, so the inner surface was selected instead as indicated by the benchmark. The stress distributions are different than those found in Case 4a. The PyC in this particle is modeled as being susceptible to irradiation creep but not swelling. The creep allows the PyC to slowly deform under the high internal pressure. As a result, the stress in the IPyC decreases rapidly until the tangential compressive stress is equal to the outward force of the internal pressure. The
effect in the SiC layer is opposite. As the IPyC expands by creep, it presses against the SiC thereby increasing the tensile stress in the SiC layer. As is expected, the increase in the stress in the SiC stops once the IPyC has come to equilibrium. This behavior uncovers an unexpected effect of the internal pressure. As the internal pressure causes creep that places the IPyC into compression, it can offset the effects of swelling shown in Case 4a and actually help to relax the stresses in the IPyC layer.
Table 3-4 indicates that the creep coefficient calculated by TIMCOAT is almost exactly half what is specified in the IAEA benchmarks. The benchmark document, which can be found in Appendix IV, states that the creep coefficient for this case is a factor of two larger than the value found in the literature. This gives confidence in TIMCOAT's calculations. The reason for doubling the coefficient was not given and as will be discussed in Section 4.1.2, using such a large coefficient proves to be problematic in later cases. As such, results for the TIMCOAT calculated value are shown in Figure 3-7 as well. It is seen in the figure that the smaller creep coefficient implies a longer relaxation time but the same asymptotic stresses.
60 50 40 30 20 10 0 -10 -20 -30 0 0.5 1 1.5 2 Fluence (1025 n/m2) 14U 130 120 110 100 90 80 70 60 2.5 3 3.5
Figure 3-7: Inner Surface Tangential Stresses in IPyC and SiC Layers for Case 4b
Figure 3-8 shows how the effects of irradiation creep propagate through the IPyC layer over the course of the irradiation. The curves in the figure track the radial stresses in successive evenly distributed shells of the IPyC. It is seen that the effect of the creep on the radial stress is also to cause an equilibration with the internal pressure of 25 MPa over the course of the irradiation.
-18 -19 -20 S-21 U) U, 2-22 -23 cu -24 -25 -26 0.001 0.01 0.1 Fluence (1025 n/m2)
Figure 3-8: Radial Stress Profile in IPyC Layer for Case 4b
3.2.4 Results and Discussion Case 4c
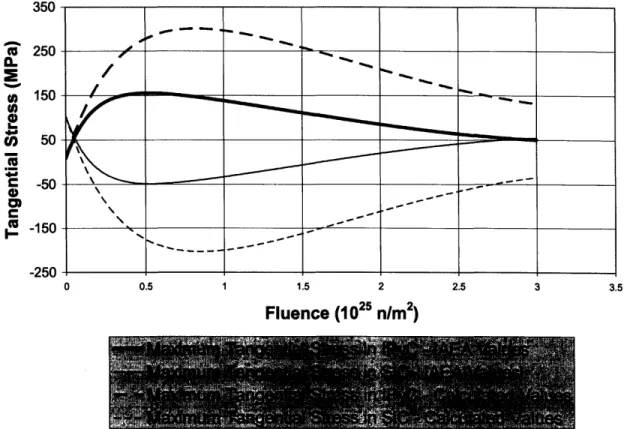
In this case the IPyC is assumed to be affected by both irradiation swelling and creep. Figure 3-9 shows the tangential stresses at the inner surface of the two structural layers for both the IAEA specified creep coefficient and the TIMCOAT calculated one. First, consider the general behavior of the stress in the IPyC. At the beginning of the irradiation cycle, the stress rises rapidly. Consulting the results in Case 4a, this is easily attributed to the densification associated with low fluence swelling. At fluences of about
0.5 and 0.8x1025 n/m2 for the IAEA and TIMCOAT calculated parameters, respectively,
Inner Surface of SiC
nnerSurac of PC
Inner Surface of IPyC
the stress reaches a maximum, and then begins to decline. From the results in Case 4b, this decline is attributable to the stress relaxation caused by creep. The stress in the SiC layer is determined by the changes taking place in the IPyC as described in Sections 3.2.2 and 3.2.3. The swelling places the SiC into compression, and the creep restores the tensile stress.
It is very important to note the differences between the stress behaviors that are caused by varying the creep coefficient. Recall that the TIMCOAT calculated creep coefficient is half that of the value prescribed in the benchmark document. Figure 3-9 shows that when the creep coefficient is halved, the maximum stress in IPyC layer is doubled. This is significant when considering failure mechanisms for the IPyC layer. Using a smaller creep coefficient increases the probability of cracking the IPyC early in the irradiation history. For the SiC layer, halving the creep coefficient about doubles the compressive stress in the layer. From Figure 3-9 it is seen that for the smaller coefficient, once the tangential stress becomes compressive, it remains that way throughout the irradiation. For the larger coefficient, however, the stress again becomes tensile toward the end of the cycle. This is significant as the strength of the SiC layer decreases with irradiation damage, and the end of life tensile stress could lead to an increased probability of direct SiC layer failure. It is reasonable to conclude then that the difference in these creep coefficients could have a significant effects in the relative importance of different mechanisms of particle failure and on the overall probability of particle failure.
Figure 3-10 shows the radial stress profile in the IPyC layer as a function of fast neutron fluence. The behavior of the stresses follows the same pattern as the tangential stresses in the IPyC.
350 250 150 50 -50 -150 -250 Fluence (1025 n/m2)
Figure 3-9: Inner Surface Tangential Stresses in IPyC and SiC Layers for Case 4c
15 10 5
0
U-5 U) -10 -15 -20 -25 -30 0 0.5 1 1.5 2 2.5 3 3.5 Fluence (1025 n/mr)Figure 3-10: Radial Stress Profile in IPyC Layer for Case 4c
/ I ---
3.2.5 Results and Discussion Case 4d
This case differs from Case 4c only in that the swelling rate is not constant and not isotropic but, rather, depends on fluence. Figure 3-11 shows this dependence for the swelling correlation given in the benchmark document as well as for the TIMCOAT determined correlation. The two correlations are in very good agreement at low fluences and then begin to diverge slightly toward the end of the irradiation history. It is difficult to determine if this divergence reflects a substantive difference in the assumed swelling behavior or is simply an artifact of different interpolation procedures. This is noted here
as it will become significant in cases that run to higher fluences.
0 0.5 1 1.5 2 2.5
Fluence (1025 n/m2)
3 3.5 4
Figure 3-11: Radial and Tangential Swelling Rates for Case 4d
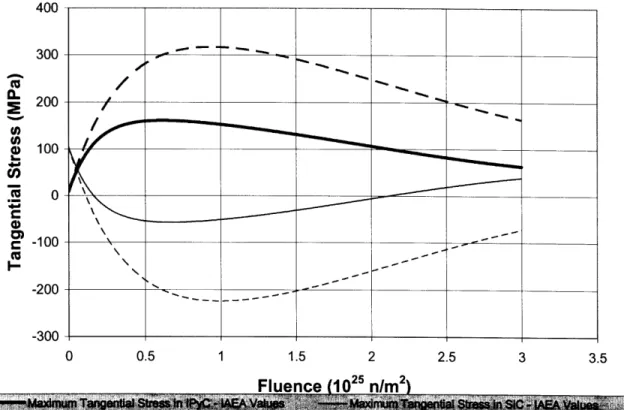
Using these two sets of swelling correlations and the combination of creep coefficients indicated in Table 3-6, the tangential and radial stresses at the inners surfaces of the two structural layers presented were obtained. These results are shown in Figure 3-12 and Figure 3-13. A
10%
C4 EC
0 -JV
a, 0r, (0 0.015 0.01 0.005 0 -0.005 -0.01 -0.015 -0.02 -0.025 -0.03"+uu 300 200 100 0 .-100 I--200 -300 0 0.5 1 1.5 2 2.5 3 3.5
Figure 3-12: Inner Surface Tangential Stresses in IPyC and SiC Layers for Case 4d
10 5 -10 U) -5 I-cW -10 S-15 -20 -25 -30 0 0.5 1 1.5 2 2.5 3 3.5 Fluence (1025 n/m2)
Figure 3-13: Radial Stress Profile in IPyC Layer for Case 4d nr\n
The results of this case are very similar to those found in Case 4c. The IAEA and TIMCOAT calculated curves differ because of the differing creep coefficients and slightly smaller end of cycle swelling. As compared with the uniform, isotropic swelling in Case 4c, the larger shrinkage rate at the beginning of the irradiation cycle led to a higher peak tensile tangential stress in the IPyC layer and a larger peak compressive tangential stress in the SiC layer. The reversal of the dimensional changes from shrinkage to swelling at the end of the cycle had little effect on the tangential stresses. In both cases 4c and 4d the stress in the two structural layers changes about the same amount from their peak to end of life values. This indicates the dominance of the creep mechanism at higher fluences. The behavior of the radial stresses is similar to that found in Case 4c and is otherwise unremarkable.
3.3 Part 3: Nominal TRISO Benchmark Cases
The next four cases in the benchmark study look at coated particles with three structural layers, IPyC/SiC/OPyC. As in Part 2, single, normalized particles are considered. The effects of varying kernel diameter and PyC anisotropy are examined as well as the effects of varying temperatures and pressures during irradiation. In all four cases, the metrics of comparison are the maximum tangential stress in the IPyC and SiC layers as a function of fast neutron fluence. Again, results using both values from the benchmark document and TIMCOAT calculations are presented. In addition to the TIMCOAT calculated swelling and creep, which was discussed in Part 2, TIMCOAT calculated PyC Poisson's ratios in creep will be added. These ratios are dynamic with respect to fast neutron fluence and are drawn from data presented by Kaae [12]. Kaae indicates that the value of the Poisson's ratio appears to depend on the effective creep strain which can be related to the fast neutron fluence.
3.3.1 Description of Cases
The input parameters listed in the benchmark document for cases 5 through 8 can be found in Appendix I, and the irradiation histories are located in Appendix II. Dimensional diagrams are shown in Appendix III. For cases 5 - 7 the TRISO particle is
assumed to be irradiated at a constant temperature and neutron flux with internal pressure in the particle and burnup in the kernel accumulating linearly over the irradiation cycle. In case 8, the particle is assumed to be irradiated under a constant flux, but the temperature is cycled. Table 3-7, Table 3-8 and Table 3-9 summarizes the PyC properties used for cases 5, 6 and 7 respectively.
Case 5) TRISO Particle with 350 pm Kernel
Table 3-7: PyC Irradiation Properties for Case 5
Parameter Units IAEA Value Calculated Value
Radial Swelling Correlation (AL/L) /1025 n/m2 See Table 3-6 Tangential Swelling Correlation (AL/L) /1025 n/m3
Creep Coefficient (MPa 1025 n/m2 )-1 2.71E-04 1.36E-04 x < 0.3: 0.5 - x/3 Poisson's Ratio In Creep 0.5 x > 0.3: 0.4
The properties of the PyC in case 5 are identical swelling correlations are the same.
Case 6) TRISO Particle with 500 Am Kernel
to those in case 4d. Accordingly, the
Table 3-8: PyC Irradiation Properties for Case 6
Parameter Units IAEA Value Calculated Value
Radial Swelling Correlation (AL/L) /1025 n/m2 See Table 3-6 Tangential Swelling Correlation (AL/L) /1025 n/m3
Creep Coefficient (MPa 1025 n/m2 )-1 2.71E-04 1.36E-04 x < 0.3: 0.5 - x/3 Poisson's Ratio In Creep 0.5 x > 0.3: 0.4
Case 7) TRISO Particle with High Anisotropy
Table 3-9: PyC Irradiation Properties for Case 7
Parameter Units IAEA Value Calculated Value
+7.27026E-04x3 +1.29933E-03x3 -5.05553E-03x2 -9.28014E-03x2 +1.83715E-02x +2.58697E-02x Radial Swelling Correlation (AL/L) /1025 n/m2 -2.12522E-02 -2.32152E-02
-8.88086E-04x3 -5.44594E-04x3 +5.03465E-03x2 +2.5893E-03x2 -3.42182E-03x +1.02187E-03x Tangential Swelling Correlation (AL/L) /1025 n/m3 -1.79113E-02 -1.98942E-02 Creep Coefficient (MPa 1025 n/ 2
)-1 2.71E-04 1.36E-04 x < 0.3: 0.5 - x/3 Poisson's Ratio In Creep 0.5 x > 0.3: 0.4
Case 8) TRISO Particle with Cyclic Temperature
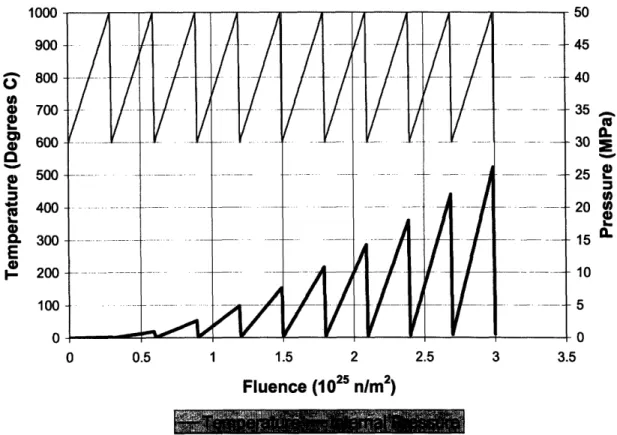
This case is intended to model the temperature and pressure history a TRISO particle would encounter in flowing through and being recycled in a PBR but it still only considers a normalized particle. The temperature in the particle is increased linearly from 6000C to 10000C, then dropped immediately back to 6000C, and cycled again in this
fashion a total of 10 times. To avoid singularities in the rate of temperature change during simulation, this drop was spread over a small time. The corresponding internal pressure in the particle followed a similar pattern of cyclical gradual rise followed by immediate drop. The pressure and temperature history inputs used for this case are shown in Figure 3-14. Fast neutron fluence and burnup are assumed to accumulate linearly over time. This is an approximation, as realistically fissions would stop during the cooling phase as the particle is recycled to the top of the PBR.
4) 0 0 a E I-1000 900 800 700 600 500 400 300 200 100 0 0 0.5 1 1.5 2 2.5 3 Fluence (1025nlm2) 45 40 35 30 25 20 15 10 5 0 3.5
Figure 3-14: Temperature and Internal Pressure Histories for Case 8
Table 3-10 gives the PyC materials properties for this case. Unlike in all previous cases where the irradiation induced creep coefficient is a constant over the cycle, the varying temperatures here lead to a varying creep coefficient as shown in Figure 3-15. As in previous cases the creep coefficient chosen in the benchmark documents is about twice
that of the TIMCOAT calculated value.
Table 3-10: PyC Irradiation Properties for Case 8
Parameter Units IAEA Value Calculated Value +4.03266E-04x3 +6.4176E-04x3 -2.25937E-03x2 -4.230376E-03x2 +9.82884E-03x 1.32541E-02x Radial Swelling Correlation (AL/L) /1025 n/m2 -1.80613E-02 -1.89504E-02
-4.91648E-04x3 -3.43626E-04x3 +2.32979E-03x2 +9.65679E-04x2 +1.71315E-03x +4.77559E-03x Tangential Swelling Correlation (AL/L) 1025 n/ 3 -1.78392E-02 -1.95471E-02 Creep Coefficient (MPa 1025 n/m2 )- See Figure 3-15
x < 0.3: 0.5 - x/3 Poisson's Ratio In Creep 0.5 x > 0.3: 0.4